Zip Codes with the Highest Percentage of Population Employed in Installation, Maintenance & Repair in Yorba Linda, CA
RELATED REPORTS & OPTIONS
Installation, Maintenance & Repair
Yorba Linda
Compare Zip Codes
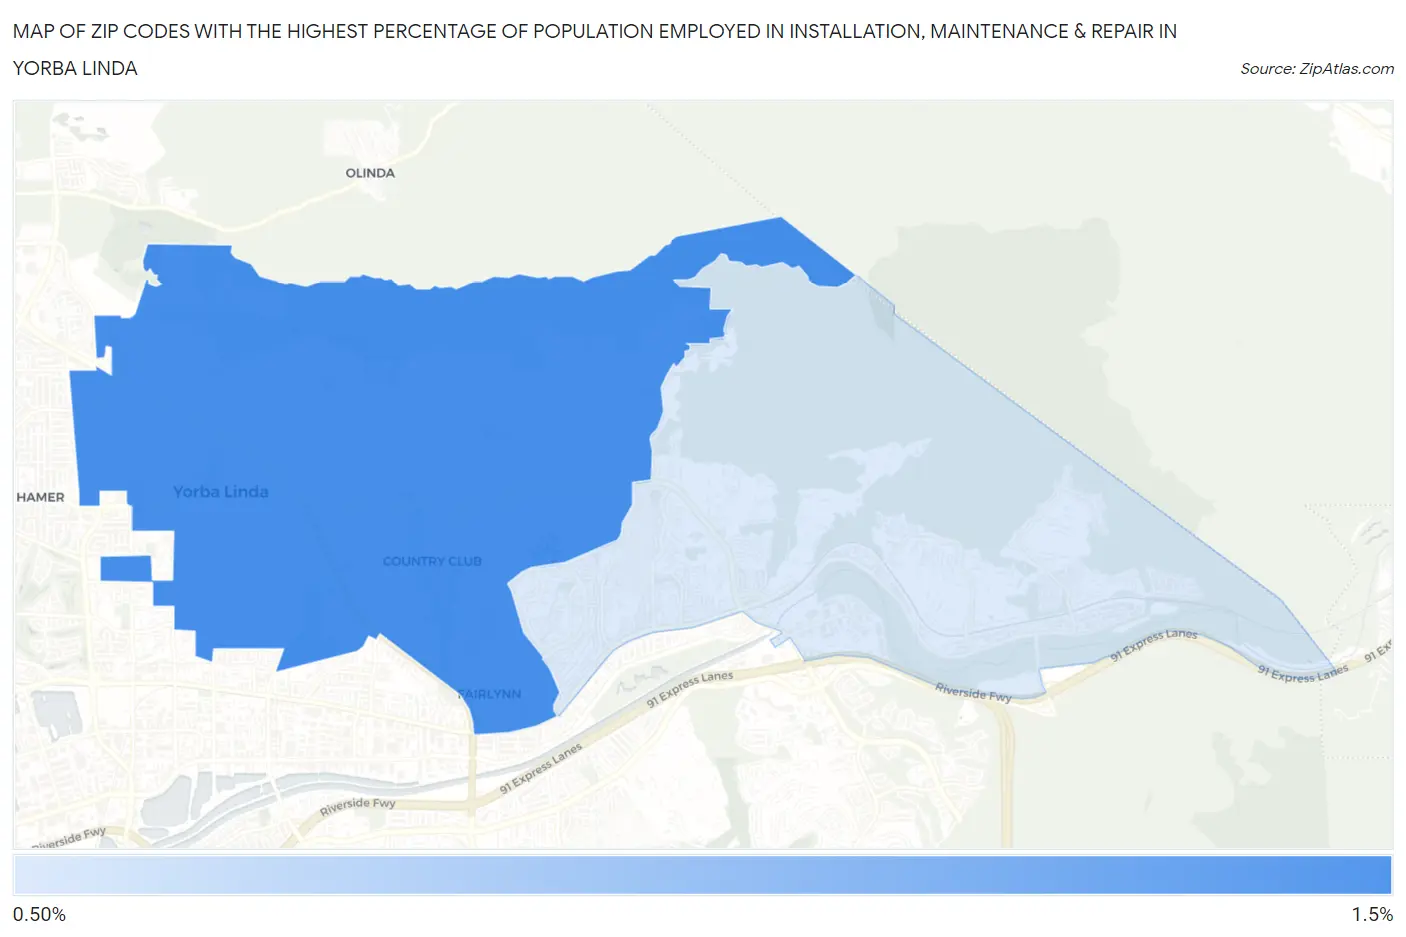
Map of Zip Codes with the Highest Percentage of Population Employed in Installation, Maintenance & Repair in Yorba Linda
0.99%
1.4%
Zip Codes with the Highest Percentage of Population Employed in Installation, Maintenance & Repair in Yorba Linda, CA
| Zip Code | % Employed | vs State | vs National | |
| 1. | 92886 | 1.4% | 2.6%(-1.15)#1,143 | 3.1%(-1.66)#24,524 |
| 2. | 92887 | 0.99% | 2.6%(-1.56)#1,253 | 3.1%(-2.08)#25,948 |
1
Common Questions
What are the Top Zip Codes with the Highest Percentage of Population Employed in Installation, Maintenance & Repair in Yorba Linda, CA?
Top Zip Codes with the Highest Percentage of Population Employed in Installation, Maintenance & Repair in Yorba Linda, CA are:
What zip code has the Highest Percentage of Population Employed in Installation, Maintenance & Repair in Yorba Linda, CA?
92886 has the Highest Percentage of Population Employed in Installation, Maintenance & Repair in Yorba Linda, CA with 1.4%.
What is the Percentage of Population Employed in Installation, Maintenance & Repair in Yorba Linda, CA?
Percentage of Population Employed in Installation, Maintenance & Repair in Yorba Linda is 1.3%.
What is the Percentage of Population Employed in Installation, Maintenance & Repair in California?
Percentage of Population Employed in Installation, Maintenance & Repair in California is 2.6%.
What is the Percentage of Population Employed in Installation, Maintenance & Repair in the United States?
Percentage of Population Employed in Installation, Maintenance & Repair in the United States is 3.1%.