Cities with the Highest Percentage of Immigrants from Iraq in California
RELATED REPORTS & OPTIONS
Iraq
California
Compare Cities
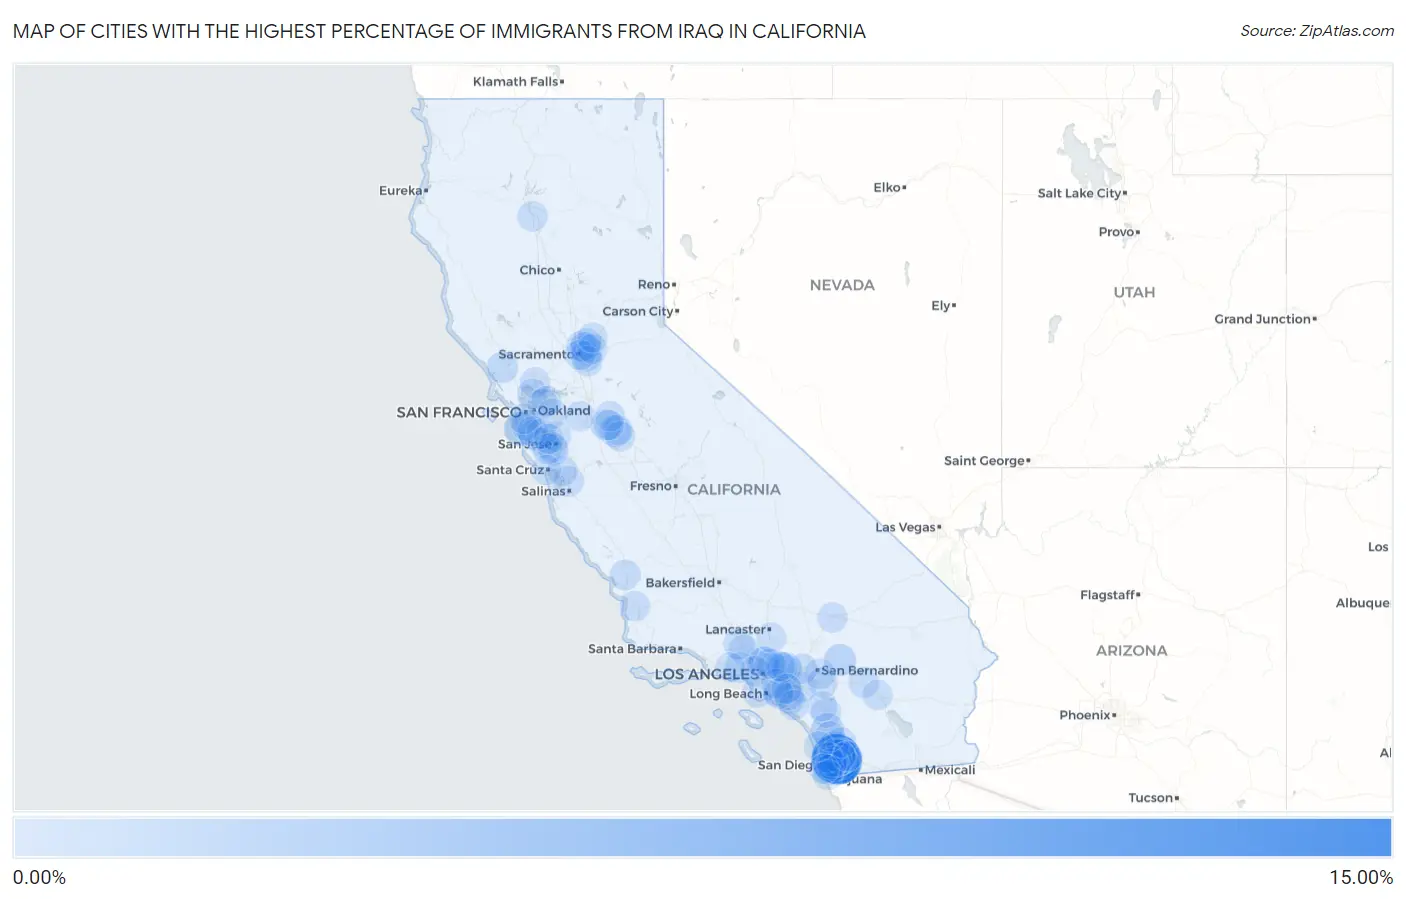
Map of Cities with the Highest Percentage of Immigrants from Iraq in California
0.00%
15.00%
Cities with the Highest Percentage of Immigrants from Iraq in California
| City | Iraq | vs State | vs National | |
| 1. | El Cajon | 12.19% | 0.10%(+12.1)#-1 | 0.071%(+12.1)#0 |
| 2. | Rancho San Diego | 10.17% | 0.10%(+10.1)#0 | 0.071%(+10.1)#1 |
| 3. | Granite Hills | 7.14% | 0.10%(+7.03)#1 | 0.071%(+7.07)#2 |
| 4. | Jamul | 4.60% | 0.10%(+4.50)#2 | 0.071%(+4.53)#3 |
| 5. | Bostonia | 4.30% | 0.10%(+4.20)#3 | 0.071%(+4.23)#4 |
| 6. | Montara | 2.49% | 0.10%(+2.39)#4 | 0.071%(+2.42)#5 |
| 7. | Winter Gardens | 2.16% | 0.10%(+2.06)#5 | 0.071%(+2.09)#6 |
| 8. | Spring Valley Cdp San Diego County | 2.03% | 0.10%(+1.93)#6 | 0.071%(+1.96)#7 |
| 9. | Hidden Meadows | 1.92% | 0.10%(+1.82)#7 | 0.071%(+1.85)#8 |
| 10. | Lakeside | 1.78% | 0.10%(+1.68)#8 | 0.071%(+1.71)#9 |
| 11. | Glendale | 1.49% | 0.10%(+1.39)#9 | 0.071%(+1.42)#10 |
| 12. | Santee | 1.36% | 0.10%(+1.26)#173 | 0.071%(+1.29)#416 |
| 13. | Big Bear Lake | 1.13% | 0.10%(+1.02)#174 | 0.071%(+1.06)#417 |
| 14. | Crest | 1.04% | 0.10%(+0.934)#175 | 0.071%(+0.967)#418 |
| 15. | Casa De Oro Mount Helix | 0.99% | 0.10%(+0.888)#176 | 0.071%(+0.922)#419 |
| 16. | La Presa | 0.97% | 0.10%(+0.867)#177 | 0.071%(+0.900)#420 |
| 17. | Sebastopol | 0.85% | 0.10%(+0.749)#178 | 0.071%(+0.782)#421 |
| 18. | Turlock | 0.83% | 0.10%(+0.728)#179 | 0.071%(+0.761)#422 |
| 19. | Baywood Park | 0.77% | 0.10%(+0.667)#180 | 0.071%(+0.700)#423 |
| 20. | Carmichael | 0.63% | 0.10%(+0.527)#181 | 0.071%(+0.560)#424 |
| 21. | Modesto | 0.59% | 0.10%(+0.481)#182 | 0.071%(+0.515)#425 |
| 22. | La Mesa | 0.50% | 0.10%(+0.397)#183 | 0.071%(+0.430)#426 |
| 23. | Hasley Canyon | 0.49% | 0.10%(+0.381)#184 | 0.071%(+0.415)#427 |
| 24. | Antelope | 0.48% | 0.10%(+0.375)#185 | 0.071%(+0.408)#428 |
| 25. | Garnet | 0.48% | 0.10%(+0.374)#186 | 0.071%(+0.407)#429 |
| 26. | Rosemont | 0.46% | 0.10%(+0.353)#187 | 0.071%(+0.386)#430 |
| 27. | Calabasas | 0.41% | 0.10%(+0.307)#188 | 0.071%(+0.340)#431 |
| 28. | Atascadero | 0.40% | 0.10%(+0.293)#189 | 0.071%(+0.326)#432 |
| 29. | Villa Park | 0.40% | 0.10%(+0.292)#190 | 0.071%(+0.325)#433 |
| 30. | Poway | 0.39% | 0.10%(+0.284)#191 | 0.071%(+0.317)#435 |
| 31. | East Pasadena | 0.35% | 0.10%(+0.243)#192 | 0.071%(+0.276)#436 |
| 32. | Rio Linda | 0.30% | 0.10%(+0.191)#193 | 0.071%(+0.225)#437 |
| 33. | Emerald Lake Hills | 0.29% | 0.10%(+0.190)#194 | 0.071%(+0.223)#438 |
| 34. | Millbrae | 0.29% | 0.10%(+0.190)#195 | 0.071%(+0.223)#439 |
| 35. | Corona | 0.28% | 0.10%(+0.178)#196 | 0.071%(+0.212)#440 |
| 36. | Loma Linda | 0.28% | 0.10%(+0.173)#197 | 0.071%(+0.207)#441 |
| 37. | Lemon Grove | 0.27% | 0.10%(+0.169)#198 | 0.071%(+0.202)#442 |
| 38. | El Sobrante Cdp Riverside County | 0.27% | 0.10%(+0.168)#199 | 0.071%(+0.201)#443 |
| 39. | Anderson | 0.27% | 0.10%(+0.162)#200 | 0.071%(+0.196)#444 |
| 40. | Prunedale | 0.26% | 0.10%(+0.154)#201 | 0.071%(+0.187)#445 |
| 41. | American Canyon | 0.25% | 0.10%(+0.150)#202 | 0.071%(+0.183)#446 |
| 42. | Temecula | 0.24% | 0.10%(+0.134)#203 | 0.071%(+0.167)#447 |
| 43. | Rolling Hills Estates | 0.23% | 0.10%(+0.127)#204 | 0.071%(+0.161)#448 |
| 44. | La Crescenta Montrose | 0.23% | 0.10%(+0.125)#205 | 0.071%(+0.158)#449 |
| 45. | Ramona | 0.23% | 0.10%(+0.122)#206 | 0.071%(+0.155)#450 |
| 46. | Cambrian Park | 0.23% | 0.10%(+0.121)#207 | 0.071%(+0.155)#451 |
| 47. | Hercules | 0.22% | 0.10%(+0.115)#208 | 0.071%(+0.148)#452 |
| 48. | North Highlands | 0.20% | 0.10%(+0.096)#209 | 0.071%(+0.129)#453 |
| 49. | Lafayette | 0.20% | 0.10%(+0.094)#210 | 0.071%(+0.127)#454 |
| 50. | Stevenson Ranch | 0.20% | 0.10%(+0.091)#211 | 0.071%(+0.125)#455 |
| 51. | Indio | 0.19% | 0.10%(+0.090)#212 | 0.071%(+0.123)#456 |
| 52. | Vineyard | 0.19% | 0.10%(+0.088)#213 | 0.071%(+0.122)#457 |
| 53. | Denair | 0.19% | 0.10%(+0.082)#214 | 0.071%(+0.116)#458 |
| 54. | Daly City | 0.18% | 0.10%(+0.073)#215 | 0.071%(+0.107)#459 |
| 55. | Delhi | 0.17% | 0.10%(+0.070)#216 | 0.071%(+0.104)#460 |
| 56. | Beverly Hills | 0.17% | 0.10%(+0.063)#217 | 0.071%(+0.096)#461 |
| 57. | Contra Costa Centre | 0.16% | 0.10%(+0.056)#218 | 0.071%(+0.089)#462 |
| 58. | Loyola | 0.16% | 0.10%(+0.053)#219 | 0.071%(+0.086)#463 |
| 59. | San Dimas | 0.15% | 0.10%(+0.044)#220 | 0.071%(+0.077)#464 |
| 60. | Tracy | 0.14% | 0.10%(+0.041)#221 | 0.071%(+0.074)#465 |
| 61. | Riverbank | 0.14% | 0.10%(+0.037)#222 | 0.071%(+0.070)#466 |
| 62. | Nipomo | 0.14% | 0.10%(+0.035)#223 | 0.071%(+0.068)#467 |
| 63. | Sacramento | 0.14% | 0.10%(+0.031)#224 | 0.071%(+0.065)#468 |
| 64. | Barstow | 0.13% | 0.10%(+0.031)#225 | 0.071%(+0.064)#469 |
| 65. | Irvine | 0.13% | 0.10%(+0.030)#226 | 0.071%(+0.064)#470 |
| 66. | Milpitas | 0.13% | 0.10%(+0.026)#227 | 0.071%(+0.060)#471 |
| 67. | Stanton | 0.13% | 0.10%(+0.024)#228 | 0.071%(+0.057)#472 |
| 68. | Glendora | 0.13% | 0.10%(+0.023)#229 | 0.071%(+0.056)#473 |
| 69. | Saratoga | 0.12% | 0.10%(+0.019)#230 | 0.071%(+0.053)#474 |
| 70. | La Mirada | 0.12% | 0.10%(+0.011)#231 | 0.071%(+0.045)#475 |
| 71. | Altadena | 0.11% | 0.10%(+0.011)#232 | 0.071%(+0.044)#476 |
| 72. | Watsonville | 0.11% | 0.10%(+0.007)#233 | 0.071%(+0.040)#477 |
| 73. | San Diego | 0.11% | 0.10%(+0.006)#234 | 0.071%(+0.039)#478 |
| 74. | Ceres | 0.11% | 0.10%(+0.006)#235 | 0.071%(+0.039)#479 |
| 75. | Tustin | 0.11% | 0.10%(+0.004)#236 | 0.071%(+0.037)#480 |
| 76. | Moreno Valley | 0.11% | 0.10%(+0.003)#237 | 0.071%(+0.037)#481 |
| 77. | Escondido | 0.10% | 0.10%(-0.000)#238 | 0.071%(+0.033)#482 |
| 78. | National City | 0.10% | 0.10%(-0.001)#239 | 0.071%(+0.032)#483 |
| 79. | Rancho Cucamonga | 0.10% | 0.10%(-0.002)#240 | 0.071%(+0.031)#484 |
| 80. | Westlake Village | 0.10% | 0.10%(-0.003)#241 | 0.071%(+0.030)#485 |
| 81. | Menlo Park | 0.099% | 0.10%(-0.005)#242 | 0.071%(+0.028)#486 |
| 82. | Azusa | 0.099% | 0.10%(-0.005)#243 | 0.071%(+0.028)#487 |
| 83. | Imperial Beach | 0.096% | 0.10%(-0.008)#244 | 0.071%(+0.025)#488 |
| 84. | Murrieta | 0.095% | 0.10%(-0.009)#245 | 0.071%(+0.024)#489 |
| 85. | Fair Oaks | 0.095% | 0.10%(-0.009)#246 | 0.071%(+0.024)#490 |
| 86. | Palmdale | 0.092% | 0.10%(-0.012)#247 | 0.071%(+0.022)#491 |
| 87. | Garden Grove | 0.092% | 0.10%(-0.012)#248 | 0.071%(+0.021)#492 |
| 88. | Belmont | 0.090% | 0.10%(-0.014)#249 | 0.071%(+0.019)#493 |
| 89. | Bonadelle Ranchos | 0.089% | 0.10%(-0.015)#250 | 0.071%(+0.018)#494 |
| 90. | Campbell | 0.087% | 0.10%(-0.017)#251 | 0.071%(+0.017)#495 |
| 91. | San Ramon | 0.086% | 0.10%(-0.018)#252 | 0.071%(+0.015)#496 |
| 92. | Solana Beach | 0.085% | 0.10%(-0.019)#253 | 0.071%(+0.014)#497 |
| 93. | Coronado | 0.085% | 0.10%(-0.019)#254 | 0.071%(+0.014)#498 |
| 94. | Santa Cruz | 0.085% | 0.10%(-0.019)#255 | 0.071%(+0.014)#499 |
| 95. | Laguna Hills | 0.083% | 0.10%(-0.021)#256 | 0.071%(+0.013)#500 |
| 96. | Sunnyvale | 0.082% | 0.10%(-0.022)#257 | 0.071%(+0.011)#501 |
| 97. | Anaheim | 0.079% | 0.10%(-0.025)#258 | 0.071%(+0.009)#502 |
| 98. | Alpine | 0.075% | 0.10%(-0.029)#259 | 0.071%(+0.005)#503 |
| 99. | Rocklin | 0.074% | 0.10%(-0.030)#260 | 0.071%(+0.003)#504 |
| 100. | Duarte | 0.074% | 0.10%(-0.030)#261 | 0.071%(+0.003)#505 |
Common Questions
What are the Top 10 Cities with the Highest Percentage of Immigrants from Iraq in California?
Top 10 Cities with the Highest Percentage of Immigrants from Iraq in California are:
#1
12.19%
#2
10.17%
#3
7.14%
#4
4.60%
#5
4.30%
#6
2.49%
#7
2.16%
#8
1.92%
#9
1.78%
#10
1.49%
What city has the Highest Percentage of Immigrants from Iraq in California?
El Cajon has the Highest Percentage of Immigrants from Iraq in California with 12.19%.
What is the Percentage of Immigrants from Iraq in the State of California?
Percentage of Immigrants from Iraq in California is 0.10%.
What is the Percentage of Immigrants from Iraq in the United States?
Percentage of Immigrants from Iraq in the United States is 0.071%.