Cities with the Highest Percentage of Population Walking to Work in California
RELATED REPORTS & OPTIONS
Walk to Work
California
Compare Cities
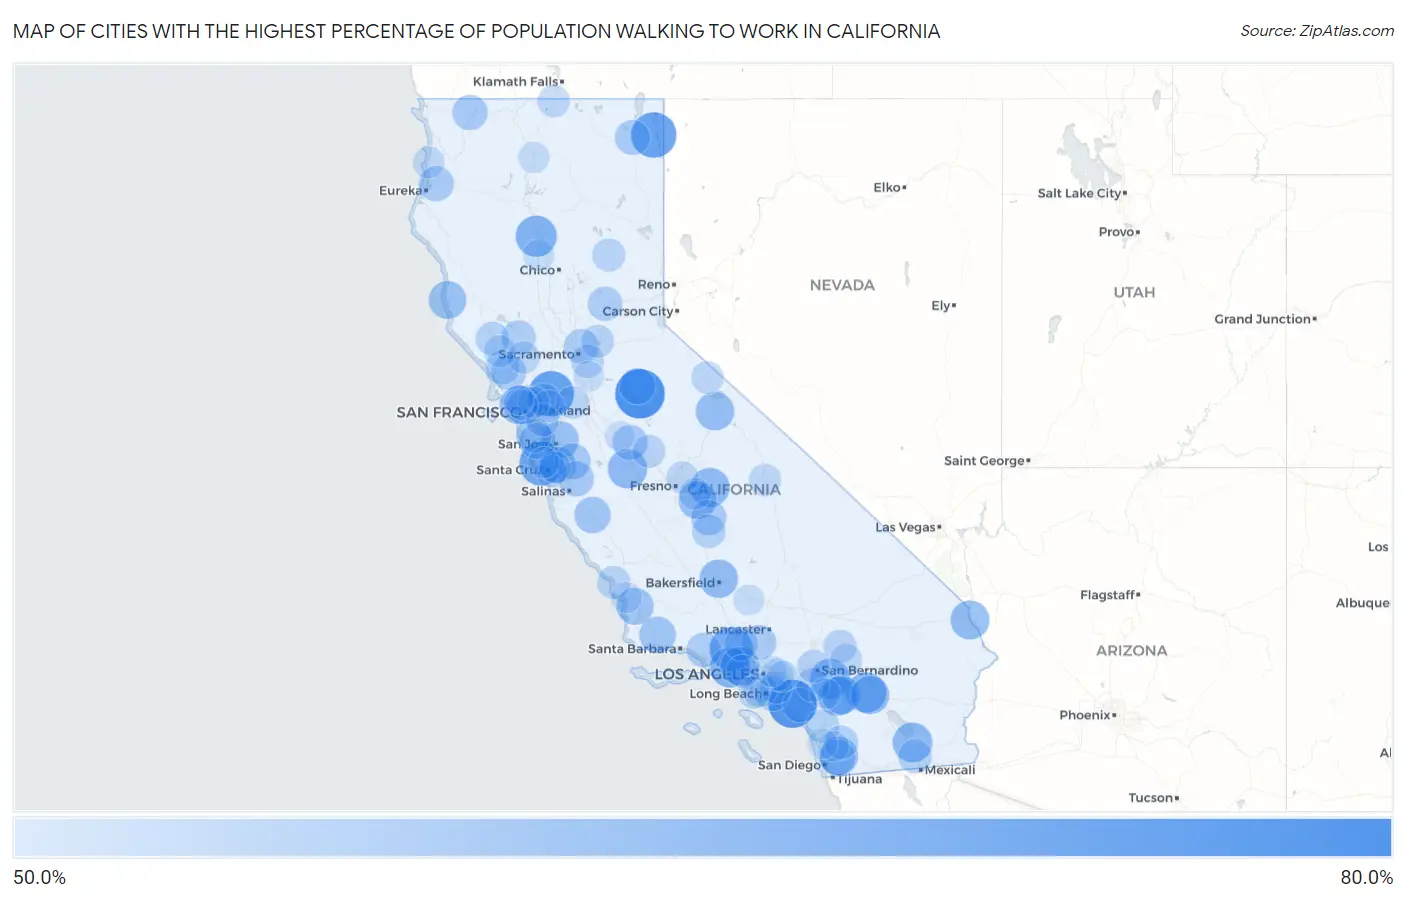
Map of Cities with the Highest Percentage of Population Walking to Work in California
0.0%
80.0%
Cities with the Highest Percentage of Population Walking to Work in California
| City | % Walk to Work | vs State | vs National | |
| 1. | Columbia | 79.2% | 34.4%(+44.8)#1 | 33.4%(+45.8)#10 |
| 2. | Laguna Woods | 77.3% | 34.4%(+42.9)#2 | 33.4%(+43.9)#21 |
| 3. | Bay Point | 73.4% | 34.4%(+39.0)#3 | 33.4%(+40.0)#56 |
| 4. | Cedarville | 73.3% | 34.4%(+38.9)#4 | 33.4%(+39.9)#58 |
| 5. | Bonny Doon | 71.3% | 34.4%(+36.9)#5 | 33.4%(+37.9)#88 |
| 6. | Piru | 70.5% | 34.4%(+36.1)#6 | 33.4%(+37.1)#101 |
| 7. | Red Bluff | 67.4% | 34.4%(+33.0)#7 | 33.4%(+34.0)#207 |
| 8. | Rancho Mirage | 66.1% | 34.4%(+31.7)#8 | 33.4%(+32.7)#281 |
| 9. | Westlake Village | 66.1% | 34.4%(+31.7)#9 | 33.4%(+32.7)#284 |
| 10. | Calimesa | 65.8% | 34.4%(+31.4)#10 | 33.4%(+32.4)#295 |
| 11. | Westmorland | 65.5% | 34.4%(+31.1)#11 | 33.4%(+32.1)#310 |
| 12. | Dos Palos | 65.1% | 34.4%(+30.7)#12 | 33.4%(+31.7)#345 |
| 13. | Squaw Valley | 64.7% | 34.4%(+30.3)#13 | 33.4%(+31.3)#364 |
| 14. | Hidden Hills | 64.5% | 34.4%(+30.1)#14 | 33.4%(+31.1)#375 |
| 15. | Needles | 64.3% | 34.4%(+29.9)#15 | 33.4%(+30.9)#393 |
| 16. | East Hemet | 64.2% | 34.4%(+29.8)#16 | 33.4%(+30.8)#404 |
| 17. | Valle Vista | 64.2% | 34.4%(+29.8)#17 | 33.4%(+30.8)#405 |
| 18. | Winter Gardens | 64.0% | 34.4%(+29.6)#18 | 33.4%(+30.6)#415 |
| 19. | Oildale | 63.8% | 34.4%(+29.4)#19 | 33.4%(+30.4)#425 |
| 20. | Palm Desert | 63.7% | 34.4%(+29.3)#20 | 33.4%(+30.3)#433 |
| 21. | June Lake | 63.7% | 34.4%(+29.3)#21 | 33.4%(+30.3)#436 |
| 22. | Tiburon | 63.6% | 34.4%(+29.2)#22 | 33.4%(+30.2)#438 |
| 23. | Tamalpais Homestead Valley | 63.4% | 34.4%(+29.0)#23 | 33.4%(+30.0)#463 |
| 24. | Dinuba | 63.0% | 34.4%(+28.6)#24 | 33.4%(+29.6)#506 |
| 25. | Mendocino | 62.7% | 34.4%(+28.3)#25 | 33.4%(+29.3)#530 |
| 26. | East Foothills | 62.5% | 34.4%(+28.1)#26 | 33.4%(+29.1)#539 |
| 27. | Nipomo | 61.8% | 34.4%(+27.4)#27 | 33.4%(+28.4)#620 |
| 28. | Santa Ynez | 61.3% | 34.4%(+26.9)#28 | 33.4%(+27.9)#684 |
| 29. | Greenfield | 60.8% | 34.4%(+26.4)#29 | 33.4%(+27.4)#738 |
| 30. | Day Valley | 60.8% | 34.4%(+26.4)#30 | 33.4%(+27.4)#741 |
| 31. | Murphys | 60.5% | 34.4%(+26.1)#31 | 33.4%(+27.1)#776 |
| 32. | Portola Valley | 60.4% | 34.4%(+26.0)#32 | 33.4%(+27.0)#805 |
| 33. | San Martin | 60.3% | 34.4%(+25.9)#33 | 33.4%(+26.9)#820 |
| 34. | Bostonia | 60.0% | 34.4%(+25.6)#34 | 33.4%(+26.6)#869 |
| 35. | San Juan Bautista | 59.5% | 34.4%(+25.1)#35 | 33.4%(+26.1)#916 |
| 36. | Atwater | 59.4% | 34.4%(+25.0)#36 | 33.4%(+26.0)#932 |
| 37. | Farmersville | 59.4% | 34.4%(+25.0)#37 | 33.4%(+26.0)#936 |
| 38. | Happy Camp | 59.4% | 34.4%(+25.0)#38 | 33.4%(+26.0)#945 |
| 39. | Emerald Lake Hills | 59.3% | 34.4%(+24.9)#39 | 33.4%(+25.9)#949 |
| 40. | Alturas | 59.2% | 34.4%(+24.8)#40 | 33.4%(+25.8)#976 |
| 41. | Agua Dulce | 59.1% | 34.4%(+24.7)#41 | 33.4%(+25.7)#997 |
| 42. | Blue Lake | 59.1% | 34.4%(+24.7)#42 | 33.4%(+25.7)#1,007 |
| 43. | Eastern Goleta Valley | 59.0% | 34.4%(+24.6)#43 | 33.4%(+25.6)#1,012 |
| 44. | Cotati | 58.9% | 34.4%(+24.5)#44 | 33.4%(+25.5)#1,021 |
| 45. | Rio Linda | 58.5% | 34.4%(+24.1)#45 | 33.4%(+25.1)#1,063 |
| 46. | Oak View | 58.5% | 34.4%(+24.1)#46 | 33.4%(+25.1)#1,068 |
| 47. | Seal Beach | 58.4% | 34.4%(+24.0)#47 | 33.4%(+25.0)#1,096 |
| 48. | Coto De Caza | 58.4% | 34.4%(+24.0)#48 | 33.4%(+25.0)#1,097 |
| 49. | Nevada City | 58.3% | 34.4%(+23.9)#49 | 33.4%(+24.9)#1,120 |
| 50. | Hidden Valley Lake | 58.1% | 34.4%(+23.7)#50 | 33.4%(+24.7)#1,149 |
| 51. | West Carson | 57.7% | 34.4%(+23.3)#51 | 33.4%(+24.3)#1,189 |
| 52. | Sebastopol | 57.6% | 34.4%(+23.2)#52 | 33.4%(+24.2)#1,202 |
| 53. | Castaic | 57.5% | 34.4%(+23.1)#53 | 33.4%(+24.1)#1,218 |
| 54. | Cloverdale | 57.5% | 34.4%(+23.1)#54 | 33.4%(+24.1)#1,221 |
| 55. | Bonsall | 57.4% | 34.4%(+23.0)#55 | 33.4%(+24.0)#1,246 |
| 56. | Ramona | 57.3% | 34.4%(+22.9)#56 | 33.4%(+23.9)#1,257 |
| 57. | Imperial | 57.2% | 34.4%(+22.8)#57 | 33.4%(+23.8)#1,282 |
| 58. | Woodville | 57.1% | 34.4%(+22.7)#58 | 33.4%(+23.7)#1,311 |
| 59. | Woodcrest | 56.9% | 34.4%(+22.5)#59 | 33.4%(+23.5)#1,327 |
| 60. | Reliez Valley | 56.7% | 34.4%(+22.3)#60 | 33.4%(+23.3)#1,352 |
| 61. | Morro Bay | 56.6% | 34.4%(+22.2)#61 | 33.4%(+23.2)#1,365 |
| 62. | Vineyard | 56.5% | 34.4%(+22.1)#62 | 33.4%(+23.1)#1,377 |
| 63. | Lucerne Valley | 56.5% | 34.4%(+22.1)#63 | 33.4%(+23.1)#1,385 |
| 64. | Quincy | 56.4% | 34.4%(+22.0)#64 | 33.4%(+23.0)#1,432 |
| 65. | San Lorenzo | 56.3% | 34.4%(+21.9)#65 | 33.4%(+22.9)#1,440 |
| 66. | Granite Bay | 56.3% | 34.4%(+21.9)#66 | 33.4%(+22.9)#1,443 |
| 67. | Le Grand | 56.3% | 34.4%(+21.9)#67 | 33.4%(+22.9)#1,449 |
| 68. | Muscoy | 56.2% | 34.4%(+21.8)#68 | 33.4%(+22.8)#1,466 |
| 69. | Topanga | 56.0% | 34.4%(+21.6)#69 | 33.4%(+22.6)#1,493 |
| 70. | Buena Park | 55.7% | 34.4%(+21.3)#70 | 33.4%(+22.3)#1,522 |
| 71. | Discovery Bay | 55.5% | 34.4%(+21.1)#71 | 33.4%(+22.1)#1,551 |
| 72. | Dorris | 55.5% | 34.4%(+21.1)#72 | 33.4%(+22.1)#1,567 |
| 73. | Avocado Heights | 55.4% | 34.4%(+21.0)#73 | 33.4%(+22.0)#1,588 |
| 74. | Bridgeport | 55.4% | 34.4%(+21.0)#74 | 33.4%(+22.0)#1,606 |
| 75. | Palos Verdes Estates | 55.3% | 34.4%(+20.9)#75 | 33.4%(+21.9)#1,610 |
| 76. | Independence | 55.3% | 34.4%(+20.9)#76 | 33.4%(+21.9)#1,628 |
| 77. | Big Bear City | 55.2% | 34.4%(+20.8)#77 | 33.4%(+21.8)#1,641 |
| 78. | Clovis | 55.1% | 34.4%(+20.7)#78 | 33.4%(+21.7)#1,656 |
| 79. | St Helena | 55.1% | 34.4%(+20.7)#79 | 33.4%(+21.7)#1,662 |
| 80. | Healdsburg | 55.0% | 34.4%(+20.6)#80 | 33.4%(+21.6)#1,675 |
| 81. | Reedley | 54.9% | 34.4%(+20.5)#81 | 33.4%(+21.5)#1,690 |
| 82. | Alamo | 54.9% | 34.4%(+20.5)#82 | 33.4%(+21.5)#1,692 |
| 83. | Pleasure Point | 54.8% | 34.4%(+20.4)#83 | 33.4%(+21.4)#1,703 |
| 84. | Aptos | 54.6% | 34.4%(+20.2)#84 | 33.4%(+21.2)#1,725 |
| 85. | Big Lagoon | 54.5% | 34.4%(+20.1)#85 | 33.4%(+21.1)#1,767 |
| 86. | Kensington | 54.3% | 34.4%(+19.9)#86 | 33.4%(+20.9)#1,787 |
| 87. | Dunsmuir | 54.1% | 34.4%(+19.7)#87 | 33.4%(+20.7)#1,838 |
| 88. | San Gabriel | 53.9% | 34.4%(+19.5)#88 | 33.4%(+20.5)#1,853 |
| 89. | Corning | 53.8% | 34.4%(+19.4)#89 | 33.4%(+20.4)#1,863 |
| 90. | Ben Lomond | 53.8% | 34.4%(+19.4)#90 | 33.4%(+20.4)#1,864 |
| 91. | South San Jose Hills | 53.6% | 34.4%(+19.2)#91 | 33.4%(+20.2)#1,901 |
| 92. | Pismo Beach | 53.5% | 34.4%(+19.1)#92 | 33.4%(+20.1)#1,916 |
| 93. | Belvedere | 53.5% | 34.4%(+19.1)#93 | 33.4%(+20.1)#1,922 |
| 94. | Romoland | 53.4% | 34.4%(+19.0)#94 | 33.4%(+20.0)#1,956 |
| 95. | Tehachapi | 53.3% | 34.4%(+18.9)#95 | 33.4%(+19.9)#1,968 |
| 96. | Poway | 53.1% | 34.4%(+18.7)#96 | 33.4%(+19.7)#2,004 |
| 97. | Galt | 53.1% | 34.4%(+18.7)#97 | 33.4%(+19.7)#2,007 |
| 98. | Delhi | 52.7% | 34.4%(+18.3)#98 | 33.4%(+19.3)#2,078 |
| 99. | Rancho Santa Fe | 52.5% | 34.4%(+18.1)#99 | 33.4%(+19.1)#2,113 |
| 100. | Kentfield | 52.4% | 34.4%(+18.0)#100 | 33.4%(+19.0)#2,148 |
Common Questions
What are the Top 10 Cities with the Highest Percentage of Population Walking to Work in California?
Top 10 Cities with the Highest Percentage of Population Walking to Work in California are:
#1
79.2%
#2
77.3%
#3
73.4%
#4
73.3%
#5
71.3%
#6
70.5%
#7
67.4%
#8
66.1%
#9
66.1%
#10
65.8%
What city has the Highest Percentage of Population Walking to Work in California?
Columbia has the Highest Percentage of Population Walking to Work in California with 79.2%.
What is the Percentage of Population Walking to Work in the State of California?
Percentage of Population Walking to Work in California is 34.4%.
What is the Percentage of Population Walking to Work in the United States?
Percentage of Population Walking to Work in the United States is 33.4%.