Lookout, CA Map & Demographics
Lookout Map
Lookout Overview
$22,173
PER CAPITA INCOME
0.28
INEQUALITY / GINI INDEX
37
TOTAL POPULATION
18
MALE POPULATION
19
FEMALE POPULATION
94.74
MALES / 100 FEMALES
105.56
FEMALES / 100 MALES
49.1
MEDIAN AGE
7.3
AVG FAMILY SIZE
2.3
AVG HOUSEHOLD SIZE
9
LABOR FORCE [ PEOPLE ]
37.5%
PERCENT IN LABOR FORCE
Lookout Zip Codes
Lookout Area Codes
Income in Lookout
Income Overview in Lookout
| Characteristic | Number | Measure |
| Per Capita Income | 37 | $22,173 |
| Median Family Income | 3 | $0 |
| Mean Family Income | 3 | $0 |
| Median Household Income | 16 | $0 |
| Mean Household Income | 16 | $43,619 |
| Income Deficit | 3 | $0 |
| Wage / Income Gap (%) | 37 | 0.00% |
| Wage / Income Gap ($) | 37 | 100.00¢ per $1 |
| Gini / Inequality Index | 37 | 0.28 |
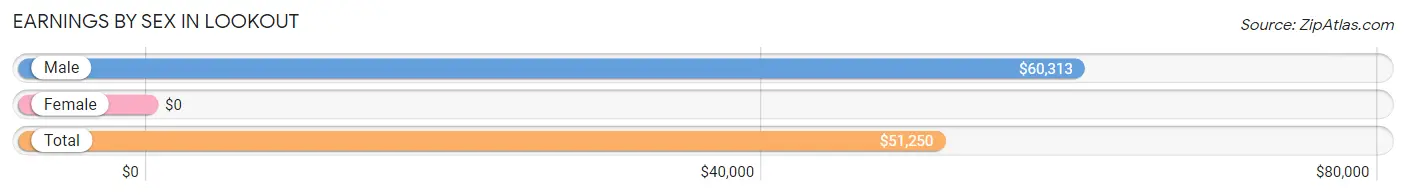
Earnings by Sex in Lookout
| Sex | Number | Average Earnings |
| Male | 7 (77.8%) | $60,313 |
| Female | 2 (22.2%) | $0 |
| Total | 9 (100.0%) | $51,250 |
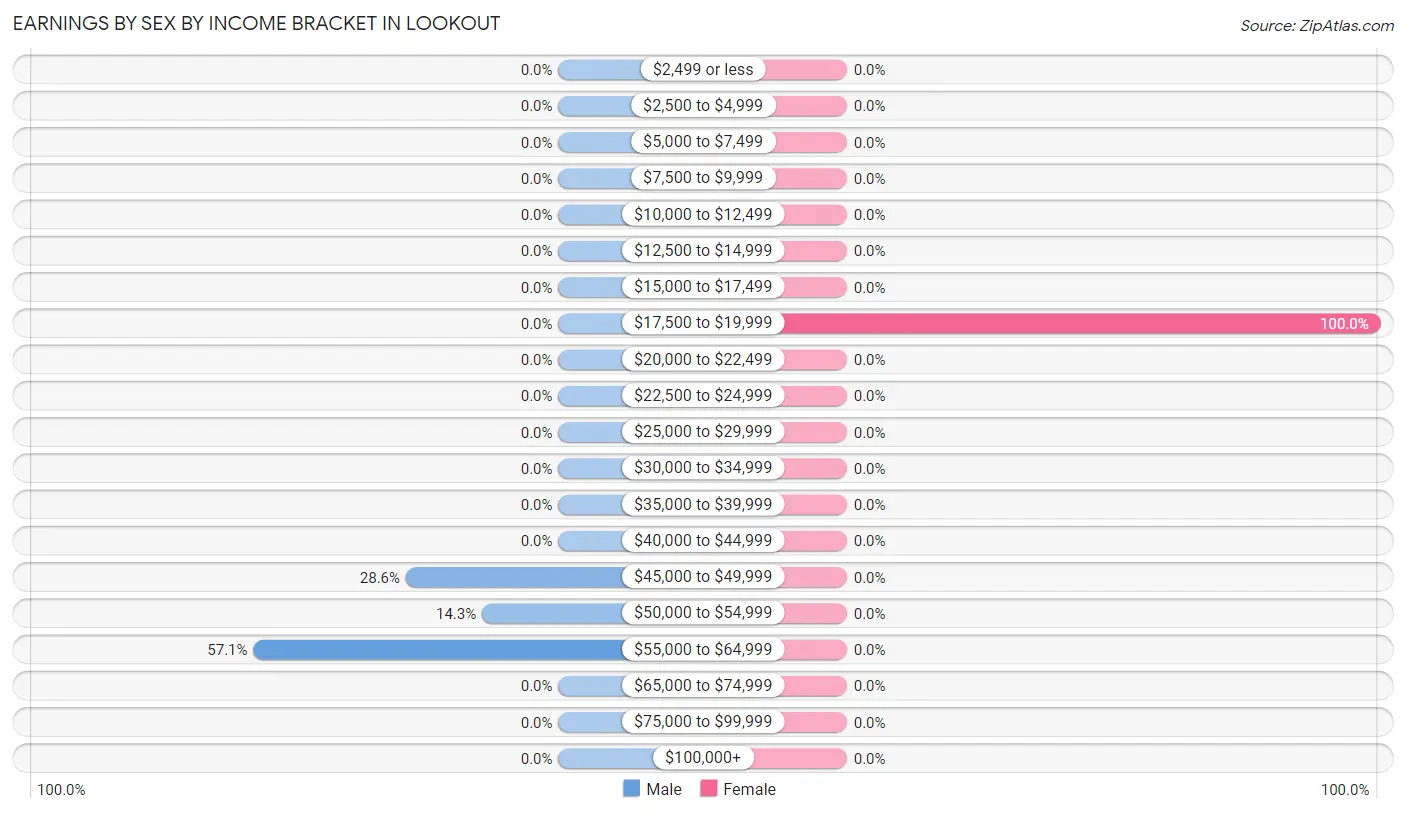
Earnings by Sex by Income Bracket in Lookout
The most common earnings brackets in Lookout are $55,000 to $64,999 for men (4 | 57.1%) and $17,500 to $19,999 for women (2 | 100.0%).
| Income | Male | Female |
| $2,499 or less | 0 (0.0%) | 0 (0.0%) |
| $2,500 to $4,999 | 0 (0.0%) | 0 (0.0%) |
| $5,000 to $7,499 | 0 (0.0%) | 0 (0.0%) |
| $7,500 to $9,999 | 0 (0.0%) | 0 (0.0%) |
| $10,000 to $12,499 | 0 (0.0%) | 0 (0.0%) |
| $12,500 to $14,999 | 0 (0.0%) | 0 (0.0%) |
| $15,000 to $17,499 | 0 (0.0%) | 0 (0.0%) |
| $17,500 to $19,999 | 0 (0.0%) | 2 (100.0%) |
| $20,000 to $22,499 | 0 (0.0%) | 0 (0.0%) |
| $22,500 to $24,999 | 0 (0.0%) | 0 (0.0%) |
| $25,000 to $29,999 | 0 (0.0%) | 0 (0.0%) |
| $30,000 to $34,999 | 0 (0.0%) | 0 (0.0%) |
| $35,000 to $39,999 | 0 (0.0%) | 0 (0.0%) |
| $40,000 to $44,999 | 0 (0.0%) | 0 (0.0%) |
| $45,000 to $49,999 | 2 (28.6%) | 0 (0.0%) |
| $50,000 to $54,999 | 1 (14.3%) | 0 (0.0%) |
| $55,000 to $64,999 | 4 (57.1%) | 0 (0.0%) |
| $65,000 to $74,999 | 0 (0.0%) | 0 (0.0%) |
| $75,000 to $99,999 | 0 (0.0%) | 0 (0.0%) |
| $100,000+ | 0 (0.0%) | 0 (0.0%) |
| Total | 7 (100.0%) | 2 (100.0%) |
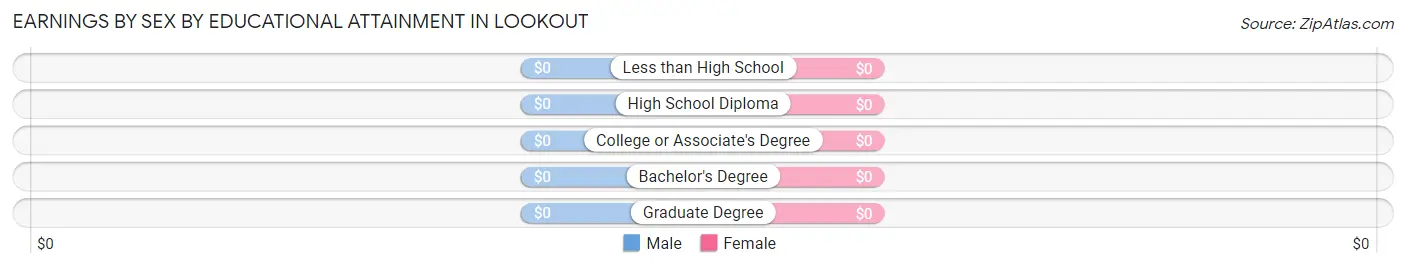
Earnings by Sex by Educational Attainment in Lookout
| Educational Attainment | Male Income | Female Income |
| Less than High School | - | - |
| High School Diploma | - | - |
| College or Associate's Degree | - | - |
| Bachelor's Degree | - | - |
| Graduate Degree | - | - |
| Total | $60,313 | $0 |
Family Income in Lookout
Family Income Brackets in Lookout
According to the Lookout family income data, there are 3 families falling into the $50,000 to $74,999 income range, which is the most common income bracket and makes up 100.0% of all families.
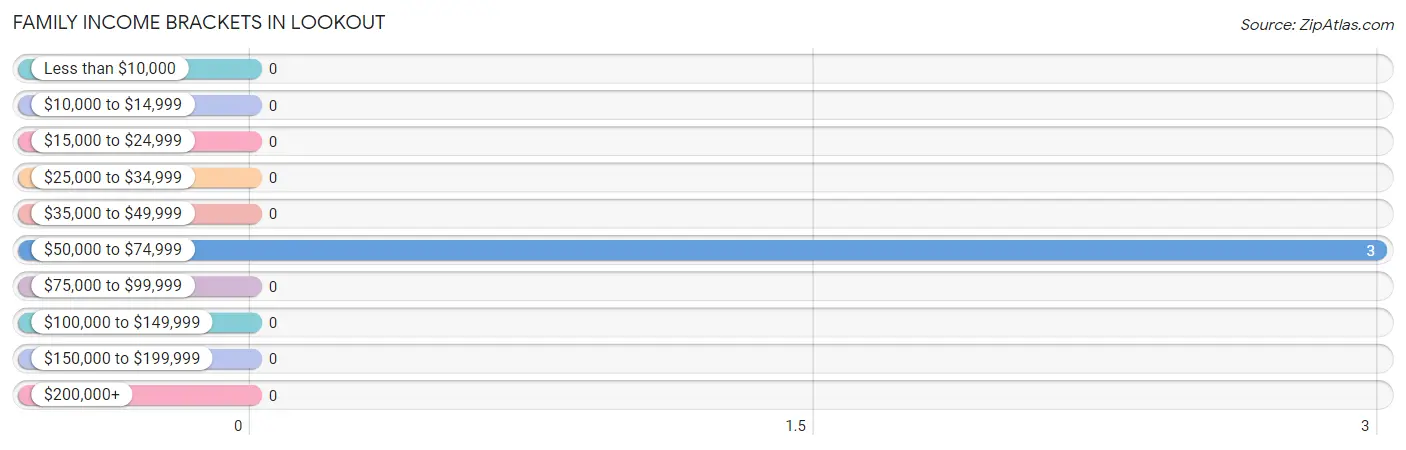
| Income Bracket | # Families | % Families |
| Less than $10,000 | 0 | 0.0% |
| $10,000 to $14,999 | 0 | 0.0% |
| $15,000 to $24,999 | 0 | 0.0% |
| $25,000 to $34,999 | 0 | 0.0% |
| $35,000 to $49,999 | 0 | 0.0% |
| $50,000 to $74,999 | 3 | 100.0% |
| $75,000 to $99,999 | 0 | 0.0% |
| $100,000 to $149,999 | 0 | 0.0% |
| $150,000 to $199,999 | 0 | 0.0% |
| $200,000+ | 0 | 0.0% |
Family Income by Famaliy Size in Lookout
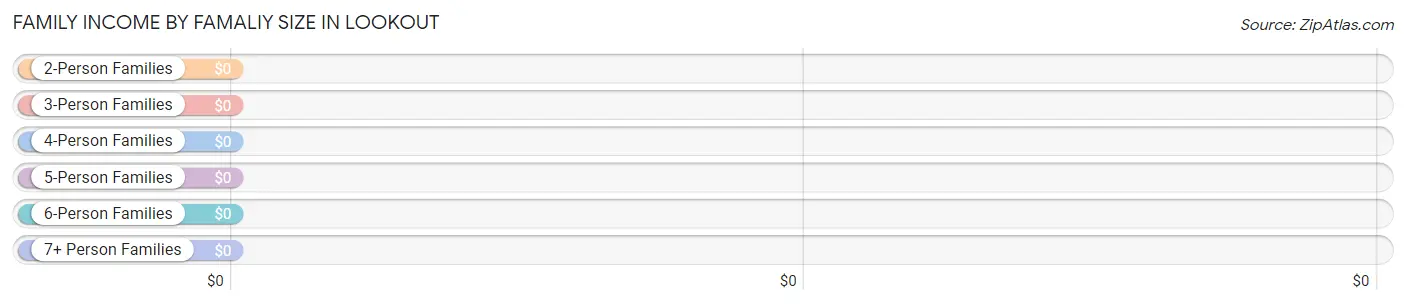
| Income Bracket | # Families | Median Income |
| 2-Person Families | 2 (66.7%) | $0 |
| 3-Person Families | 0 (0.0%) | $0 |
| 4-Person Families | 0 (0.0%) | $0 |
| 5-Person Families | 0 (0.0%) | $0 |
| 6-Person Families | 1 (33.3%) | $0 |
| 7+ Person Families | 0 (0.0%) | $0 |
| Total | 3 (100.0%) | $0 |
Family Income by Number of Earners in Lookout
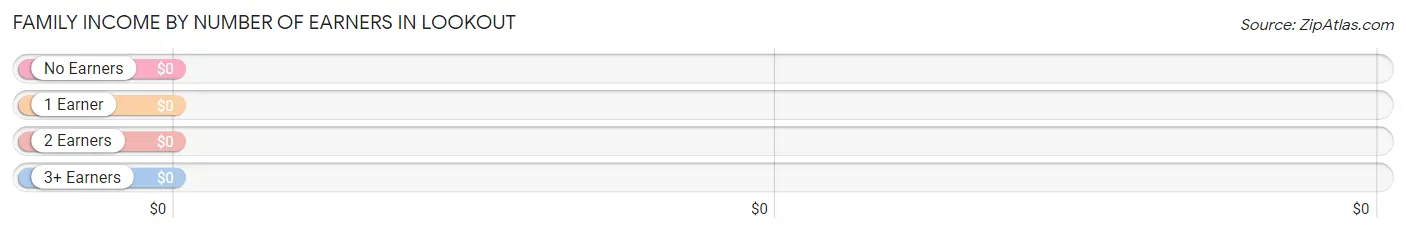
| Number of Earners | # Families | Median Income |
| No Earners | 2 (66.7%) | $0 |
| 1 Earner | 0 (0.0%) | $0 |
| 2 Earners | 1 (33.3%) | $0 |
| 3+ Earners | 0 (0.0%) | $0 |
| Total | 3 (100.0%) | $0 |
Household Income in Lookout
Household Income Brackets in Lookout
With 9 households falling in the category, the $15,000 to $24,999 income range is the most frequent in Lookout, accounting for 56.2% of all households.
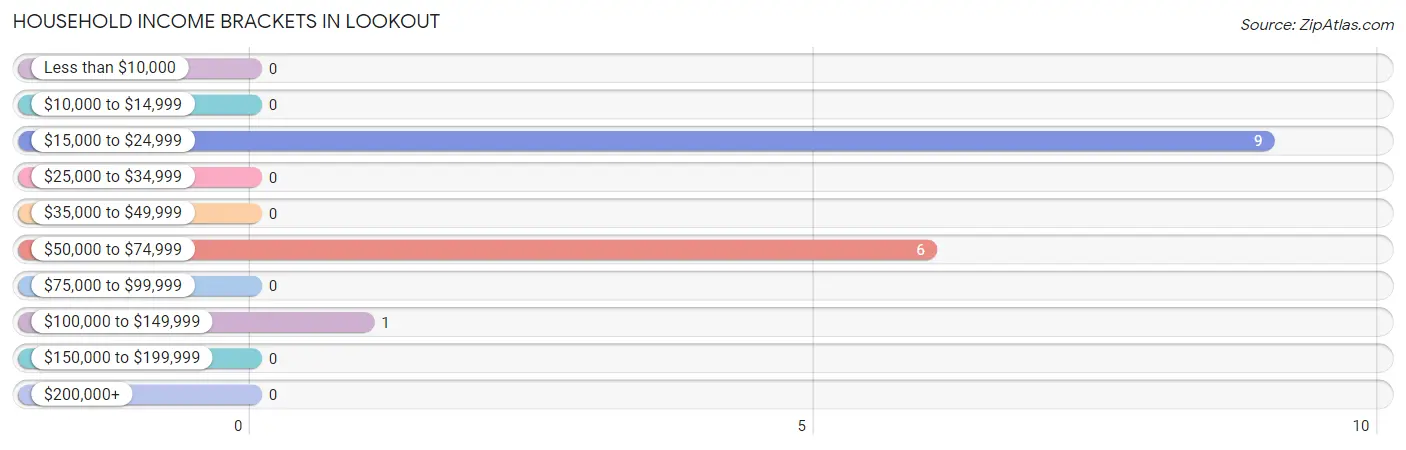
| Income Bracket | # Households | % Households |
| Less than $10,000 | 0 | 0.0% |
| $10,000 to $14,999 | 0 | 0.0% |
| $15,000 to $24,999 | 9 | 56.3% |
| $25,000 to $34,999 | 0 | 0.0% |
| $35,000 to $49,999 | 0 | 0.0% |
| $50,000 to $74,999 | 6 | 37.5% |
| $75,000 to $99,999 | 0 | 0.0% |
| $100,000 to $149,999 | 1 | 6.3% |
| $150,000 to $199,999 | 0 | 0.0% |
| $200,000+ | 0 | 0.0% |
Household Income by Householder Age in Lookout
| Income Bracket | # Households | Median Income |
| 15 to 24 Years | 0 (0.0%) | $0 |
| 25 to 44 Years | 1 (6.2%) | $0 |
| 45 to 64 Years | 13 (81.2%) | $0 |
| 65+ Years | 2 (12.5%) | $0 |
| Total | 16 (100.0%) | $0 |
Poverty in Lookout
Income Below Poverty by Sex and Age in Lookout
| Age Bracket | Male | Female |
| Under 5 Years | 0 (0.0%) | 0 (0.0%) |
| 5 Years | 0 (0.0%) | 0 (0.0%) |
| 6 to 11 Years | 0 (0.0%) | 0 (0.0%) |
| 12 to 14 Years | 0 (0.0%) | 0 (0.0%) |
| 15 Years | 0 (0.0%) | 0 (0.0%) |
| 16 and 17 Years | 0 (0.0%) | 0 (0.0%) |
| 18 to 24 Years | 0 (0.0%) | 0 (0.0%) |
| 25 to 34 Years | 0 (0.0%) | 0 (0.0%) |
| 35 to 44 Years | 0 (0.0%) | 0 (0.0%) |
| 45 to 54 Years | 0 (0.0%) | 0 (0.0%) |
| 55 to 64 Years | 0 (0.0%) | 0 (0.0%) |
| 65 to 74 Years | 0 (0.0%) | 0 (0.0%) |
| 75 Years and over | 0 (0.0%) | 0 (0.0%) |
| Total | 0 (0.0%) | 0 (0.0%) |
Income Above Poverty by Sex and Age in Lookout
According to the poverty statistics in Lookout, males aged under 5 years and females aged under 5 years are the age groups that are most secure financially, with 100.0% of males and 100.0% of females in these age groups living above the poverty line.
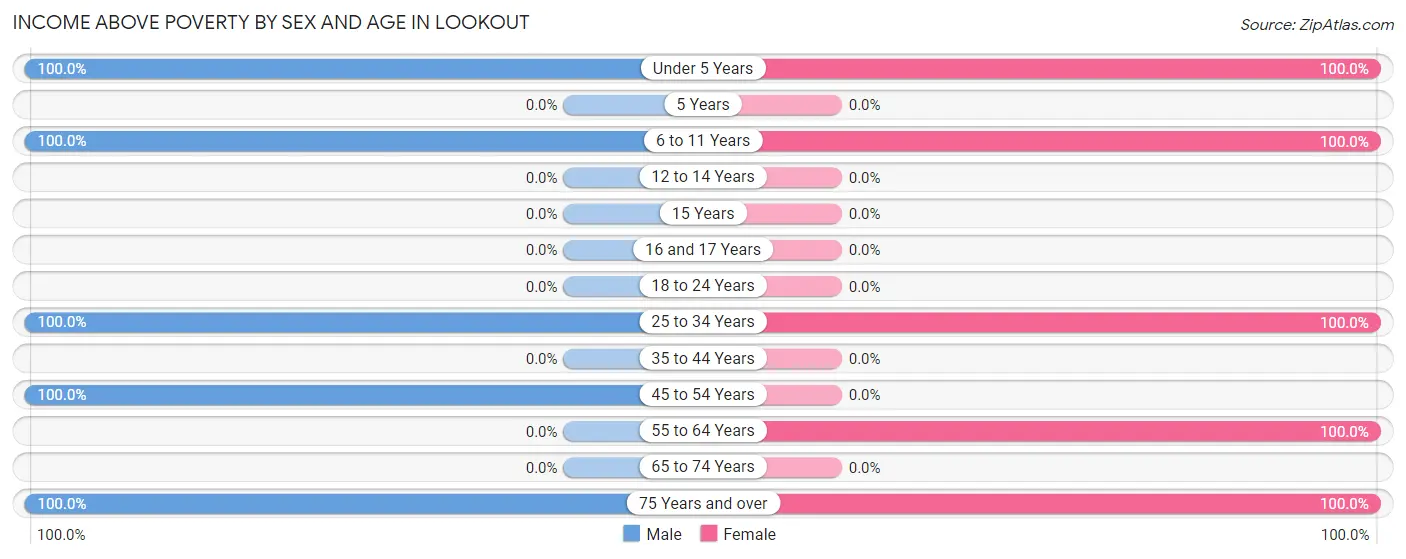
| Age Bracket | Male | Female |
| Under 5 Years | 2 (100.0%) | 2 (100.0%) |
| 5 Years | 0 (0.0%) | 0 (0.0%) |
| 6 to 11 Years | 5 (100.0%) | 4 (100.0%) |
| 12 to 14 Years | 0 (0.0%) | 0 (0.0%) |
| 15 Years | 0 (0.0%) | 0 (0.0%) |
| 16 and 17 Years | 0 (0.0%) | 0 (0.0%) |
| 18 to 24 Years | 0 (0.0%) | 0 (0.0%) |
| 25 to 34 Years | 3 (100.0%) | 2 (100.0%) |
| 35 to 44 Years | 0 (0.0%) | 0 (0.0%) |
| 45 to 54 Years | 4 (100.0%) | 0 (0.0%) |
| 55 to 64 Years | 0 (0.0%) | 9 (100.0%) |
| 65 to 74 Years | 0 (0.0%) | 0 (0.0%) |
| 75 Years and over | 4 (100.0%) | 2 (100.0%) |
| Total | 18 (100.0%) | 19 (100.0%) |
Income Below Poverty Among Married-Couple Families in Lookout
| Children | Above Poverty | Below Poverty |
| No Children | 2 (100.0%) | 0 (0.0%) |
| 1 or 2 Children | 0 (0.0%) | 0 (0.0%) |
| 3 or 4 Children | 1 (100.0%) | 0 (0.0%) |
| 5 or more Children | 0 (0.0%) | 0 (0.0%) |
| Total | 3 (100.0%) | 0 (0.0%) |
Income Below Poverty Among Single-Parent Households in Lookout
| Children | Single Father | Single Mother |
| No Children | 0 (0.0%) | 0 (0.0%) |
| 1 or 2 Children | 0 (0.0%) | 0 (0.0%) |
| 3 or 4 Children | 0 (0.0%) | 0 (0.0%) |
| 5 or more Children | 0 (0.0%) | 0 (0.0%) |
| Total | 0 (0.0%) | 0 (0.0%) |
Income Below Poverty Among Married-Couple vs Single-Parent Households in Lookout
| Children | Married-Couple Families | Single-Parent Households |
| No Children | 0 (0.0%) | 0 (0.0%) |
| 1 or 2 Children | 0 (0.0%) | 0 (0.0%) |
| 3 or 4 Children | 0 (0.0%) | 0 (0.0%) |
| 5 or more Children | 0 (0.0%) | 0 (0.0%) |
| Total | 0 (0.0%) | 0 (0.0%) |
Race in Lookout
The most populous races in Lookout are , and White / Caucasian (37 | 100.0%).
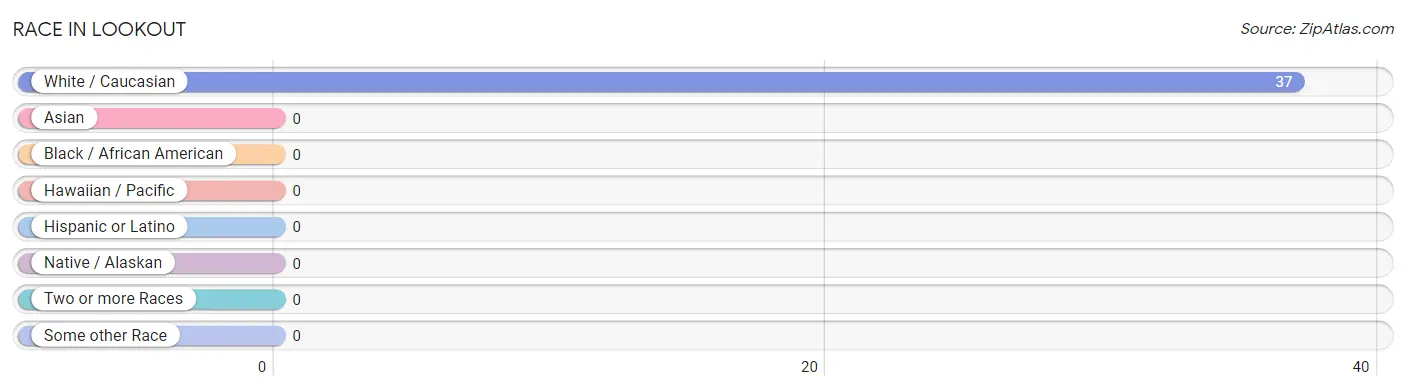
| Race | # Population | % Population |
| Asian | 0 | 0.0% |
| Black / African American | 0 | 0.0% |
| Hawaiian / Pacific | 0 | 0.0% |
| Hispanic or Latino | 0 | 0.0% |
| Native / Alaskan | 0 | 0.0% |
| White / Caucasian | 37 | 100.0% |
| Two or more Races | 0 | 0.0% |
| Some other Race | 0 | 0.0% |
| Total | 37 | 100.0% |
Ancestry in Lookout
The most populous ancestries reported in Lookout are , and Irish (4 | 10.8%), together accounting for 10.8% of all Lookout residents.

| Ancestry | # Population | % Population |
| Irish | 4 | 10.8% | View All 1 Rows |
Immigrants in Lookout

| Immigration Origin | # Population | % Population | View All 0 Rows |
Sex and Age in Lookout
Sex and Age in Lookout
The most populous age groups in Lookout are 5 to 9 Years (5 | 27.8%) for men and 55 to 59 Years (9 | 47.4%) for women.
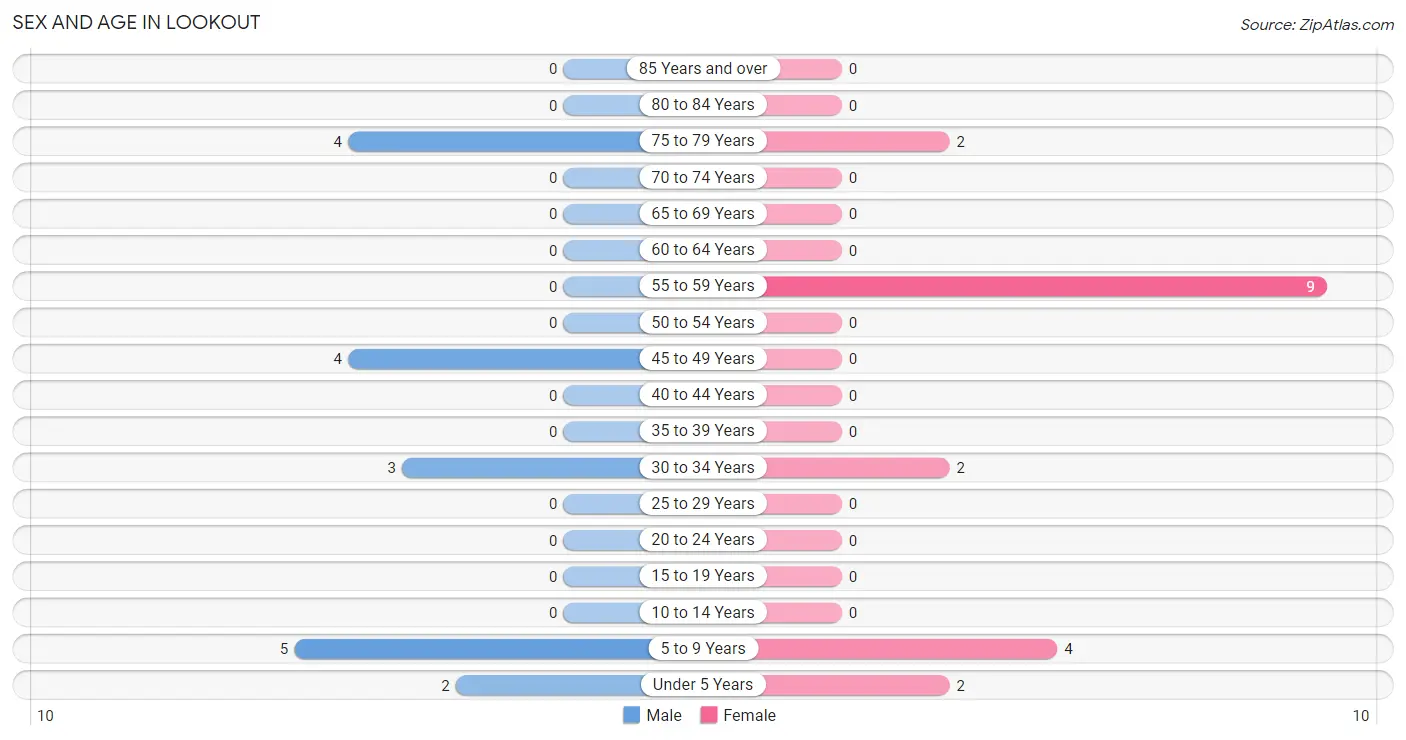
| Age Bracket | Male | Female |
| Under 5 Years | 2 (11.1%) | 2 (10.5%) |
| 5 to 9 Years | 5 (27.8%) | 4 (21.0%) |
| 10 to 14 Years | 0 (0.0%) | 0 (0.0%) |
| 15 to 19 Years | 0 (0.0%) | 0 (0.0%) |
| 20 to 24 Years | 0 (0.0%) | 0 (0.0%) |
| 25 to 29 Years | 0 (0.0%) | 0 (0.0%) |
| 30 to 34 Years | 3 (16.7%) | 2 (10.5%) |
| 35 to 39 Years | 0 (0.0%) | 0 (0.0%) |
| 40 to 44 Years | 0 (0.0%) | 0 (0.0%) |
| 45 to 49 Years | 4 (22.2%) | 0 (0.0%) |
| 50 to 54 Years | 0 (0.0%) | 0 (0.0%) |
| 55 to 59 Years | 0 (0.0%) | 9 (47.4%) |
| 60 to 64 Years | 0 (0.0%) | 0 (0.0%) |
| 65 to 69 Years | 0 (0.0%) | 0 (0.0%) |
| 70 to 74 Years | 0 (0.0%) | 0 (0.0%) |
| 75 to 79 Years | 4 (22.2%) | 2 (10.5%) |
| 80 to 84 Years | 0 (0.0%) | 0 (0.0%) |
| 85 Years and over | 0 (0.0%) | 0 (0.0%) |
| Total | 18 (100.0%) | 19 (100.0%) |
Families and Households in Lookout
Median Family Size in Lookout
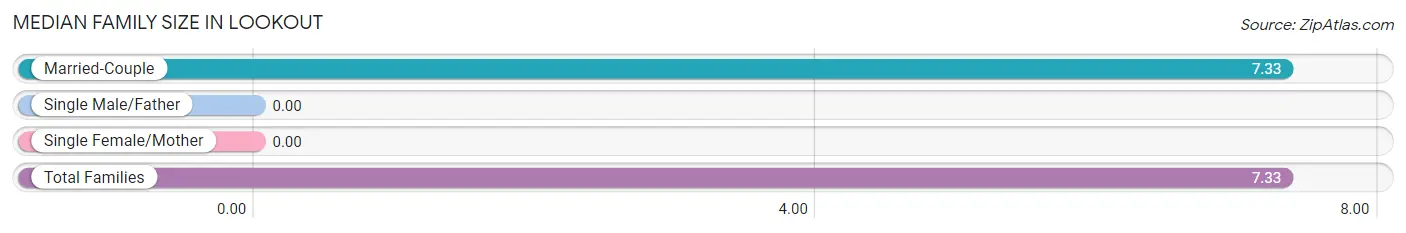
| Family Type | # Families | Family Size |
| Married-Couple | 3 (100.0%) | 7.33 |
| Single Male/Father | 0 (0.0%) | - |
| Single Female/Mother | 0 (0.0%) | - |
| Total Families | 3 (100.0%) | 7.33 |
Median Household Size in Lookout
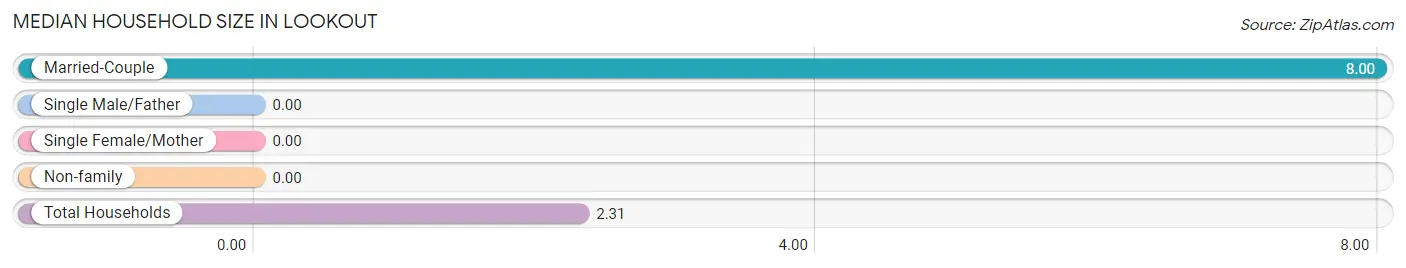
| Household Type | # Households | Household Size |
| Married-Couple | 3 (18.8%) | 8.00 |
| Single Male/Father | 0 (0.0%) | - |
| Single Female/Mother | 0 (0.0%) | - |
| Non-family | 13 (81.2%) | - |
| Total Households | 16 (100.0%) | 2.31 |
Household Size by Marriage Status in Lookout
Out of a total of 16 households in Lookout, 3 (18.8%) are family households, while 13 (81.2%) are nonfamily households. The most numerous type of family households are 2-person households, comprising 2, and the most common type of nonfamily households are 1-person households, comprising 13.
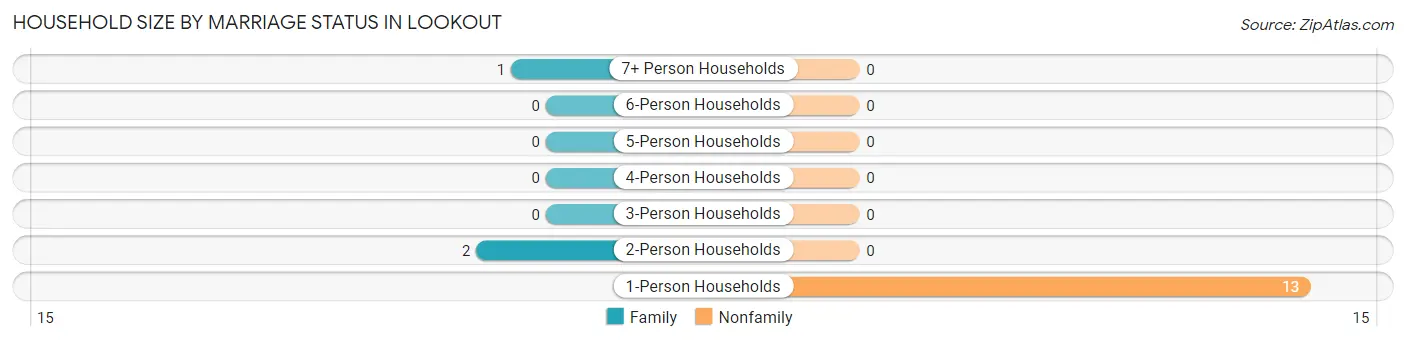
| Household Size | Family Households | Nonfamily Households |
| 1-Person Households | - | 13 (81.2%) |
| 2-Person Households | 2 (12.5%) | 0 (0.0%) |
| 3-Person Households | 0 (0.0%) | 0 (0.0%) |
| 4-Person Households | 0 (0.0%) | 0 (0.0%) |
| 5-Person Households | 0 (0.0%) | 0 (0.0%) |
| 6-Person Households | 0 (0.0%) | 0 (0.0%) |
| 7+ Person Households | 1 (6.2%) | 0 (0.0%) |
| Total | 3 (18.8%) | 13 (81.2%) |
Female Fertility in Lookout
Fertility by Age in Lookout
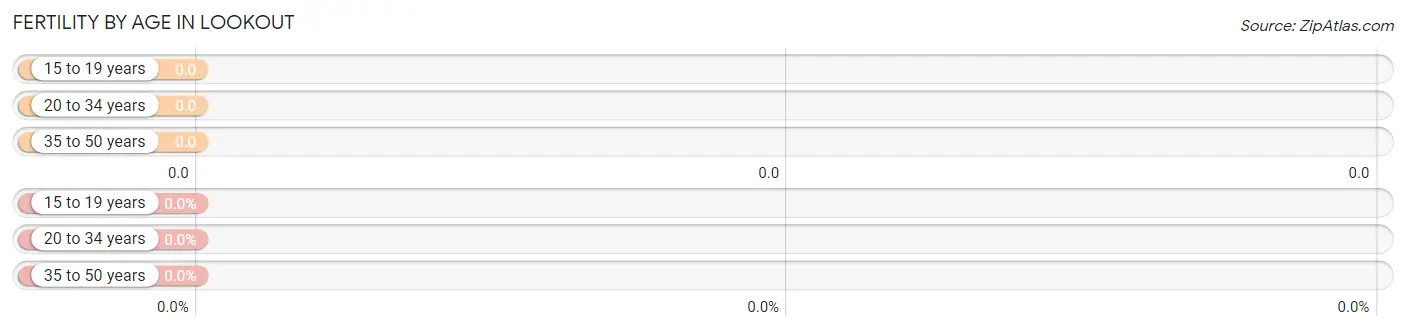
| Age Bracket | Women with Births | Births / 1,000 Women |
| 15 to 19 years | 0 (0.0%) | 0.0 |
| 20 to 34 years | 0 (0.0%) | 0.0 |
| 35 to 50 years | 0 (0.0%) | 0.0 |
| Total | 0 (0.0%) | 0.0 |
Fertility by Age by Marriage Status in Lookout
| Age Bracket | Married | Unmarried |
| 15 to 19 years | 0 (0.0%) | 0 (0.0%) |
| 20 to 34 years | 0 (0.0%) | 0 (0.0%) |
| 35 to 50 years | 0 (0.0%) | 0 (0.0%) |
| Total | 0 (0.0%) | 0 (0.0%) |
Fertility by Education in Lookout
| Educational Attainment | Women with Births | Births / 1,000 Women |
| Less than High School | 0 (0.0%) | 0.0 |
| High School Diploma | 0 (0.0%) | 0.0 |
| College or Associate's Degree | 0 (0.0%) | 0.0 |
| Bachelor's Degree | 0 (0.0%) | 0.0 |
| Graduate Degree | 0 (0.0%) | 0.0 |
| Total | 0 (0.0%) | 0.0 |
Fertility by Education by Marriage Status in Lookout
| Educational Attainment | Married | Unmarried |
| Less than High School | 0 (0.0%) | 0 (0.0%) |
| High School Diploma | 0 (0.0%) | 0 (0.0%) |
| College or Associate's Degree | 0 (0.0%) | 0 (0.0%) |
| Bachelor's Degree | 0 (0.0%) | 0 (0.0%) |
| Graduate Degree | 0 (0.0%) | 0 (0.0%) |
| Total | 0 (0.0%) | 0 (0.0%) |
Employment Characteristics in Lookout
Employment by Class of Employer in Lookout
Among the 9 employed individuals in Lookout, private company employees (5 | 55.6%), and state government employees (4 | 44.4%) make up the most common classes of employment.
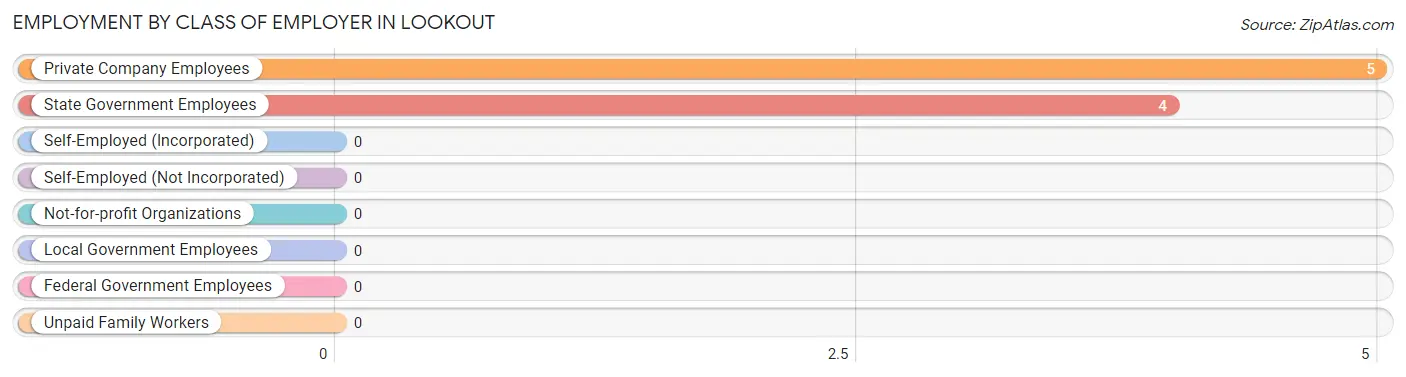
| Employer Class | # Employees | % Employees |
| Private Company Employees | 5 | 55.6% |
| Self-Employed (Incorporated) | 0 | 0.0% |
| Self-Employed (Not Incorporated) | 0 | 0.0% |
| Not-for-profit Organizations | 0 | 0.0% |
| Local Government Employees | 0 | 0.0% |
| State Government Employees | 4 | 44.4% |
| Federal Government Employees | 0 | 0.0% |
| Unpaid Family Workers | 0 | 0.0% |
| Total | 9 | 100.0% |
Employment Status by Age in Lookout
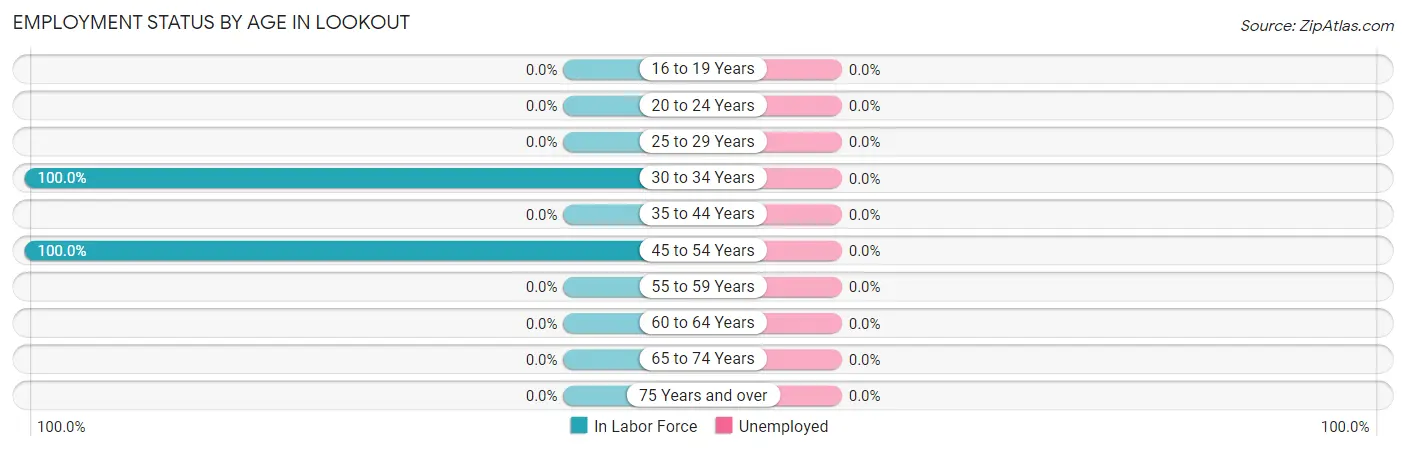
| Age Bracket | In Labor Force | Unemployed |
| 16 to 19 Years | 0 (0.0%) | 0 (0.0%) |
| 20 to 24 Years | 0 (0.0%) | 0 (0.0%) |
| 25 to 29 Years | 0 (0.0%) | 0 (0.0%) |
| 30 to 34 Years | 5 (100.0%) | 0 (0.0%) |
| 35 to 44 Years | 0 (0.0%) | 0 (0.0%) |
| 45 to 54 Years | 4 (100.0%) | 0 (0.0%) |
| 55 to 59 Years | 0 (0.0%) | 0 (0.0%) |
| 60 to 64 Years | 0 (0.0%) | 0 (0.0%) |
| 65 to 74 Years | 0 (0.0%) | 0 (0.0%) |
| 75 Years and over | 0 (0.0%) | 0 (0.0%) |
| Total | 9 (37.5%) | 0 (0.0%) |
Employment Status by Educational Attainment in Lookout
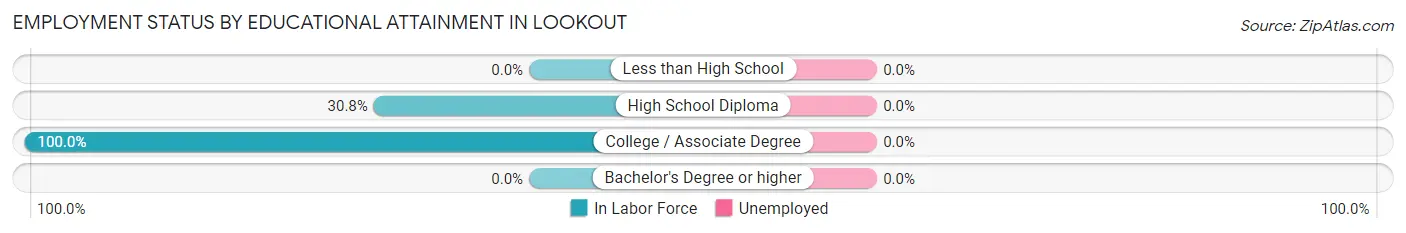
| Educational Attainment | In Labor Force | Unemployed |
| Less than High School | 0 (0.0%) | 0 (0.0%) |
| High School Diploma | 4 (30.8%) | 0 (0.0%) |
| College / Associate Degree | 5 (100.0%) | 0 (0.0%) |
| Bachelor's Degree or higher | 0 (0.0%) | 0 (0.0%) |
| Total | 9 (50.0%) | 0 (0.0%) |
Employment Occupations by Sex in Lookout
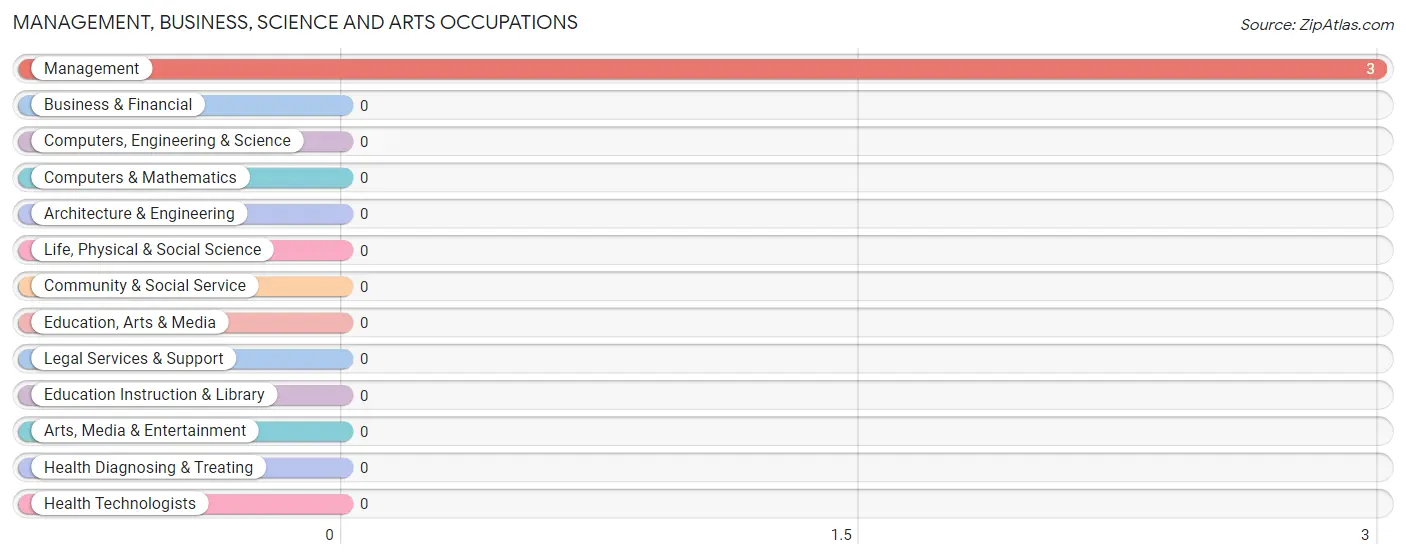
Management, Business, Science and Arts Occupations
The most common Management, Business, Science and Arts occupations in Lookout are , and Management (3 | 33.3%).
Management, Business, Science and Arts Occupations by Sex
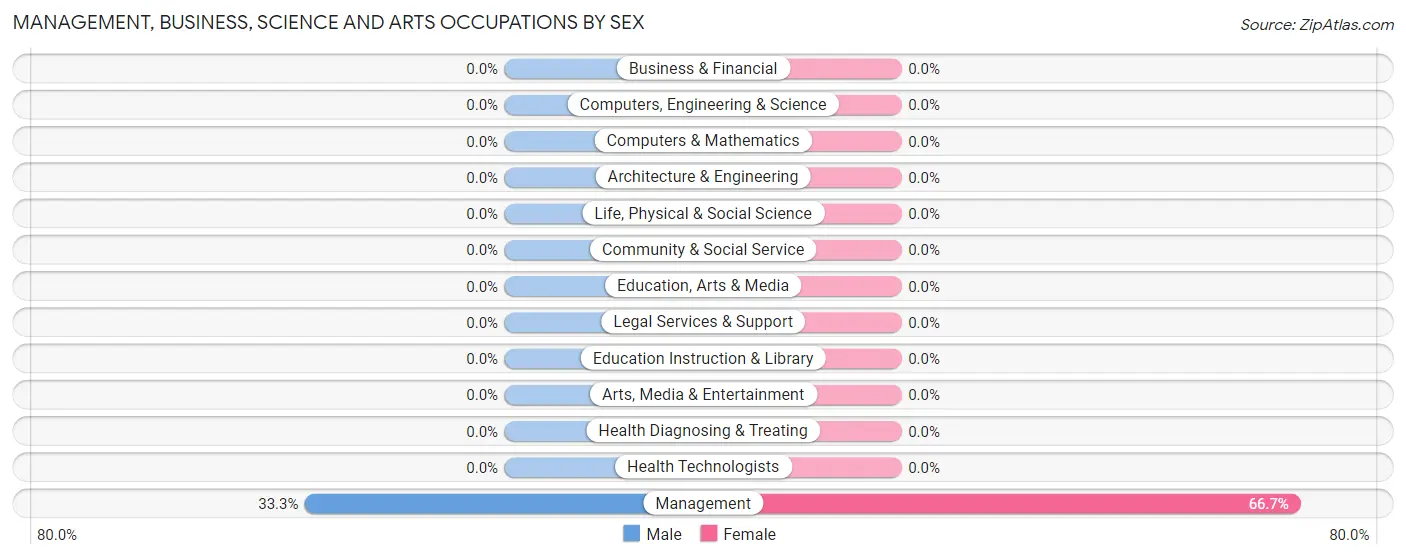
| Occupation | Male | Female |
| Management | 1 (33.3%) | 2 (66.7%) |
| Business & Financial | 0 (0.0%) | 0 (0.0%) |
| Computers, Engineering & Science | 0 (0.0%) | 0 (0.0%) |
| Computers & Mathematics | 0 (0.0%) | 0 (0.0%) |
| Architecture & Engineering | 0 (0.0%) | 0 (0.0%) |
| Life, Physical & Social Science | 0 (0.0%) | 0 (0.0%) |
| Community & Social Service | 0 (0.0%) | 0 (0.0%) |
| Education, Arts & Media | 0 (0.0%) | 0 (0.0%) |
| Legal Services & Support | 0 (0.0%) | 0 (0.0%) |
| Education Instruction & Library | 0 (0.0%) | 0 (0.0%) |
| Arts, Media & Entertainment | 0 (0.0%) | 0 (0.0%) |
| Health Diagnosing & Treating | 0 (0.0%) | 0 (0.0%) |
| Health Technologists | 0 (0.0%) | 0 (0.0%) |
| Total (Category) | 1 (33.3%) | 2 (66.7%) |
| Total (Overall) | 7 (77.8%) | 2 (22.2%) |
Services Occupations
Services Occupations by Sex
| Occupation | Male | Female |
| Healthcare Support | 0 (0.0%) | 0 (0.0%) |
| Security & Protection | 0 (0.0%) | 0 (0.0%) |
| Firefighting & Prevention | 0 (0.0%) | 0 (0.0%) |
| Law Enforcement | 0 (0.0%) | 0 (0.0%) |
| Food Preparation & Serving | 0 (0.0%) | 0 (0.0%) |
| Cleaning & Maintenance | 0 (0.0%) | 0 (0.0%) |
| Personal Care & Service | 0 (0.0%) | 0 (0.0%) |
| Total (Category) | 0 (0.0%) | 0 (0.0%) |
| Total (Overall) | 7 (77.8%) | 2 (22.2%) |
Sales and Office Occupations
Sales and Office Occupations by Sex
| Occupation | Male | Female |
| Sales & Related | 0 (0.0%) | 0 (0.0%) |
| Office & Administration | 0 (0.0%) | 0 (0.0%) |
| Total (Category) | 0 (0.0%) | 0 (0.0%) |
| Total (Overall) | 7 (77.8%) | 2 (22.2%) |
Natural Resources, Construction and Maintenance Occupations
The most common Natural Resources, Construction and Maintenance occupations in Lookout are Construction & Extraction (4 | 44.4%), and Installation, Maintenance & Repair (2 | 22.2%).
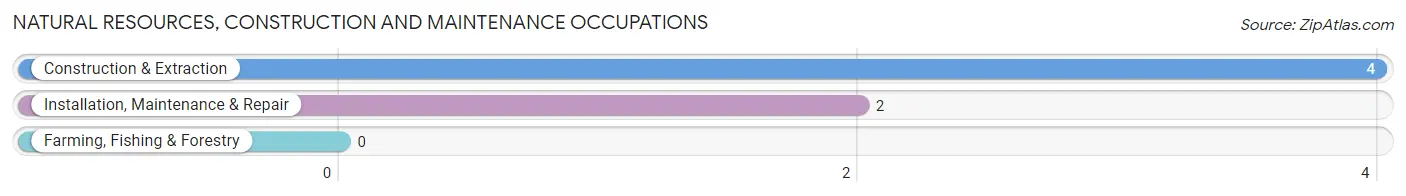
Natural Resources, Construction and Maintenance Occupations by Sex
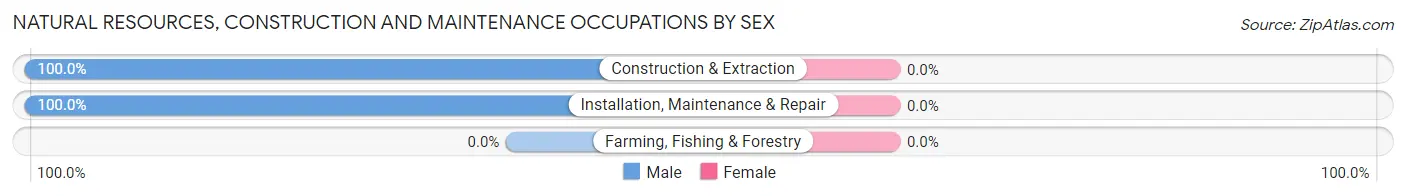
| Occupation | Male | Female |
| Farming, Fishing & Forestry | 0 (0.0%) | 0 (0.0%) |
| Construction & Extraction | 4 (100.0%) | 0 (0.0%) |
| Installation, Maintenance & Repair | 2 (100.0%) | 0 (0.0%) |
| Total (Category) | 6 (100.0%) | 0 (0.0%) |
| Total (Overall) | 7 (77.8%) | 2 (22.2%) |
Production, Transportation and Moving Occupations
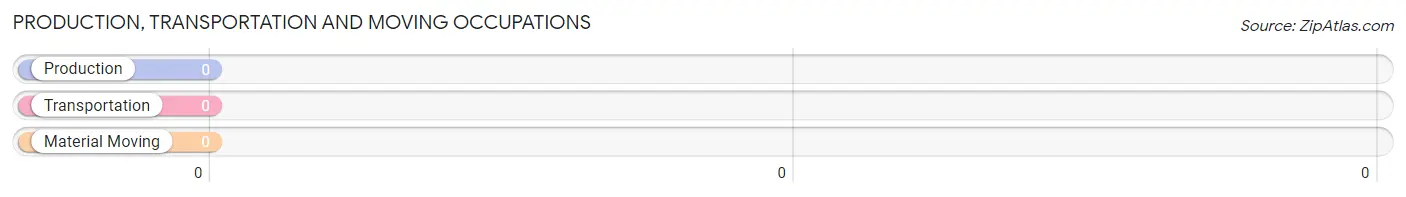
Production, Transportation and Moving Occupations by Sex
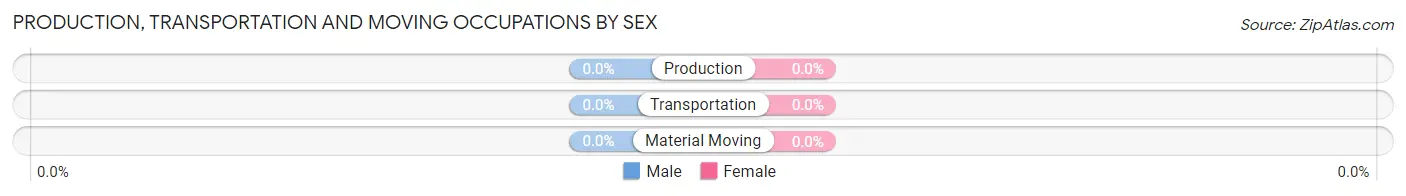
| Occupation | Male | Female |
| Production | 0 (0.0%) | 0 (0.0%) |
| Transportation | 0 (0.0%) | 0 (0.0%) |
| Material Moving | 0 (0.0%) | 0 (0.0%) |
| Total (Category) | 0 (0.0%) | 0 (0.0%) |
| Total (Overall) | 7 (77.8%) | 2 (22.2%) |
Employment Industries by Sex in Lookout
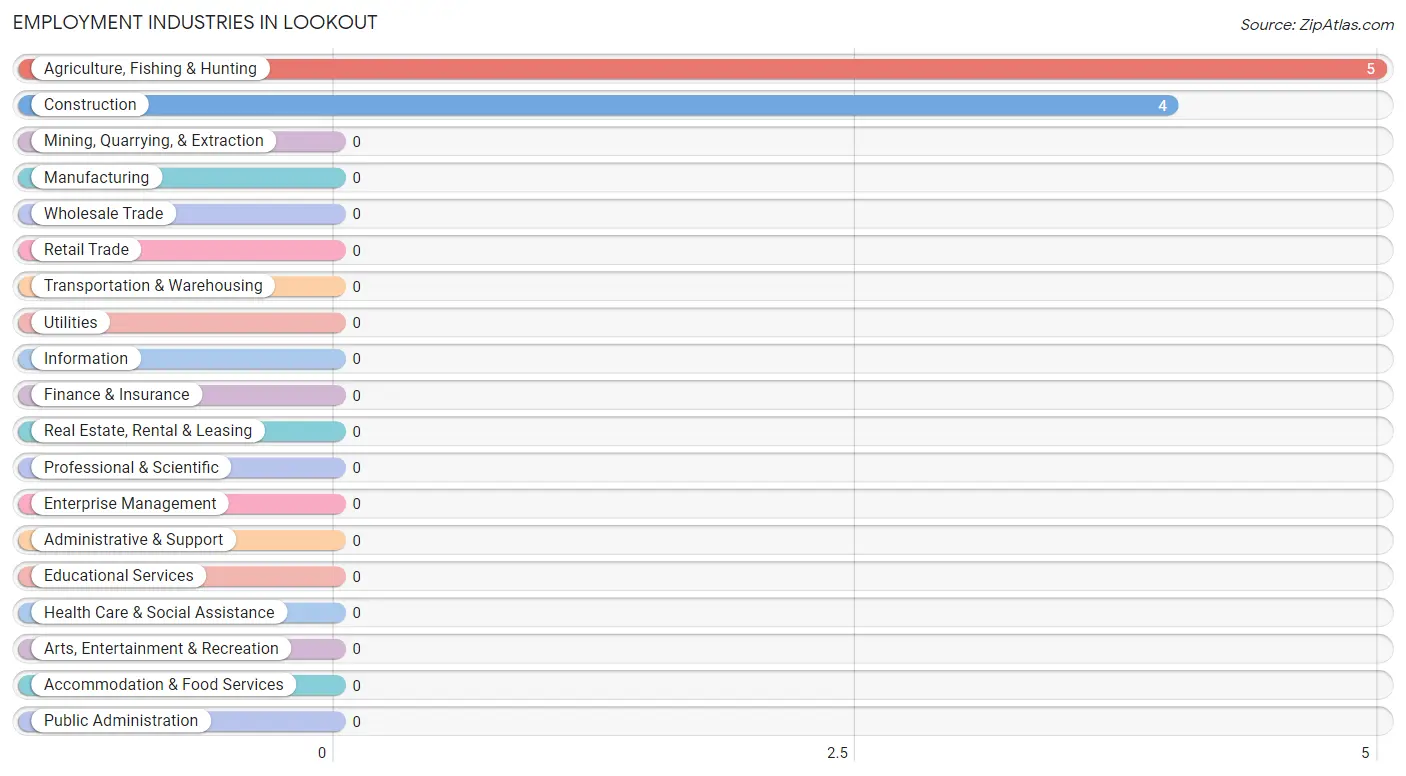
Employment Industries in Lookout
The major employment industries in Lookout include Agriculture, Fishing & Hunting (5 | 55.6%), and Construction (4 | 44.4%).
Employment Industries by Sex in Lookout
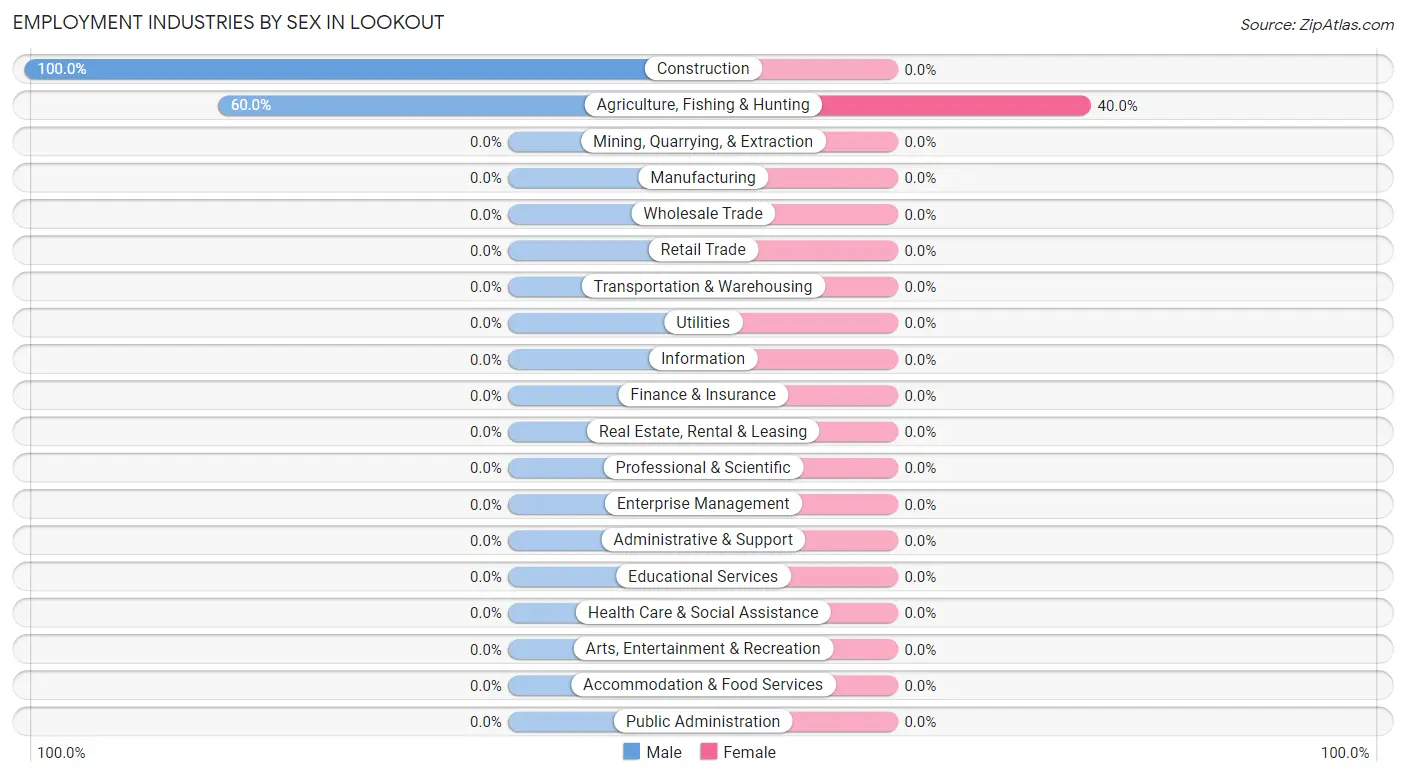
| Industry | Male | Female |
| Agriculture, Fishing & Hunting | 3 (60.0%) | 2 (40.0%) |
| Mining, Quarrying, & Extraction | 0 (0.0%) | 0 (0.0%) |
| Construction | 4 (100.0%) | 0 (0.0%) |
| Manufacturing | 0 (0.0%) | 0 (0.0%) |
| Wholesale Trade | 0 (0.0%) | 0 (0.0%) |
| Retail Trade | 0 (0.0%) | 0 (0.0%) |
| Transportation & Warehousing | 0 (0.0%) | 0 (0.0%) |
| Utilities | 0 (0.0%) | 0 (0.0%) |
| Information | 0 (0.0%) | 0 (0.0%) |
| Finance & Insurance | 0 (0.0%) | 0 (0.0%) |
| Real Estate, Rental & Leasing | 0 (0.0%) | 0 (0.0%) |
| Professional & Scientific | 0 (0.0%) | 0 (0.0%) |
| Enterprise Management | 0 (0.0%) | 0 (0.0%) |
| Administrative & Support | 0 (0.0%) | 0 (0.0%) |
| Educational Services | 0 (0.0%) | 0 (0.0%) |
| Health Care & Social Assistance | 0 (0.0%) | 0 (0.0%) |
| Arts, Entertainment & Recreation | 0 (0.0%) | 0 (0.0%) |
| Accommodation & Food Services | 0 (0.0%) | 0 (0.0%) |
| Public Administration | 0 (0.0%) | 0 (0.0%) |
| Total | 7 (77.8%) | 2 (22.2%) |
Education in Lookout
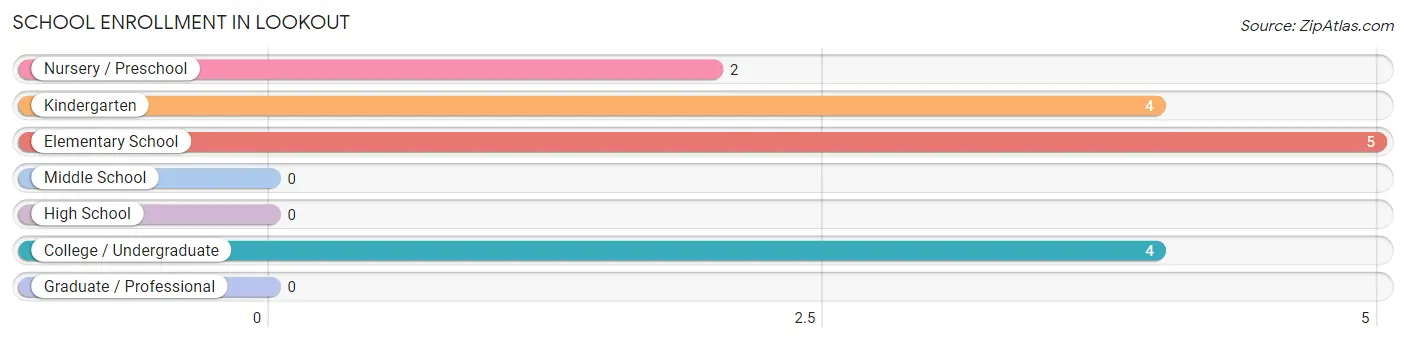
School Enrollment in Lookout
The most common levels of schooling among the 15 students in Lookout are elementary school (5 | 33.3%), kindergarten (4 | 26.7%), and college / undergraduate (4 | 26.7%).
| School Level | # Students | % Students |
| Nursery / Preschool | 2 | 13.3% |
| Kindergarten | 4 | 26.7% |
| Elementary School | 5 | 33.3% |
| Middle School | 0 | 0.0% |
| High School | 0 | 0.0% |
| College / Undergraduate | 4 | 26.7% |
| Graduate / Professional | 0 | 0.0% |
| Total | 15 | 100.0% |
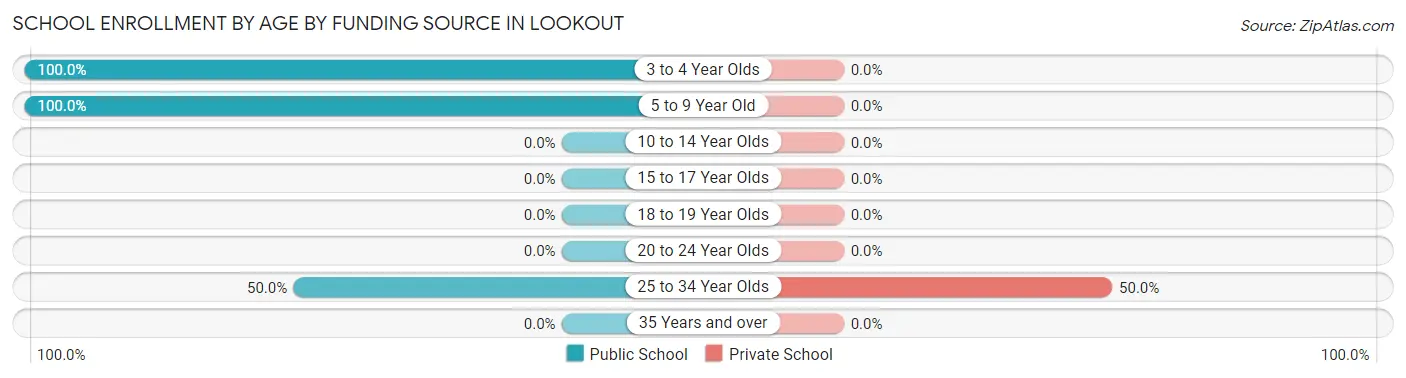
School Enrollment by Age by Funding Source in Lookout
Out of a total of 15 students who are enrolled in schools in Lookout, 2 (13.3%) attend a private institution, while the remaining 13 (86.7%) are enrolled in public schools. The age group of 25 to 34 year olds has the highest likelihood of being enrolled in private schools, with 2 (50.0% in the age bracket) enrolled. Conversely, the age group of 3 to 4 year olds has the lowest likelihood of being enrolled in a private school, with 2 (100.0% in the age bracket) attending a public institution.
| Age Bracket | Public School | Private School |
| 3 to 4 Year Olds | 2 (100.0%) | 0 (0.0%) |
| 5 to 9 Year Old | 9 (100.0%) | 0 (0.0%) |
| 10 to 14 Year Olds | 0 (0.0%) | 0 (0.0%) |
| 15 to 17 Year Olds | 0 (0.0%) | 0 (0.0%) |
| 18 to 19 Year Olds | 0 (0.0%) | 0 (0.0%) |
| 20 to 24 Year Olds | 0 (0.0%) | 0 (0.0%) |
| 25 to 34 Year Olds | 2 (50.0%) | 2 (50.0%) |
| 35 Years and over | 0 (0.0%) | 0 (0.0%) |
| Total | 13 (86.7%) | 2 (13.3%) |
Educational Attainment by Field of Study in Lookout
| Field of Study | # Graduates | % Graduates |
| Computers & Mathematics | 0 | 0.0% |
| Bio, Nature & Agricultural | 0 | 0.0% |
| Physical & Health Sciences | 0 | 0.0% |
| Psychology | 0 | 0.0% |
| Social Sciences | 0 | 0.0% |
| Engineering | 0 | 0.0% |
| Multidisciplinary Studies | 0 | 0.0% |
| Science & Technology | 0 | 0.0% |
| Business | 0 | 0.0% |
| Education | 0 | 0.0% |
| Literature & Languages | 0 | 0.0% |
| Liberal Arts & History | 0 | 0.0% |
| Visual & Performing Arts | 0 | 0.0% |
| Communications | 0 | 0.0% |
| Arts & Humanities | 0 | 0.0% |
| Total | 0 | 0.0% |
Transportation & Commute in Lookout
Vehicle Availability by Sex in Lookout
The most prevalent vehicle ownership categories in Lookout are males with 2 vehicles (4, accounting for 57.1%) and females with 2 vehicles (0, making up 200.0%).
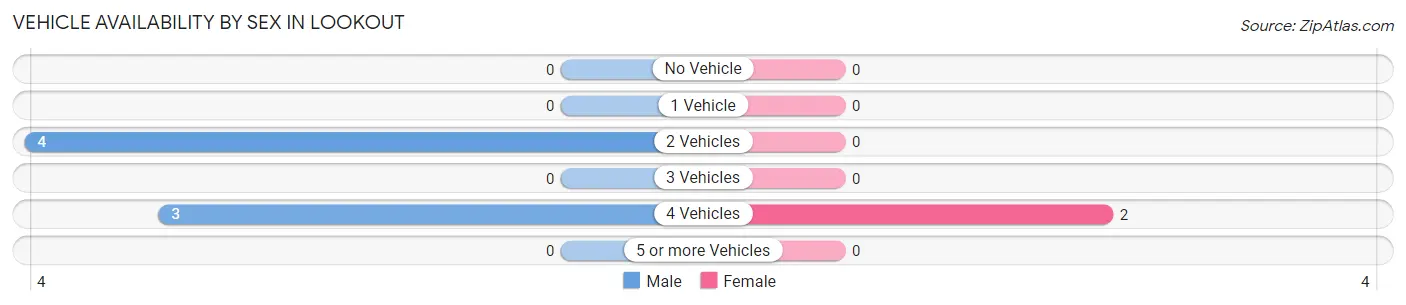
| Vehicles Available | Male | Female |
| No Vehicle | 0 (0.0%) | 0 (0.0%) |
| 1 Vehicle | 0 (0.0%) | 0 (0.0%) |
| 2 Vehicles | 4 (57.1%) | 0 (0.0%) |
| 3 Vehicles | 0 (0.0%) | 0 (0.0%) |
| 4 Vehicles | 3 (42.9%) | 2 (100.0%) |
| 5 or more Vehicles | 0 (0.0%) | 0 (0.0%) |
| Total | 7 (100.0%) | 2 (100.0%) |
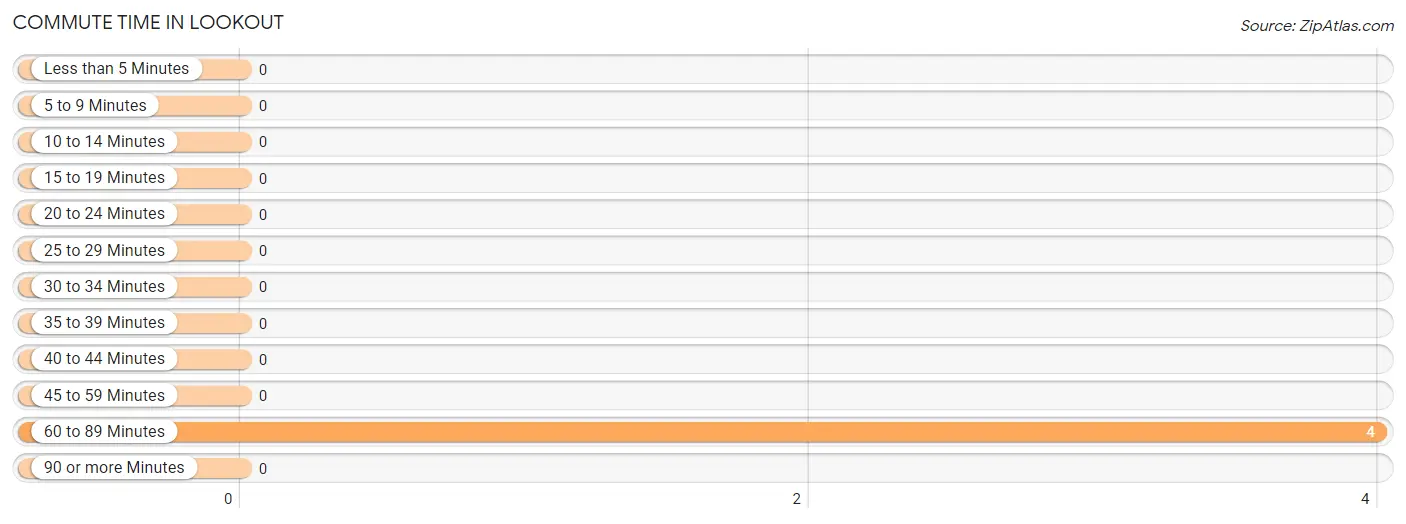
Commute Time in Lookout
The most frequently occuring commute durations in Lookout are 60 to 89 minutes (4 commuters, 100.0%), less than 5 minutes (0 commuters, 0.0%), and 5 to 9 minutes (0 commuters, 0.0%).
| Commute Time | # Commuters | % Commuters |
| Less than 5 Minutes | 0 | 0.0% |
| 5 to 9 Minutes | 0 | 0.0% |
| 10 to 14 Minutes | 0 | 0.0% |
| 15 to 19 Minutes | 0 | 0.0% |
| 20 to 24 Minutes | 0 | 0.0% |
| 25 to 29 Minutes | 0 | 0.0% |
| 30 to 34 Minutes | 0 | 0.0% |
| 35 to 39 Minutes | 0 | 0.0% |
| 40 to 44 Minutes | 0 | 0.0% |
| 45 to 59 Minutes | 0 | 0.0% |
| 60 to 89 Minutes | 4 | 100.0% |
| 90 or more Minutes | 0 | 0.0% |
Commute Time by Sex in Lookout
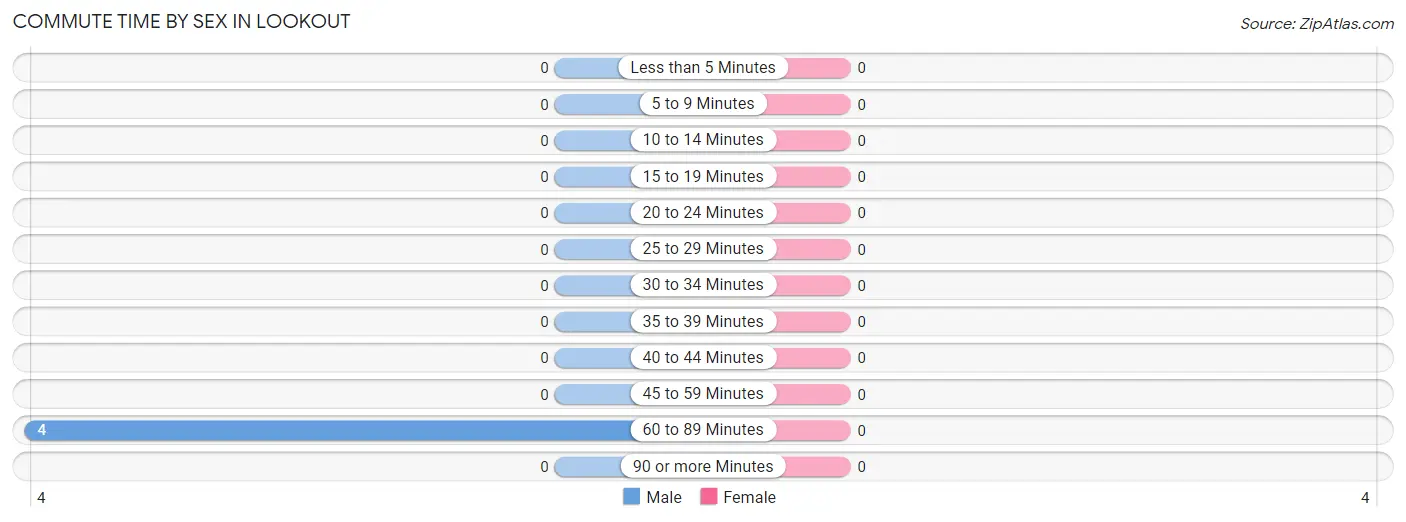
| Commute Time | Male | Female |
| Less than 5 Minutes | 0 (0.0%) | 0 (0.0%) |
| 5 to 9 Minutes | 0 (0.0%) | 0 (0.0%) |
| 10 to 14 Minutes | 0 (0.0%) | 0 (0.0%) |
| 15 to 19 Minutes | 0 (0.0%) | 0 (0.0%) |
| 20 to 24 Minutes | 0 (0.0%) | 0 (0.0%) |
| 25 to 29 Minutes | 0 (0.0%) | 0 (0.0%) |
| 30 to 34 Minutes | 0 (0.0%) | 0 (0.0%) |
| 35 to 39 Minutes | 0 (0.0%) | 0 (0.0%) |
| 40 to 44 Minutes | 0 (0.0%) | 0 (0.0%) |
| 45 to 59 Minutes | 0 (0.0%) | 0 (0.0%) |
| 60 to 89 Minutes | 4 (100.0%) | 0 (0.0%) |
| 90 or more Minutes | 0 (0.0%) | 0 (0.0%) |
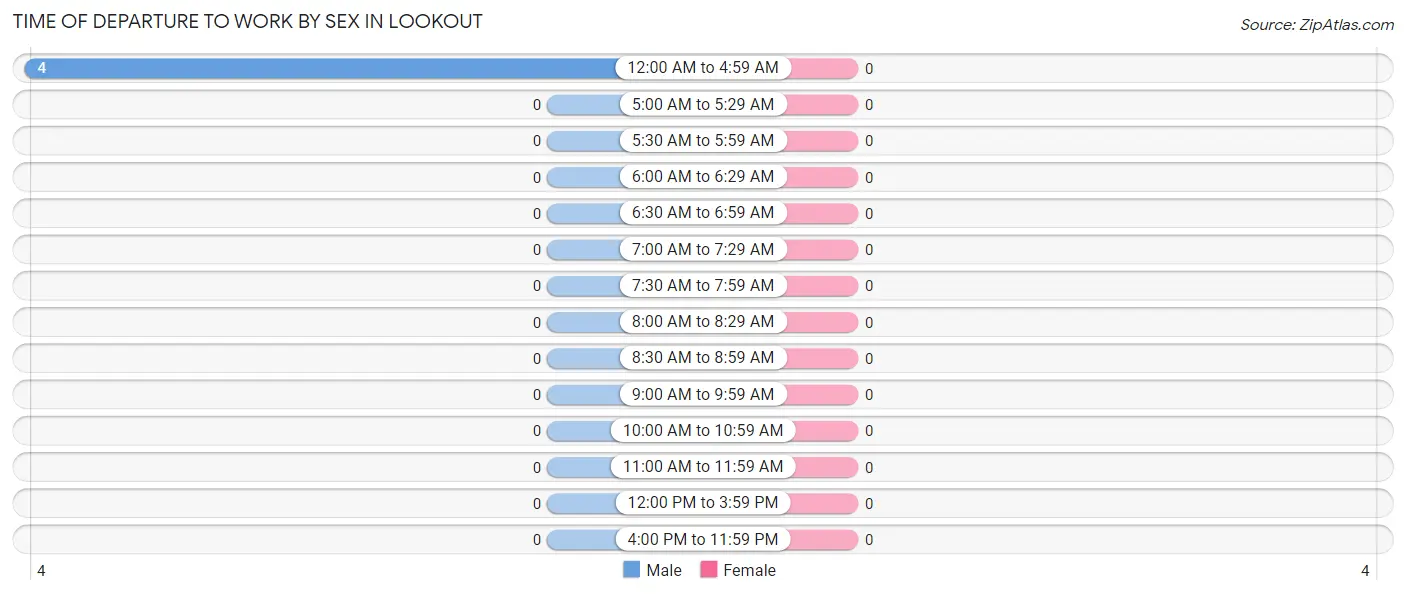
Time of Departure to Work by Sex in Lookout
| Time of Departure | Male | Female |
| 12:00 AM to 4:59 AM | 4 (100.0%) | 0 (0.0%) |
| 5:00 AM to 5:29 AM | 0 (0.0%) | 0 (0.0%) |
| 5:30 AM to 5:59 AM | 0 (0.0%) | 0 (0.0%) |
| 6:00 AM to 6:29 AM | 0 (0.0%) | 0 (0.0%) |
| 6:30 AM to 6:59 AM | 0 (0.0%) | 0 (0.0%) |
| 7:00 AM to 7:29 AM | 0 (0.0%) | 0 (0.0%) |
| 7:30 AM to 7:59 AM | 0 (0.0%) | 0 (0.0%) |
| 8:00 AM to 8:29 AM | 0 (0.0%) | 0 (0.0%) |
| 8:30 AM to 8:59 AM | 0 (0.0%) | 0 (0.0%) |
| 9:00 AM to 9:59 AM | 0 (0.0%) | 0 (0.0%) |
| 10:00 AM to 10:59 AM | 0 (0.0%) | 0 (0.0%) |
| 11:00 AM to 11:59 AM | 0 (0.0%) | 0 (0.0%) |
| 12:00 PM to 3:59 PM | 0 (0.0%) | 0 (0.0%) |
| 4:00 PM to 11:59 PM | 0 (0.0%) | 0 (0.0%) |
| Total | 4 (100.0%) | 0 (0.0%) |
Housing Occupancy in Lookout
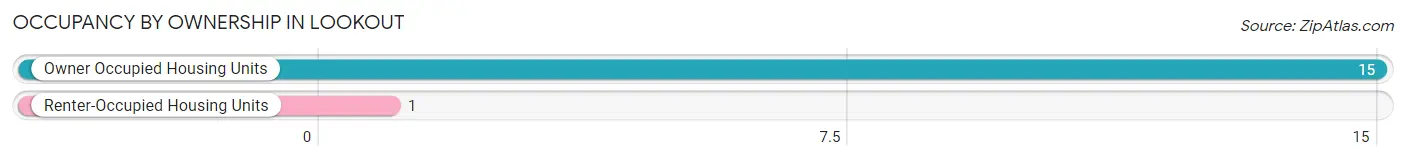
Occupancy by Ownership in Lookout
Of the total 16 dwellings in Lookout, owner-occupied units account for 15 (93.8%), while renter-occupied units make up 1 (6.2%).
| Occupancy | # Housing Units | % Housing Units |
| Owner Occupied Housing Units | 15 | 93.8% |
| Renter-Occupied Housing Units | 1 | 6.2% |
| Total Occupied Housing Units | 16 | 100.0% |
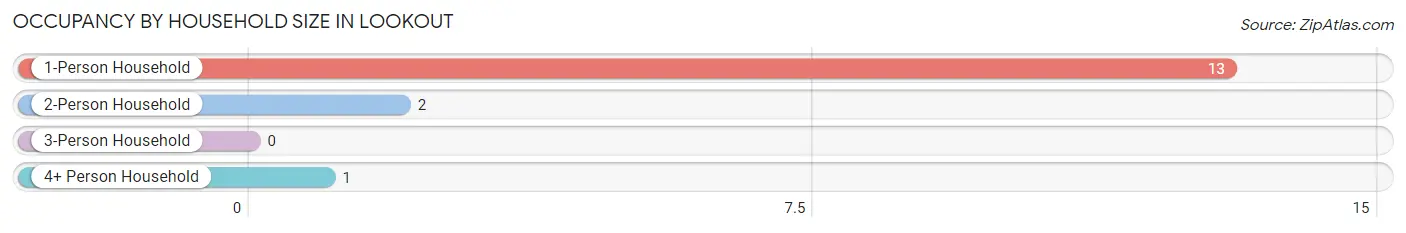
Occupancy by Household Size in Lookout
| Household Size | # Housing Units | % Housing Units |
| 1-Person Household | 13 | 81.2% |
| 2-Person Household | 2 | 12.5% |
| 3-Person Household | 0 | 0.0% |
| 4+ Person Household | 1 | 6.2% |
| Total Housing Units | 16 | 100.0% |
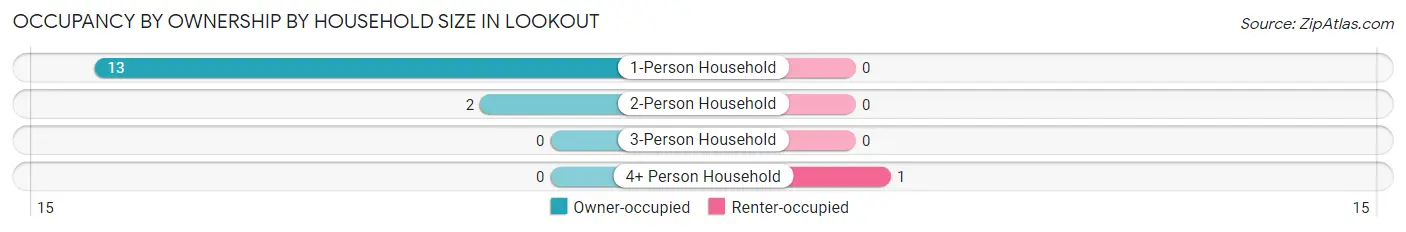
Occupancy by Ownership by Household Size in Lookout
| Household Size | Owner-occupied | Renter-occupied |
| 1-Person Household | 13 (100.0%) | 0 (0.0%) |
| 2-Person Household | 2 (100.0%) | 0 (0.0%) |
| 3-Person Household | 0 (0.0%) | 0 (0.0%) |
| 4+ Person Household | 0 (0.0%) | 1 (100.0%) |
| Total Housing Units | 15 (93.8%) | 1 (6.2%) |
Occupancy by Educational Attainment in Lookout
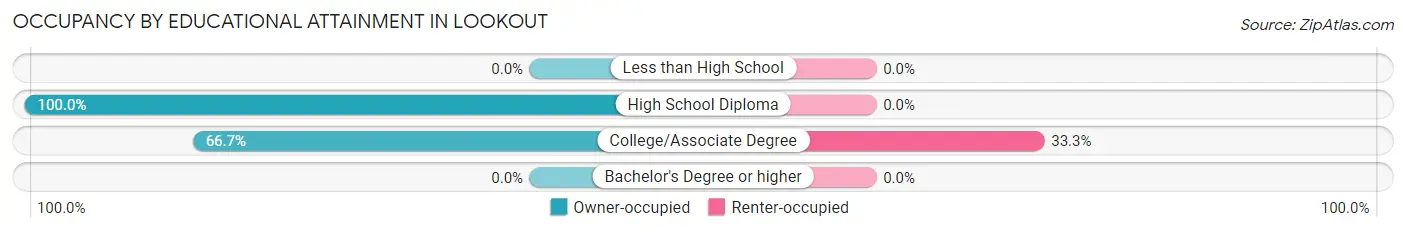
| Household Size | Owner-occupied | Renter-occupied |
| Less than High School | 0 (0.0%) | 0 (0.0%) |
| High School Diploma | 13 (100.0%) | 0 (0.0%) |
| College/Associate Degree | 2 (66.7%) | 1 (33.3%) |
| Bachelor's Degree or higher | 0 (0.0%) | 0 (0.0%) |
Occupancy by Age of Householder in Lookout
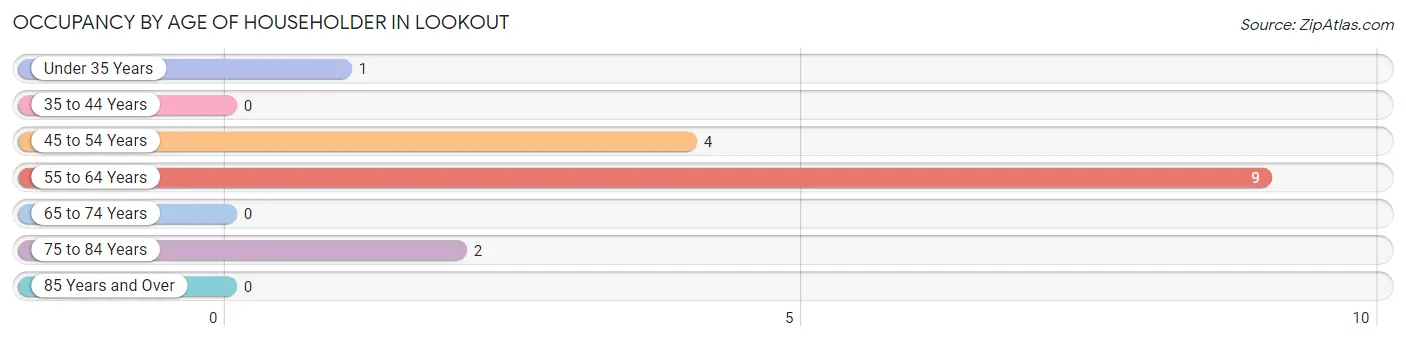
| Age Bracket | # Households | % Households |
| Under 35 Years | 1 | 6.2% |
| 35 to 44 Years | 0 | 0.0% |
| 45 to 54 Years | 4 | 25.0% |
| 55 to 64 Years | 9 | 56.2% |
| 65 to 74 Years | 0 | 0.0% |
| 75 to 84 Years | 2 | 12.5% |
| 85 Years and Over | 0 | 0.0% |
| Total | 16 | 100.0% |
Housing Finances in Lookout
Median Income by Occupancy in Lookout
| Occupancy Type | # Households | Median Income |
| Owner-Occupied | 15 (93.8%) | $0 |
| Renter-Occupied | 1 (6.2%) | $0 |
| Average | 16 (100.0%) | $0 |
Occupancy by Householder Income Bracket in Lookout
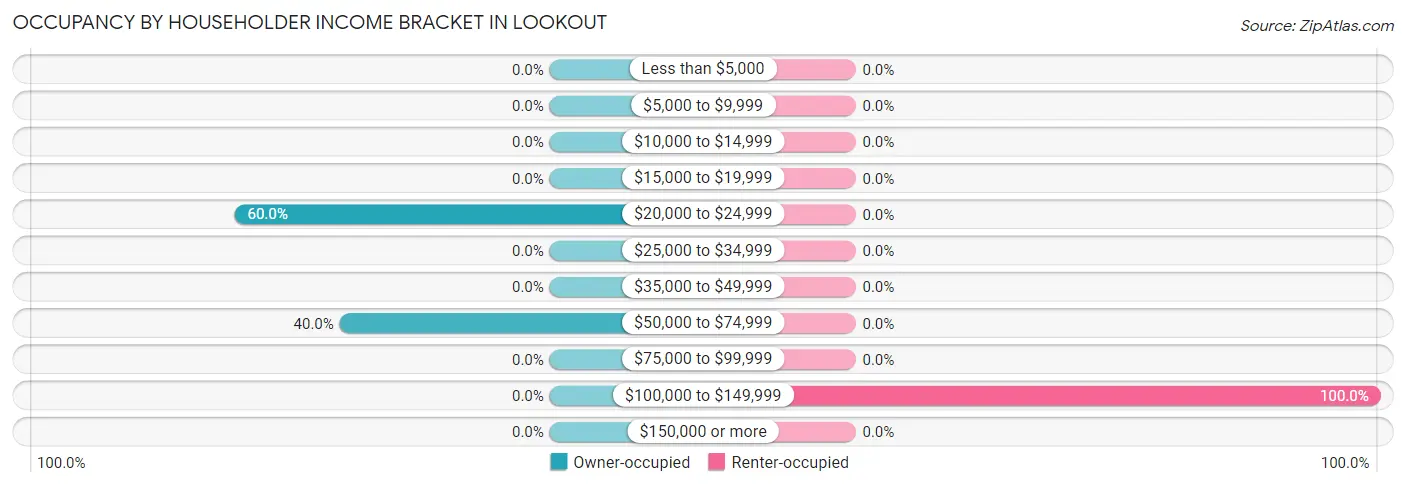
| Income Bracket | Owner-occupied | Renter-occupied |
| Less than $5,000 | 0 (0.0%) | 0 (0.0%) |
| $5,000 to $9,999 | 0 (0.0%) | 0 (0.0%) |
| $10,000 to $14,999 | 0 (0.0%) | 0 (0.0%) |
| $15,000 to $19,999 | 0 (0.0%) | 0 (0.0%) |
| $20,000 to $24,999 | 9 (60.0%) | 0 (0.0%) |
| $25,000 to $34,999 | 0 (0.0%) | 0 (0.0%) |
| $35,000 to $49,999 | 0 (0.0%) | 0 (0.0%) |
| $50,000 to $74,999 | 6 (40.0%) | 0 (0.0%) |
| $75,000 to $99,999 | 0 (0.0%) | 0 (0.0%) |
| $100,000 to $149,999 | 0 (0.0%) | 1 (100.0%) |
| $150,000 or more | 0 (0.0%) | 0 (0.0%) |
| Total | 15 (100.0%) | 1 (100.0%) |
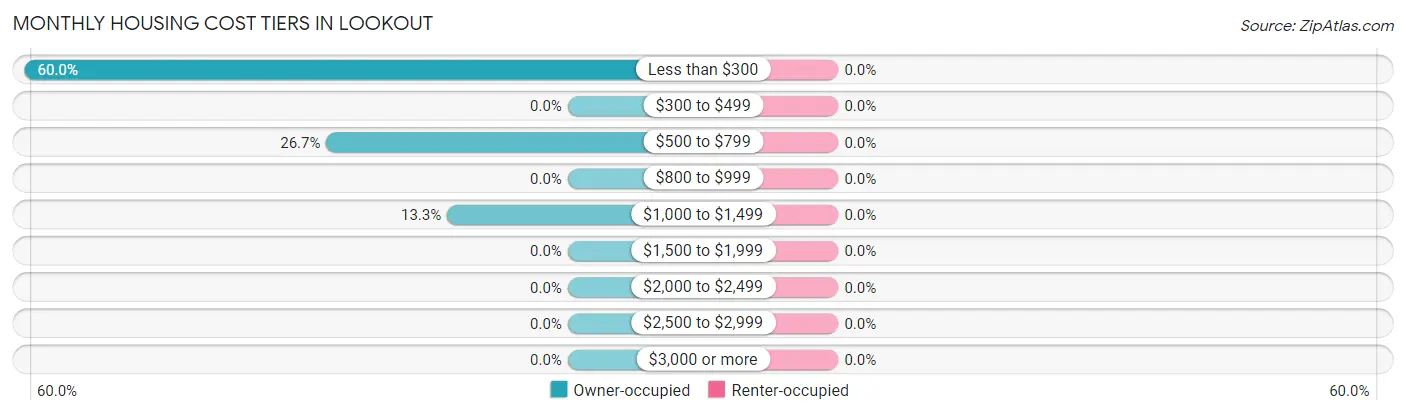
Monthly Housing Cost Tiers in Lookout
| Monthly Cost | Owner-occupied | Renter-occupied |
| Less than $300 | 9 (60.0%) | 0 (0.0%) |
| $300 to $499 | 0 (0.0%) | 0 (0.0%) |
| $500 to $799 | 4 (26.7%) | 0 (0.0%) |
| $800 to $999 | 0 (0.0%) | 0 (0.0%) |
| $1,000 to $1,499 | 2 (13.3%) | 0 (0.0%) |
| $1,500 to $1,999 | 0 (0.0%) | 0 (0.0%) |
| $2,000 to $2,499 | 0 (0.0%) | 0 (0.0%) |
| $2,500 to $2,999 | 0 (0.0%) | 0 (0.0%) |
| $3,000 or more | 0 (0.0%) | 0 (0.0%) |
| Total | 15 (100.0%) | 1 (100.0%) |
Physical Housing Characteristics in Lookout
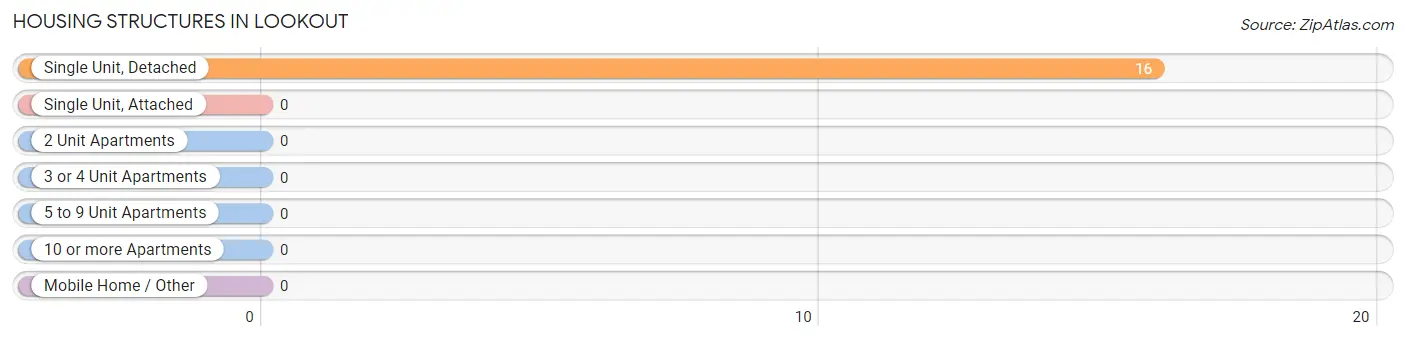
Housing Structures in Lookout
| Structure Type | # Housing Units | % Housing Units |
| Single Unit, Detached | 16 | 100.0% |
| Single Unit, Attached | 0 | 0.0% |
| 2 Unit Apartments | 0 | 0.0% |
| 3 or 4 Unit Apartments | 0 | 0.0% |
| 5 to 9 Unit Apartments | 0 | 0.0% |
| 10 or more Apartments | 0 | 0.0% |
| Mobile Home / Other | 0 | 0.0% |
| Total | 16 | 100.0% |
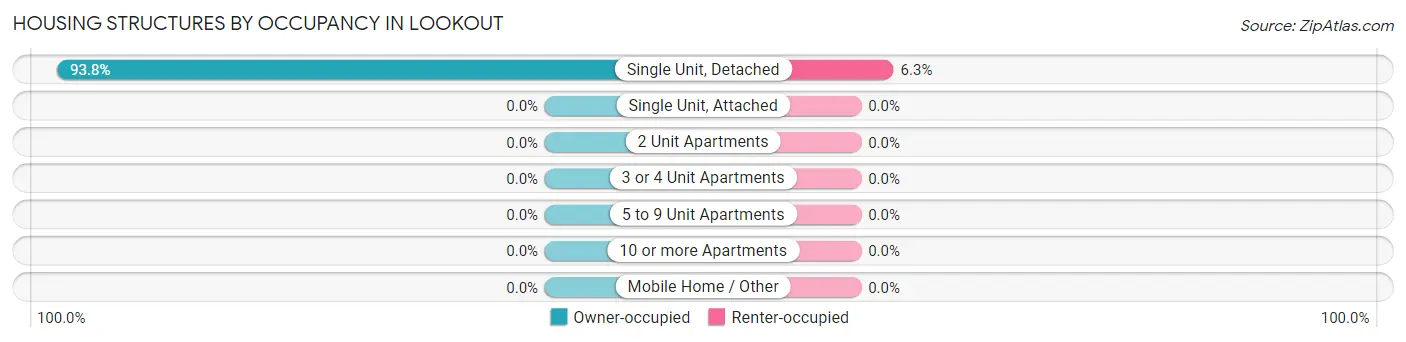
Housing Structures by Occupancy in Lookout
| Structure Type | Owner-occupied | Renter-occupied |
| Single Unit, Detached | 15 (93.8%) | 1 (6.2%) |
| Single Unit, Attached | 0 (0.0%) | 0 (0.0%) |
| 2 Unit Apartments | 0 (0.0%) | 0 (0.0%) |
| 3 or 4 Unit Apartments | 0 (0.0%) | 0 (0.0%) |
| 5 to 9 Unit Apartments | 0 (0.0%) | 0 (0.0%) |
| 10 or more Apartments | 0 (0.0%) | 0 (0.0%) |
| Mobile Home / Other | 0 (0.0%) | 0 (0.0%) |
| Total | 15 (93.8%) | 1 (6.2%) |
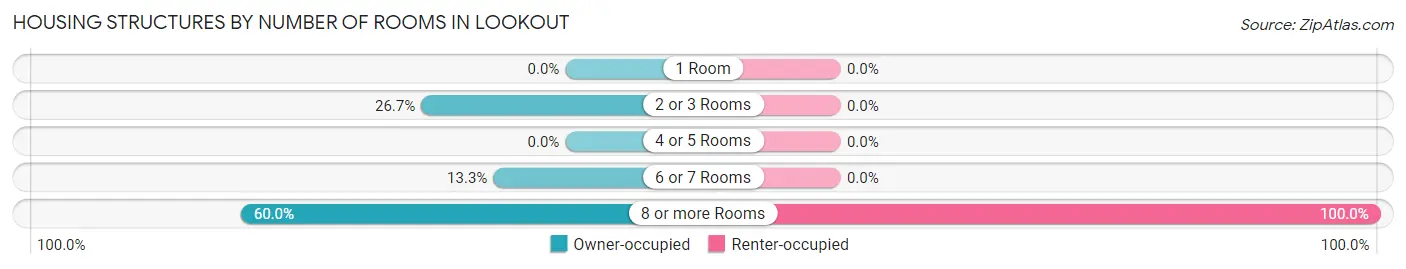
Housing Structures by Number of Rooms in Lookout
| Number of Rooms | Owner-occupied | Renter-occupied |
| 1 Room | 0 (0.0%) | 0 (0.0%) |
| 2 or 3 Rooms | 4 (26.7%) | 0 (0.0%) |
| 4 or 5 Rooms | 0 (0.0%) | 0 (0.0%) |
| 6 or 7 Rooms | 2 (13.3%) | 0 (0.0%) |
| 8 or more Rooms | 9 (60.0%) | 1 (100.0%) |
| Total | 15 (100.0%) | 1 (100.0%) |
Housing Structure by Heating Type in Lookout
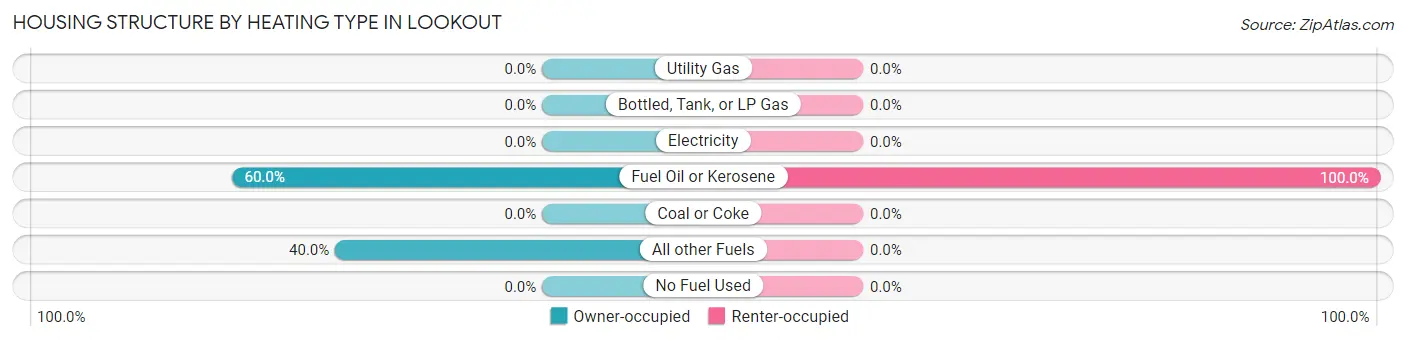
| Heating Type | Owner-occupied | Renter-occupied |
| Utility Gas | 0 (0.0%) | 0 (0.0%) |
| Bottled, Tank, or LP Gas | 0 (0.0%) | 0 (0.0%) |
| Electricity | 0 (0.0%) | 0 (0.0%) |
| Fuel Oil or Kerosene | 9 (60.0%) | 1 (100.0%) |
| Coal or Coke | 0 (0.0%) | 0 (0.0%) |
| All other Fuels | 6 (40.0%) | 0 (0.0%) |
| No Fuel Used | 0 (0.0%) | 0 (0.0%) |
| Total | 15 (100.0%) | 1 (100.0%) |
Household Vehicle Usage in Lookout
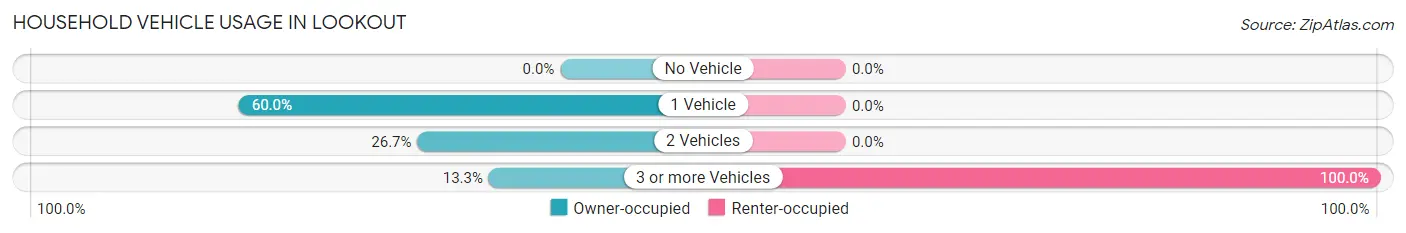
| Vehicles per Household | Owner-occupied | Renter-occupied |
| No Vehicle | 0 (0.0%) | 0 (0.0%) |
| 1 Vehicle | 9 (60.0%) | 0 (0.0%) |
| 2 Vehicles | 4 (26.7%) | 0 (0.0%) |
| 3 or more Vehicles | 2 (13.3%) | 1 (100.0%) |
| Total | 15 (100.0%) | 1 (100.0%) |
Real Estate & Mortgages in Lookout
Real Estate and Mortgage Overview in Lookout
| Characteristic | Without Mortgage | With Mortgage |
| Housing Units | 9 | 6 |
| Median Property Value | - | - |
| Median Household Income | - | - |
| Monthly Housing Costs | - | - |
| Real Estate Taxes | - | - |
Property Value by Mortgage Status in Lookout
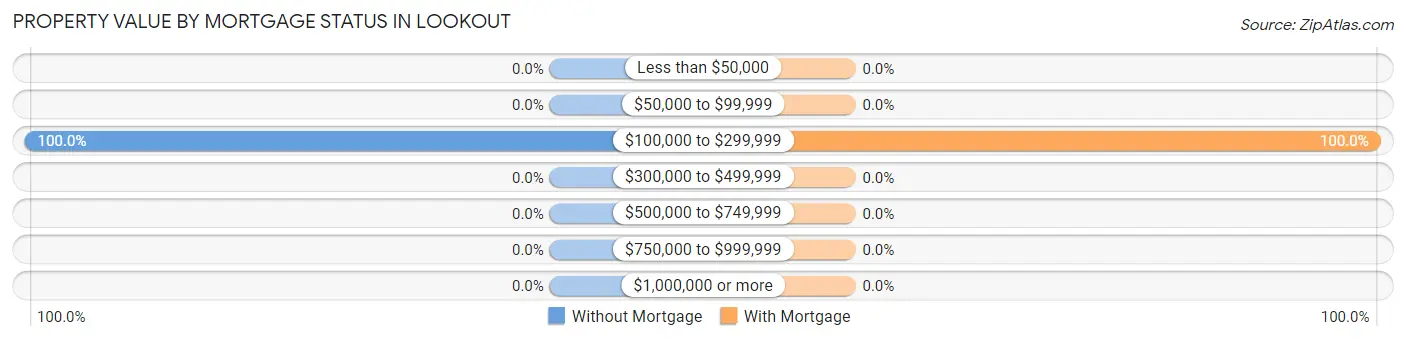
| Property Value | Without Mortgage | With Mortgage |
| Less than $50,000 | 0 (0.0%) | 0 (0.0%) |
| $50,000 to $99,999 | 0 (0.0%) | 0 (0.0%) |
| $100,000 to $299,999 | 9 (100.0%) | 6 (100.0%) |
| $300,000 to $499,999 | 0 (0.0%) | 0 (0.0%) |
| $500,000 to $749,999 | 0 (0.0%) | 0 (0.0%) |
| $750,000 to $999,999 | 0 (0.0%) | 0 (0.0%) |
| $1,000,000 or more | 0 (0.0%) | 0 (0.0%) |
| Total | 9 (100.0%) | 6 (100.0%) |
Household Income by Mortgage Status in Lookout
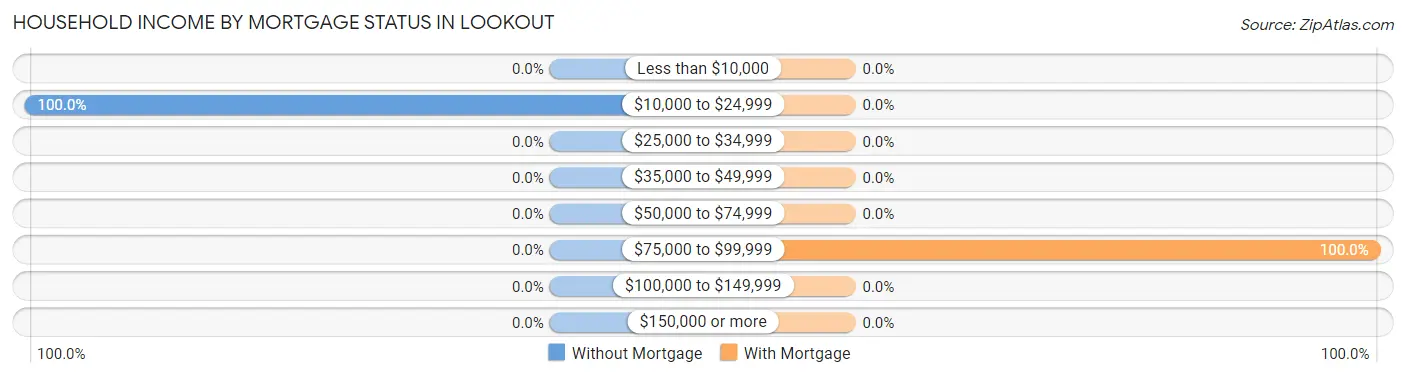
| Household Income | Without Mortgage | With Mortgage |
| Less than $10,000 | 0 (0.0%) | 0 (0.0%) |
| $10,000 to $24,999 | 9 (100.0%) | 0 (0.0%) |
| $25,000 to $34,999 | 0 (0.0%) | 0 (0.0%) |
| $35,000 to $49,999 | 0 (0.0%) | 0 (0.0%) |
| $50,000 to $74,999 | 0 (0.0%) | 0 (0.0%) |
| $75,000 to $99,999 | 0 (0.0%) | 6 (100.0%) |
| $100,000 to $149,999 | 0 (0.0%) | 0 (0.0%) |
| $150,000 or more | 0 (0.0%) | 0 (0.0%) |
| Total | 9 (100.0%) | 6 (100.0%) |
Property Value to Household Income Ratio in Lookout
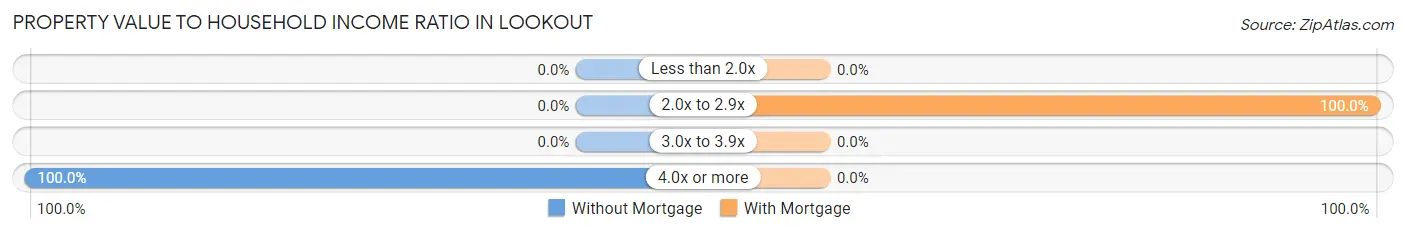
| Value-to-Income Ratio | Without Mortgage | With Mortgage |
| Less than 2.0x | 0 (0.0%) | 0 (0.0%) |
| 2.0x to 2.9x | 0 (0.0%) | 6 (100.0%) |
| 3.0x to 3.9x | 0 (0.0%) | 0 (0.0%) |
| 4.0x or more | 9 (100.0%) | 0 (0.0%) |
| Total | 9 (100.0%) | 6 (100.0%) |
Real Estate Taxes by Mortgage Status in Lookout
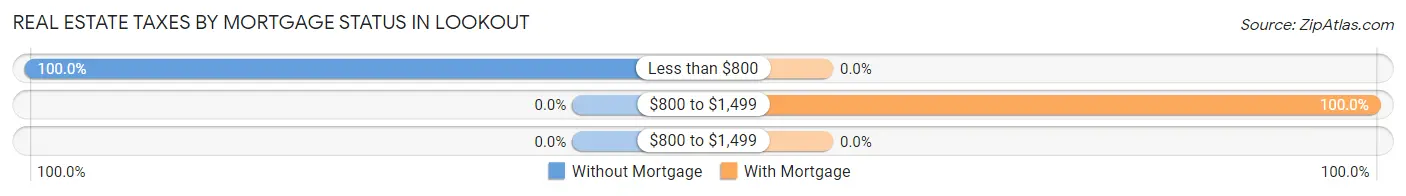
| Property Taxes | Without Mortgage | With Mortgage |
| Less than $800 | 9 (100.0%) | 0 (0.0%) |
| $800 to $1,499 | 0 (0.0%) | 6 (100.0%) |
| $800 to $1,499 | 0 (0.0%) | 0 (0.0%) |
| Total | 9 (100.0%) | 6 (100.0%) |
Health & Disability in Lookout
Health Insurance Coverage by Age in Lookout
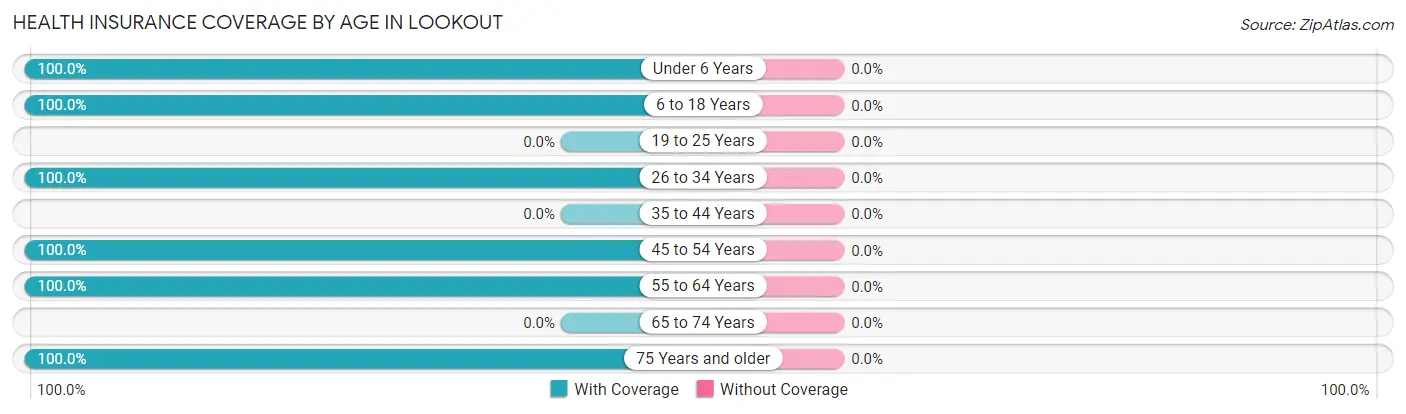
| Age Bracket | With Coverage | Without Coverage |
| Under 6 Years | 4 (100.0%) | 0 (0.0%) |
| 6 to 18 Years | 9 (100.0%) | 0 (0.0%) |
| 19 to 25 Years | 0 (0.0%) | 0 (0.0%) |
| 26 to 34 Years | 5 (100.0%) | 0 (0.0%) |
| 35 to 44 Years | 0 (0.0%) | 0 (0.0%) |
| 45 to 54 Years | 4 (100.0%) | 0 (0.0%) |
| 55 to 64 Years | 9 (100.0%) | 0 (0.0%) |
| 65 to 74 Years | 0 (0.0%) | 0 (0.0%) |
| 75 Years and older | 6 (100.0%) | 0 (0.0%) |
| Total | 37 (100.0%) | 0 (0.0%) |
Health Insurance Coverage by Citizenship Status in Lookout
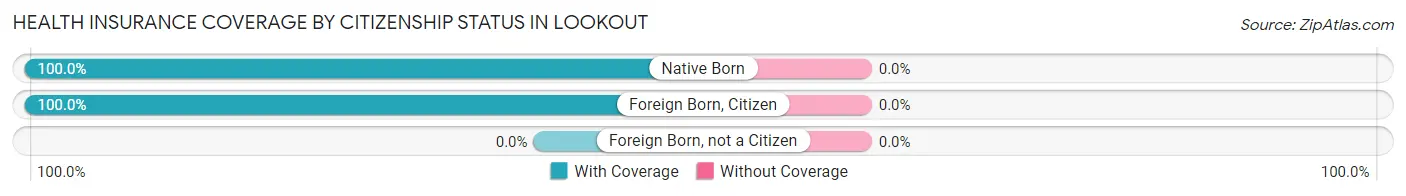
| Citizenship Status | With Coverage | Without Coverage |
| Native Born | 4 (100.0%) | 0 (0.0%) |
| Foreign Born, Citizen | 9 (100.0%) | 0 (0.0%) |
| Foreign Born, not a Citizen | 0 (0.0%) | 0 (0.0%) |
Health Insurance Coverage by Household Income in Lookout
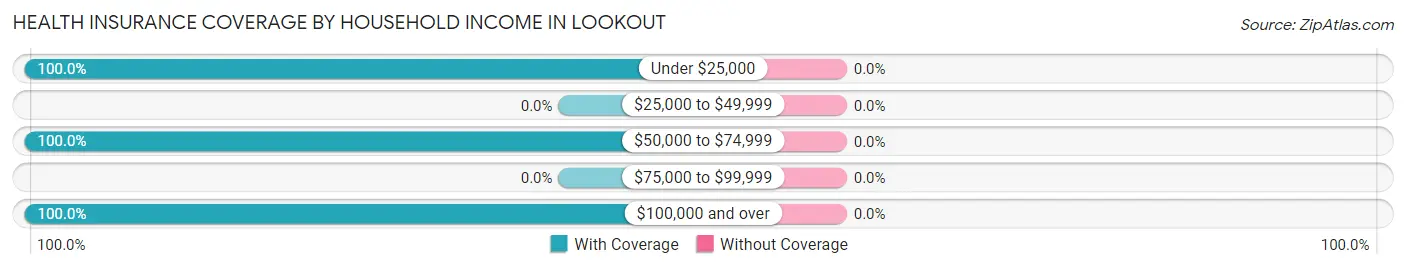
| Household Income | With Coverage | Without Coverage |
| Under $25,000 | 9 (100.0%) | 0 (0.0%) |
| $25,000 to $49,999 | 0 (0.0%) | 0 (0.0%) |
| $50,000 to $74,999 | 10 (100.0%) | 0 (0.0%) |
| $75,000 to $99,999 | 0 (0.0%) | 0 (0.0%) |
| $100,000 and over | 18 (100.0%) | 0 (0.0%) |
Public vs Private Health Insurance Coverage by Age in Lookout
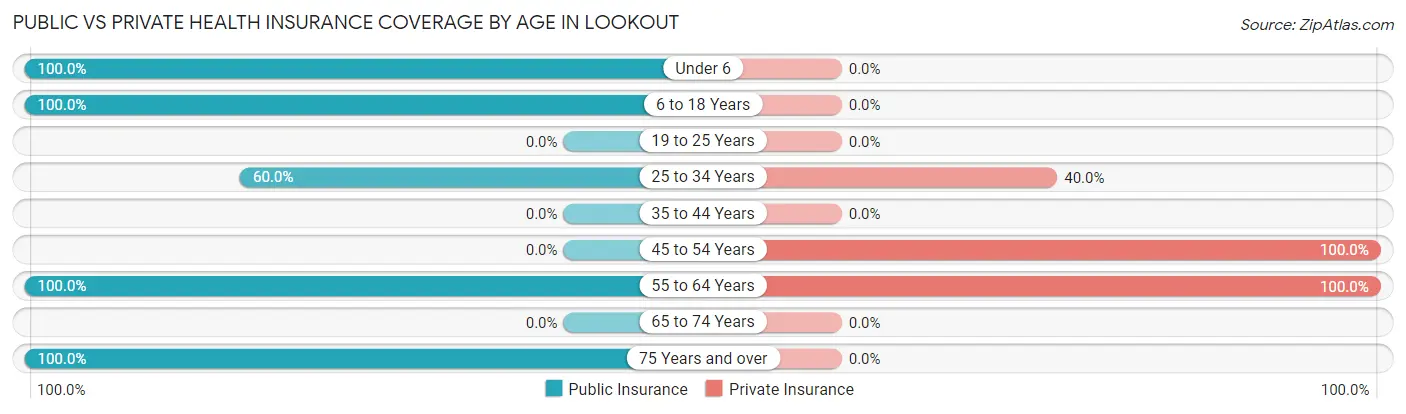
| Age Bracket | Public Insurance | Private Insurance |
| Under 6 | 4 (100.0%) | 0 (0.0%) |
| 6 to 18 Years | 9 (100.0%) | 0 (0.0%) |
| 19 to 25 Years | 0 (0.0%) | 0 (0.0%) |
| 25 to 34 Years | 3 (60.0%) | 2 (40.0%) |
| 35 to 44 Years | 0 (0.0%) | 0 (0.0%) |
| 45 to 54 Years | 0 (0.0%) | 4 (100.0%) |
| 55 to 64 Years | 9 (100.0%) | 9 (100.0%) |
| 65 to 74 Years | 0 (0.0%) | 0 (0.0%) |
| 75 Years and over | 6 (100.0%) | 0 (0.0%) |
| Total | 31 (83.8%) | 15 (40.5%) |
Disability Status by Sex by Age in Lookout
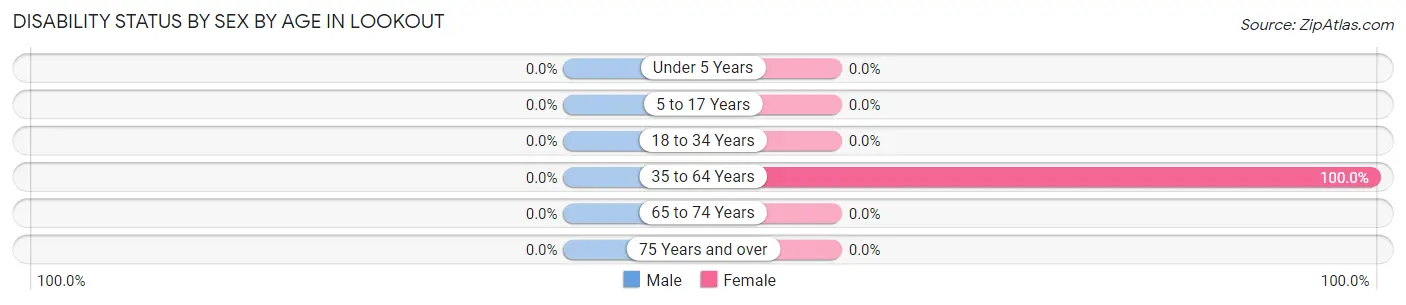
| Age Bracket | Male | Female |
| Under 5 Years | 0 (0.0%) | 0 (0.0%) |
| 5 to 17 Years | 0 (0.0%) | 0 (0.0%) |
| 18 to 34 Years | 0 (0.0%) | 0 (0.0%) |
| 35 to 64 Years | 0 (0.0%) | 9 (100.0%) |
| 65 to 74 Years | 0 (0.0%) | 0 (0.0%) |
| 75 Years and over | 0 (0.0%) | 0 (0.0%) |
Disability Class by Sex by Age in Lookout
Disability Class: Hearing Difficulty
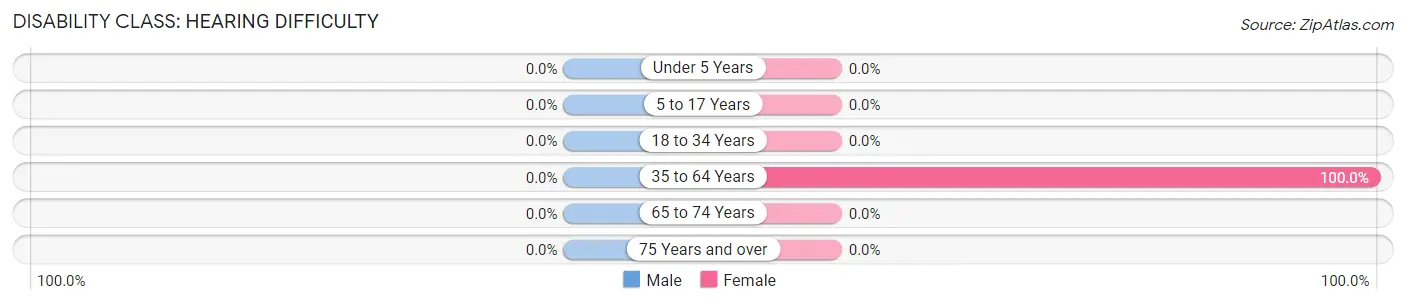
| Age Bracket | Male | Female |
| Under 5 Years | 0 (0.0%) | 0 (0.0%) |
| 5 to 17 Years | 0 (0.0%) | 0 (0.0%) |
| 18 to 34 Years | 0 (0.0%) | 0 (0.0%) |
| 35 to 64 Years | 0 (0.0%) | 9 (100.0%) |
| 65 to 74 Years | 0 (0.0%) | 0 (0.0%) |
| 75 Years and over | 0 (0.0%) | 0 (0.0%) |
Disability Class: Vision Difficulty
| Age Bracket | Male | Female |
| Under 5 Years | 0 (0.0%) | 0 (0.0%) |
| 5 to 17 Years | 0 (0.0%) | 0 (0.0%) |
| 18 to 34 Years | 0 (0.0%) | 0 (0.0%) |
| 35 to 64 Years | 0 (0.0%) | 0 (0.0%) |
| 65 to 74 Years | 0 (0.0%) | 0 (0.0%) |
| 75 Years and over | 0 (0.0%) | 0 (0.0%) |
Disability Class: Cognitive Difficulty
| Age Bracket | Male | Female |
| 5 to 17 Years | 0 (0.0%) | 0 (0.0%) |
| 18 to 34 Years | 0 (0.0%) | 0 (0.0%) |
| 35 to 64 Years | 0 (0.0%) | 0 (0.0%) |
| 65 to 74 Years | 0 (0.0%) | 0 (0.0%) |
| 75 Years and over | 0 (0.0%) | 0 (0.0%) |
Disability Class: Ambulatory Difficulty
| Age Bracket | Male | Female |
| 5 to 17 Years | 0 (0.0%) | 0 (0.0%) |
| 18 to 34 Years | 0 (0.0%) | 0 (0.0%) |
| 35 to 64 Years | 0 (0.0%) | 9 (100.0%) |
| 65 to 74 Years | 0 (0.0%) | 0 (0.0%) |
| 75 Years and over | 0 (0.0%) | 0 (0.0%) |
Disability Class: Self-Care Difficulty
| Age Bracket | Male | Female |
| 5 to 17 Years | 0 (0.0%) | 0 (0.0%) |
| 18 to 34 Years | 0 (0.0%) | 0 (0.0%) |
| 35 to 64 Years | 0 (0.0%) | 0 (0.0%) |
| 65 to 74 Years | 0 (0.0%) | 0 (0.0%) |
| 75 Years and over | 0 (0.0%) | 0 (0.0%) |
Technology Access in Lookout
Computing Device Access in Lookout
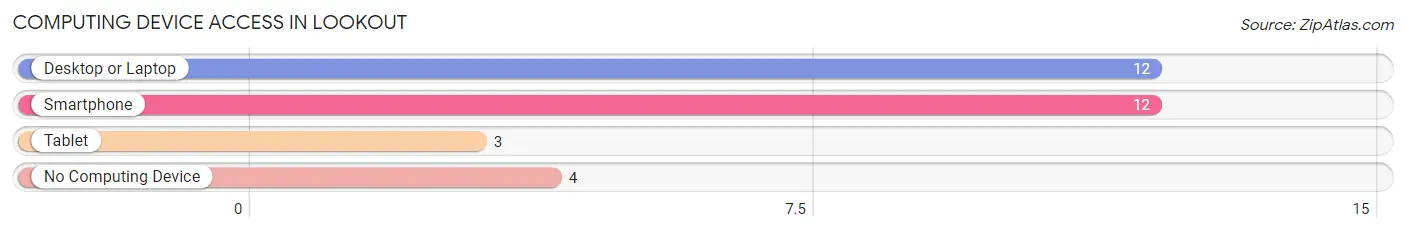
| Device Type | # Households | % Households |
| Desktop or Laptop | 12 | 75.0% |
| Smartphone | 12 | 75.0% |
| Tablet | 3 | 18.8% |
| No Computing Device | 4 | 25.0% |
| Total | 16 | 100.0% |
Internet Access in Lookout
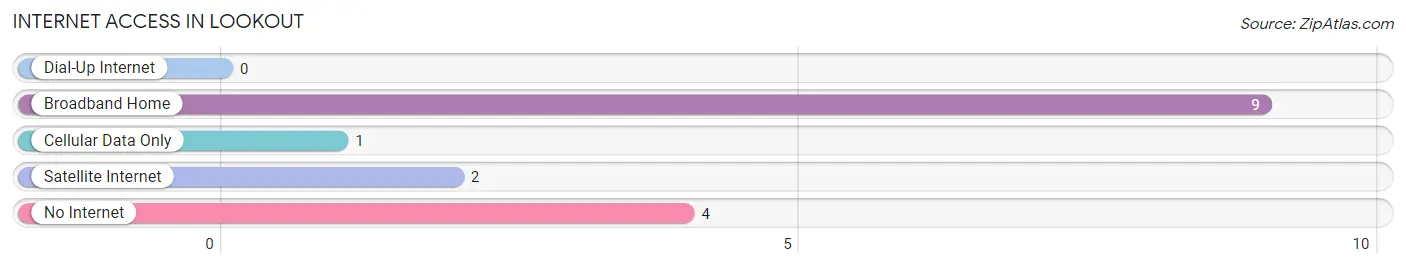
| Internet Type | # Households | % Households |
| Dial-Up Internet | 0 | 0.0% |
| Broadband Home | 9 | 56.2% |
| Cellular Data Only | 1 | 6.2% |
| Satellite Internet | 2 | 12.5% |
| No Internet | 4 | 25.0% |
| Total | 16 | 100.0% |
Lookout Summary
Lookout, California is a small unincorporated community located in the Sierra Nevada foothills of El Dorado County. It is situated in the western part of the county, approximately 25 miles east of Placerville and 40 miles northeast of Sacramento. The community is located in a rural area, surrounded by rolling hills and forests. The population of Lookout was estimated to be around 200 people in 2000.
History
Lookout was first settled in the late 1800s by miners and loggers who were attracted to the area by the abundance of timber and gold. The town was originally known as “Lookout Station” and was a stop on the stagecoach line that ran between Placerville and Sacramento. In the early 1900s, the town was renamed “Lookout” and became a popular destination for tourists and vacationers.
The town was incorporated in 1912 and the first post office was established in 1913. The town was home to a number of businesses, including a general store, a hotel, a saloon, and a blacksmith shop. The town also had a school, which was built in 1914 and served the local community until it closed in the 1950s.
Geography
Lookout is located in the Sierra Nevada foothills of El Dorado County. It is situated in the western part of the county, approximately 25 miles east of Placerville and 40 miles northeast of Sacramento. The community is located in a rural area, surrounded by rolling hills and forests. The elevation of Lookout is approximately 2,000 feet above sea level.
The climate in Lookout is generally mild, with hot summers and cool winters. The average high temperature in the summer is around 90 degrees Fahrenheit, while the average low temperature in the winter is around 30 degrees Fahrenheit. The area receives an average of 20 inches of precipitation per year, with most of it falling in the winter months.
Economy
The economy of Lookout is largely based on tourism and recreation. The town is home to a number of bed and breakfasts, as well as a few restaurants and shops. The nearby El Dorado National Forest provides a variety of recreational activities, including camping, hiking, fishing, and hunting.
The town is also home to a number of small businesses, including a general store, a gas station, and a hardware store. The town is also home to a number of artists and craftspeople, who sell their wares at local markets and festivals.
Demographics
The population of Lookout was estimated to be around 200 people in 2000. The racial makeup of the town was 97.5% White, 0.5% African American, 0.5% Native American, 0.5% Asian, and 1% from other races. The median household income in Lookout was $37,500 in 2000. The median age of the population was 44 years old.
Lookout is a small, rural community with a strong sense of community and a rich history. The town is home to a variety of businesses and recreational activities, making it an attractive destination for tourists and vacationers. The town is also home to a number of artists and craftspeople, who contribute to the local economy and culture.
Common Questions
What is Per Capita Income in Lookout?
Per Capita income in Lookout is $22,173.
What is Inequality or Gini Index in Lookout?
Inequality or Gini Index in Lookout is 0.28.
What is the Total Population of Lookout?
Total Population of Lookout is 37.
What is the Total Male Population of Lookout?
Total Male Population of Lookout is 18.
What is the Total Female Population of Lookout?
Total Female Population of Lookout is 19.
What is the Ratio of Males per 100 Females in Lookout?
There are 94.74 Males per 100 Females in Lookout.
What is the Ratio of Females per 100 Males in Lookout?
There are 105.56 Females per 100 Males in Lookout.
What is the Median Population Age in Lookout?
Median Population Age in Lookout is 49.1 Years.
What is the Average Family Size in Lookout
Average Family Size in Lookout is 7.3 People.
What is the Average Household Size in Lookout
Average Household Size in Lookout is 2.3 People.
How Large is the Labor Force in Lookout?
There are 9 People in the Labor Forcein in Lookout.
What is the Percentage of People in the Labor Force in Lookout?
37.5% of People are in the Labor Force in Lookout.