Cities with the Highest Poverty Level Among Seniors Over the Age of 65 in California
RELATED REPORTS & OPTIONS
Highest Poverty | Seniors 65+
California
Compare Cities
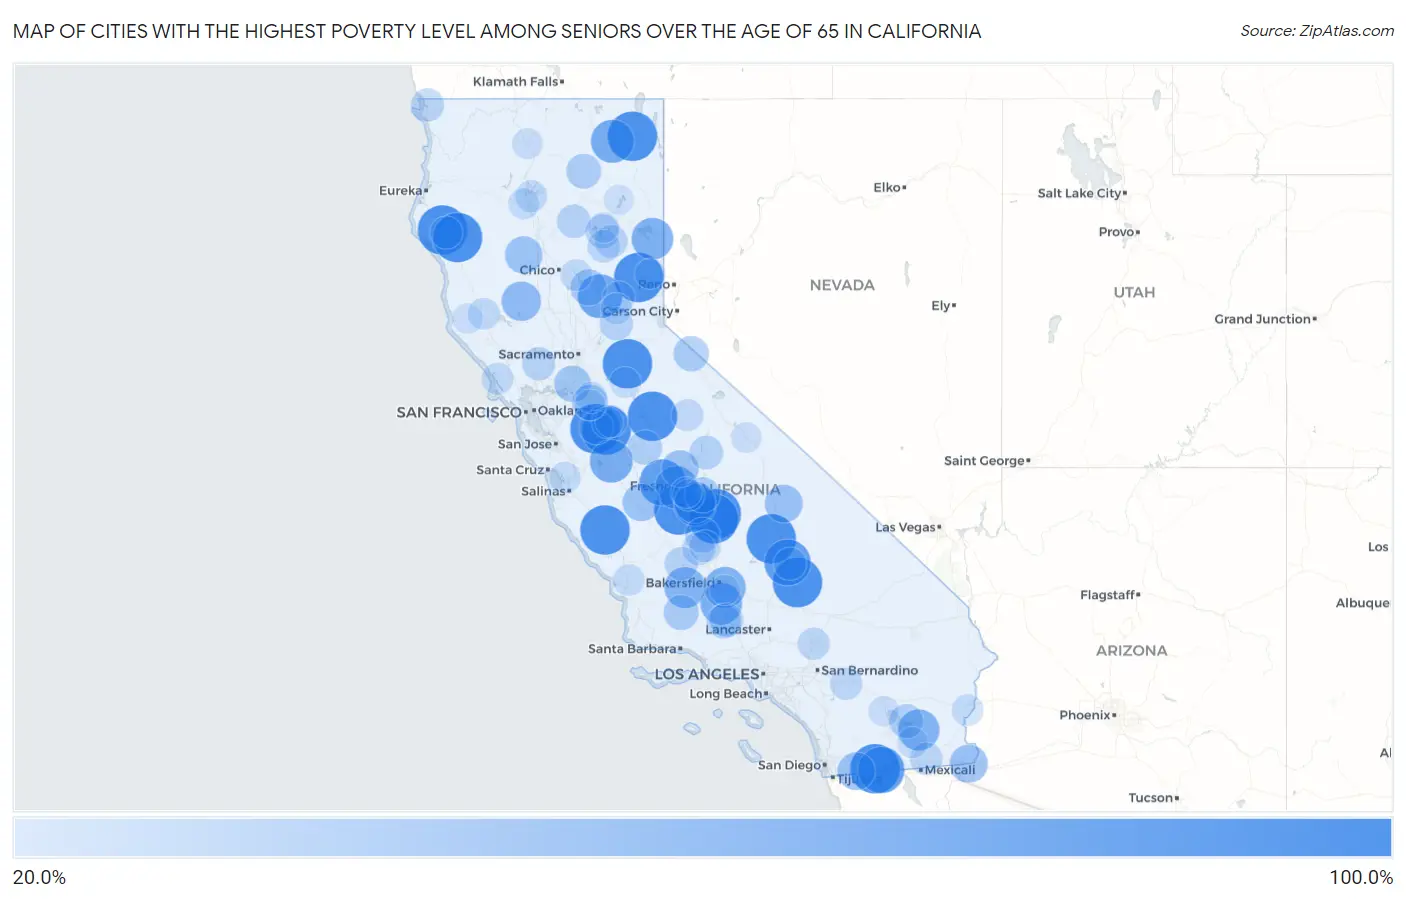
Map of Cities with the Highest Poverty Level Among Seniors Over the Age of 65 in California
0.0%
100.0%
Cities with the Highest Poverty Level Among Seniors Over the Age of 65 in California
| City | Senior Poverty | vs State | vs National | |
| 1. | Westley | 100.0% | 11.0%(+89.0)#1 | 10.0%(+90.0)#18 |
| 2. | San Lucas | 100.0% | 11.0%(+89.0)#2 | 10.0%(+90.0)#37 |
| 3. | Boulevard | 100.0% | 11.0%(+89.0)#3 | 10.0%(+90.0)#40 |
| 4. | Lindcove | 100.0% | 11.0%(+89.0)#4 | 10.0%(+90.0)#60 |
| 5. | Myers Flat | 100.0% | 11.0%(+89.0)#5 | 10.0%(+90.0)#68 |
| 6. | Daphnedale Park | 100.0% | 11.0%(+89.0)#6 | 10.0%(+90.0)#80 |
| 7. | Hardwick | 100.0% | 11.0%(+89.0)#7 | 10.0%(+90.0)#87 |
| 8. | Monterey Park Tract | 100.0% | 11.0%(+89.0)#8 | 10.0%(+90.0)#95 |
| 9. | Johannesburg | 100.0% | 11.0%(+89.0)#9 | 10.0%(+90.0)#120 |
| 10. | Kennedy Meadows | 100.0% | 11.0%(+89.0)#10 | 10.0%(+90.0)#121 |
| 11. | Alderpoint | 100.0% | 11.0%(+89.0)#11 | 10.0%(+90.0)#123 |
| 12. | Strawberry Cdp Tuolumne County | 100.0% | 11.0%(+89.0)#12 | 10.0%(+90.0)#142 |
| 13. | Volcano | 100.0% | 11.0%(+89.0)#13 | 10.0%(+90.0)#147 |
| 14. | Tooleville | 100.0% | 11.0%(+89.0)#14 | 10.0%(+90.0)#161 |
| 15. | Sattley | 100.0% | 11.0%(+89.0)#15 | 10.0%(+90.0)#188 |
| 16. | Coulterville | 100.0% | 11.0%(+89.0)#16 | 10.0%(+90.0)#190 |
| 17. | Jacumba | 88.3% | 11.0%(+77.3)#17 | 10.0%(+78.3)#235 |
| 18. | Biola | 88.1% | 11.0%(+77.1)#18 | 10.0%(+78.1)#236 |
| 19. | Inyokern | 87.8% | 11.0%(+76.8)#19 | 10.0%(+77.9)#238 |
| 20. | North San Juan | 80.0% | 11.0%(+69.0)#20 | 10.0%(+70.0)#277 |
| 21. | Canby | 76.5% | 11.0%(+65.4)#21 | 10.0%(+66.5)#305 |
| 22. | Volta | 75.4% | 11.0%(+64.4)#22 | 10.0%(+65.5)#311 |
| 23. | Calwa | 74.7% | 11.0%(+63.7)#23 | 10.0%(+64.8)#319 |
| 24. | London | 71.6% | 11.0%(+60.6)#24 | 10.0%(+61.7)#343 |
| 25. | Patton Village | 71.4% | 11.0%(+60.4)#25 | 10.0%(+61.5)#345 |
| 26. | Mettler | 71.4% | 11.0%(+60.4)#26 | 10.0%(+61.5)#347 |
| 27. | Fuller Acres | 69.9% | 11.0%(+58.9)#27 | 10.0%(+59.9)#365 |
| 28. | Niland | 69.7% | 11.0%(+58.7)#28 | 10.0%(+59.7)#368 |
| 29. | Delft Colony | 69.2% | 11.0%(+58.2)#29 | 10.0%(+59.3)#374 |
| 30. | Mckittrick | 68.8% | 11.0%(+57.7)#30 | 10.0%(+58.8)#379 |
| 31. | Pumpkin Center | 68.4% | 11.0%(+57.4)#31 | 10.0%(+58.5)#381 |
| 32. | Dales | 67.1% | 11.0%(+56.1)#32 | 10.0%(+57.1)#402 |
| 33. | Lodoga | 62.7% | 11.0%(+51.6)#33 | 10.0%(+52.7)#470 |
| 34. | Winterhaven | 57.6% | 11.0%(+46.6)#34 | 10.0%(+47.6)#546 |
| 35. | Keeler | 57.1% | 11.0%(+46.1)#35 | 10.0%(+47.2)#562 |
| 36. | Potrero | 56.5% | 11.0%(+45.5)#36 | 10.0%(+46.6)#574 |
| 37. | Three Rocks | 55.7% | 11.0%(+44.7)#37 | 10.0%(+45.8)#595 |
| 38. | Flournoy | 55.6% | 11.0%(+44.5)#38 | 10.0%(+45.6)#602 |
| 39. | Salyer | 55.0% | 11.0%(+43.9)#39 | 10.0%(+45.0)#615 |
| 40. | Friant | 54.1% | 11.0%(+43.1)#40 | 10.0%(+44.1)#638 |
| 41. | Knights Ferry | 53.8% | 11.0%(+42.8)#41 | 10.0%(+43.9)#642 |
| 42. | Isleton | 51.8% | 11.0%(+40.8)#42 | 10.0%(+41.9)#698 |
| 43. | Robinson Mill | 51.4% | 11.0%(+40.3)#43 | 10.0%(+41.4)#714 |
| 44. | Taft Mosswood | 50.3% | 11.0%(+39.2)#44 | 10.0%(+40.3)#734 |
| 45. | Coleville | 48.0% | 11.0%(+37.0)#45 | 10.0%(+38.0)#857 |
| 46. | Orange Cove | 47.9% | 11.0%(+36.9)#46 | 10.0%(+38.0)#859 |
| 47. | New Cuyama | 47.4% | 11.0%(+36.4)#47 | 10.0%(+37.5)#879 |
| 48. | Tipton | 46.5% | 11.0%(+35.5)#48 | 10.0%(+36.6)#917 |
| 49. | Mcarthur | 46.3% | 11.0%(+35.3)#49 | 10.0%(+36.3)#925 |
| 50. | Planada | 44.8% | 11.0%(+33.7)#50 | 10.0%(+34.8)#986 |
| 51. | Frazier Park | 44.6% | 11.0%(+33.6)#51 | 10.0%(+34.6)#993 |
| 52. | Bombay Beach | 43.9% | 11.0%(+32.9)#52 | 10.0%(+34.0)#1,023 |
| 53. | Lebec | 43.4% | 11.0%(+32.4)#53 | 10.0%(+33.4)#1,060 |
| 54. | Wautec | 42.9% | 11.0%(+31.8)#54 | 10.0%(+32.9)#1,088 |
| 55. | Grayson | 42.7% | 11.0%(+31.7)#55 | 10.0%(+32.7)#1,093 |
| 56. | Big Creek | 42.3% | 11.0%(+31.3)#56 | 10.0%(+32.4)#1,107 |
| 57. | East Shore | 42.2% | 11.0%(+31.2)#57 | 10.0%(+32.3)#1,111 |
| 58. | Mineral | 42.1% | 11.0%(+31.1)#58 | 10.0%(+32.2)#1,120 |
| 59. | Foresthill | 41.3% | 11.0%(+30.3)#59 | 10.0%(+31.3)#1,162 |
| 60. | Lost Hills | 41.2% | 11.0%(+30.2)#60 | 10.0%(+31.2)#1,169 |
| 61. | Smith River | 40.3% | 11.0%(+29.3)#61 | 10.0%(+30.3)#1,220 |
| 62. | Allensworth | 40.0% | 11.0%(+29.0)#62 | 10.0%(+30.0)#1,236 |
| 63. | Moskowite Corner | 40.0% | 11.0%(+29.0)#63 | 10.0%(+30.0)#1,241 |
| 64. | Crescent Mills | 39.4% | 11.0%(+28.4)#64 | 10.0%(+29.4)#1,292 |
| 65. | Holtville | 38.5% | 11.0%(+27.5)#65 | 10.0%(+28.6)#1,345 |
| 66. | Twain | 37.9% | 11.0%(+26.9)#66 | 10.0%(+28.0)#1,380 |
| 67. | Miranda | 37.8% | 11.0%(+26.8)#67 | 10.0%(+27.8)#1,393 |
| 68. | China Lake Acres | 37.7% | 11.0%(+26.7)#68 | 10.0%(+27.8)#1,396 |
| 69. | Washington | 37.1% | 11.0%(+26.1)#69 | 10.0%(+27.2)#1,444 |
| 70. | Mountain View Acres | 37.0% | 11.0%(+26.0)#70 | 10.0%(+27.1)#1,456 |
| 71. | Cabazon | 36.4% | 11.0%(+25.4)#71 | 10.0%(+26.5)#1,503 |
| 72. | Earlimart | 36.3% | 11.0%(+25.3)#72 | 10.0%(+26.4)#1,520 |
| 73. | Tomales | 36.1% | 11.0%(+25.1)#73 | 10.0%(+26.2)#1,533 |
| 74. | Yosemite Valley | 36.0% | 11.0%(+25.0)#74 | 10.0%(+26.1)#1,540 |
| 75. | Empire | 36.0% | 11.0%(+25.0)#75 | 10.0%(+26.1)#1,542 |
| 76. | Mountain Gate | 35.8% | 11.0%(+24.8)#76 | 10.0%(+25.8)#1,566 |
| 77. | Cherokee | 35.6% | 11.0%(+24.6)#77 | 10.0%(+25.6)#1,592 |
| 78. | Talmage | 35.5% | 11.0%(+24.5)#78 | 10.0%(+25.5)#1,598 |
| 79. | August | 35.2% | 11.0%(+24.2)#79 | 10.0%(+25.2)#1,625 |
| 80. | Garden Farms | 34.5% | 11.0%(+23.5)#80 | 10.0%(+24.6)#1,671 |
| 81. | Dutch Flat | 34.5% | 11.0%(+23.5)#81 | 10.0%(+24.5)#1,675 |
| 82. | Las Lomas | 34.4% | 11.0%(+23.4)#82 | 10.0%(+24.5)#1,685 |
| 83. | Ripley | 34.2% | 11.0%(+23.1)#83 | 10.0%(+24.2)#1,705 |
| 84. | Parlier | 33.9% | 11.0%(+22.8)#84 | 10.0%(+23.9)#1,719 |
| 85. | Airport | 33.7% | 11.0%(+22.7)#85 | 10.0%(+23.8)#1,729 |
| 86. | Castella | 33.3% | 11.0%(+22.3)#86 | 10.0%(+23.4)#1,779 |
| 87. | Keswick | 33.3% | 11.0%(+22.3)#87 | 10.0%(+23.4)#1,797 |
| 88. | Westmorland | 33.2% | 11.0%(+22.2)#88 | 10.0%(+23.3)#1,842 |
| 89. | East Bakersfield | 32.7% | 11.0%(+21.7)#89 | 10.0%(+22.8)#1,868 |
| 90. | French Camp | 32.7% | 11.0%(+21.7)#90 | 10.0%(+22.7)#1,870 |
| 91. | San Andreas | 32.6% | 11.0%(+21.6)#91 | 10.0%(+22.6)#1,877 |
| 92. | Weed | 32.1% | 11.0%(+21.1)#92 | 10.0%(+22.2)#1,925 |
| 93. | Del Rey | 32.0% | 11.0%(+21.0)#93 | 10.0%(+22.1)#1,932 |
| 94. | Oasis | 31.7% | 11.0%(+20.7)#94 | 10.0%(+21.8)#1,979 |
| 95. | Mesa | 31.6% | 11.0%(+20.6)#95 | 10.0%(+21.7)#1,990 |
| 96. | Clear Creek | 31.6% | 11.0%(+20.6)#96 | 10.0%(+21.6)#2,001 |
| 97. | Philo | 31.2% | 11.0%(+20.2)#97 | 10.0%(+21.3)#2,050 |
| 98. | Lamont | 30.4% | 11.0%(+19.4)#98 | 10.0%(+20.5)#2,143 |
| 99. | Loyalton | 30.2% | 11.0%(+19.2)#99 | 10.0%(+20.3)#2,170 |
| 100. | Spaulding | 30.0% | 11.0%(+19.0)#100 | 10.0%(+20.0)#2,198 |
Common Questions
What are the Top 10 Cities with the Highest Poverty Level Among Seniors Over the Age of 65 in California?
Top 10 Cities with the Highest Poverty Level Among Seniors Over the Age of 65 in California are:
#1
100.0%
#2
100.0%
#3
100.0%
#4
100.0%
#5
100.0%
#6
100.0%
#7
100.0%
#8
100.0%
#9
100.0%
#10
100.0%
What city has the Highest Poverty Level Among Seniors Over the Age of 65 in California?
Westley has the Highest Poverty Level Among Seniors Over the Age of 65 in California with 100.0%.
What is the Poverty Level Among Seniors Over the Age of 65 in the State of California?
Poverty Level Among Seniors Over the Age of 65 in California is 11.0%.
What is the Poverty Level Among Seniors Over the Age of 65 in the United States?
Poverty Level Among Seniors Over the Age of 65 in the United States is 10.0%.