Cities with the Highest Percentage of Nigerian Population in California
RELATED REPORTS & OPTIONS
Nigerian
California
Compare Cities
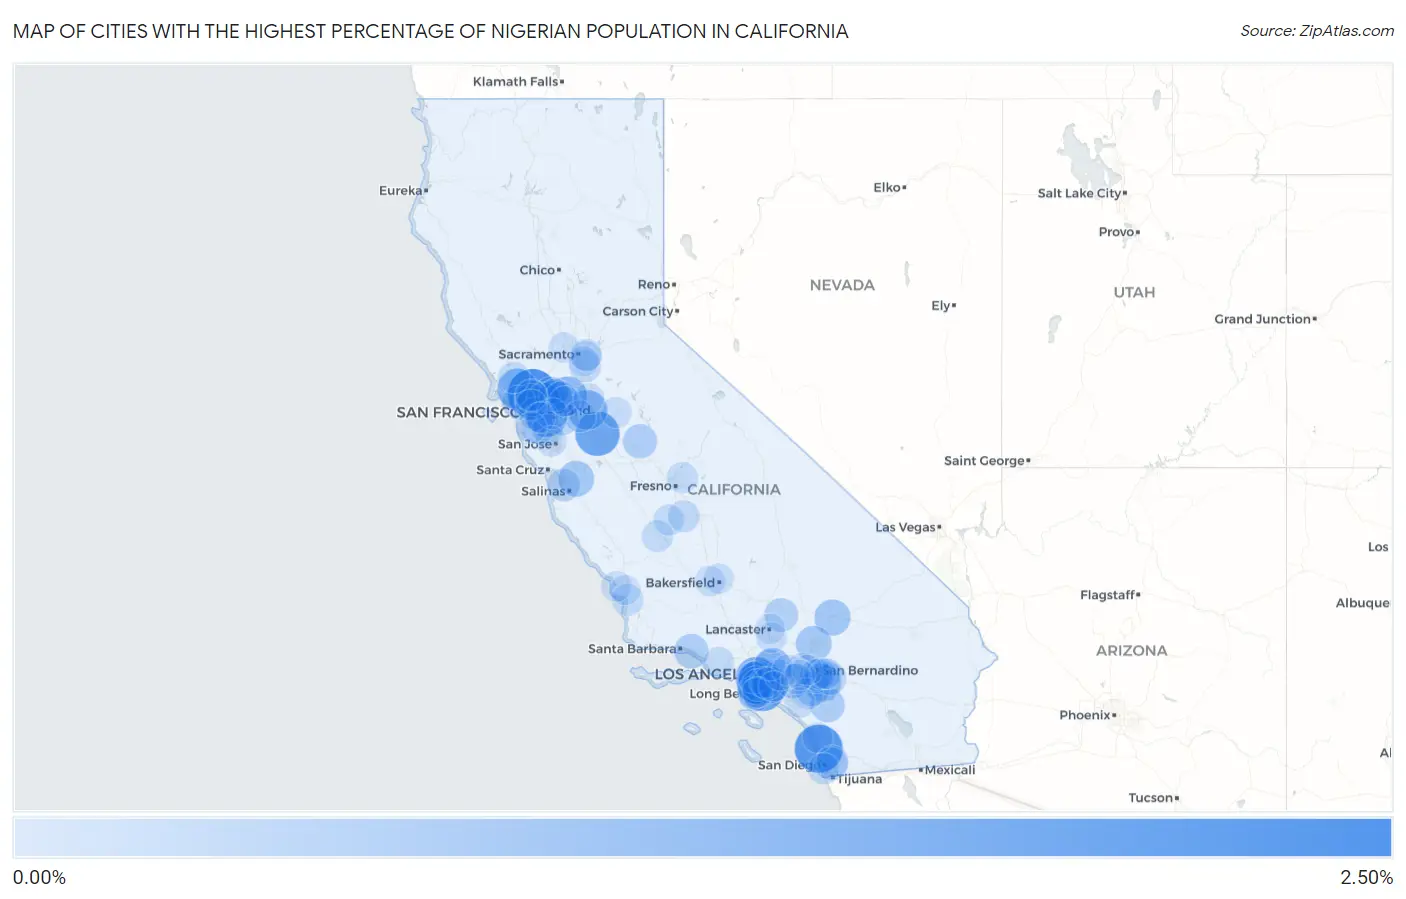
Map of Cities with the Highest Percentage of Nigerian Population in California
0.00%
2.50%
Cities with the Highest Percentage of Nigerian Population in California
| City | Nigerian | vs State | vs National | |
| 1. | Hercules | 2.32% | 0.13%(+2.18)#1 | 0.18%(+2.14)#124 |
| 2. | Del Mar | 2.15% | 0.13%(+2.01)#2 | 0.18%(+1.97)#136 |
| 3. | West Athens | 1.87% | 0.13%(+1.74)#3 | 0.18%(+1.70)#161 |
| 4. | Carson | 1.78% | 0.13%(+1.65)#4 | 0.18%(+1.61)#175 |
| 5. | Patterson | 1.74% | 0.13%(+1.61)#5 | 0.18%(+1.57)#181 |
| 6. | Castro Valley | 1.43% | 0.13%(+1.29)#6 | 0.18%(+1.25)#231 |
| 7. | Hawthorne | 1.42% | 0.13%(+1.29)#7 | 0.18%(+1.25)#233 |
| 8. | Ladera Heights | 1.39% | 0.13%(+1.25)#8 | 0.18%(+1.21)#248 |
| 9. | Novato | 1.29% | 0.13%(+1.15)#9 | 0.18%(+1.11)#272 |
| 10. | Lathrop | 1.22% | 0.13%(+1.09)#10 | 0.18%(+1.05)#292 |
| 11. | Gardena | 1.22% | 0.13%(+1.09)#11 | 0.18%(+1.04)#293 |
| 12. | Oakley | 1.20% | 0.13%(+1.06)#12 | 0.18%(+1.02)#299 |
| 13. | Contra Costa Centre | 1.19% | 0.13%(+1.06)#13 | 0.18%(+1.02)#304 |
| 14. | Clayton | 1.16% | 0.13%(+1.02)#14 | 0.18%(+0.981)#316 |
| 15. | East Pasadena | 1.11% | 0.13%(+0.980)#15 | 0.18%(+0.939)#330 |
| 16. | Inglewood | 1.07% | 0.13%(+0.939)#16 | 0.18%(+0.898)#342 |
| 17. | Lawndale | 1.03% | 0.13%(+0.892)#17 | 0.18%(+0.851)#359 |
| 18. | Moreno Valley | 0.96% | 0.13%(+0.825)#18 | 0.18%(+0.784)#400 |
| 19. | Bellflower | 0.93% | 0.13%(+0.798)#19 | 0.18%(+0.757)#412 |
| 20. | Barstow | 0.84% | 0.13%(+0.701)#20 | 0.18%(+0.660)#462 |
| 21. | Mountain View Acres | 0.81% | 0.13%(+0.675)#21 | 0.18%(+0.634)#475 |
| 22. | San Juan Bautista | 0.81% | 0.13%(+0.675)#22 | 0.18%(+0.634)#477 |
| 23. | French Valley | 0.68% | 0.13%(+0.547)#23 | 0.18%(+0.506)#562 |
| 24. | Lake Mathews | 0.66% | 0.13%(+0.527)#24 | 0.18%(+0.486)#578 |
| 25. | Carpinteria | 0.66% | 0.13%(+0.525)#25 | 0.18%(+0.484)#579 |
| 26. | East Bakersfield | 0.65% | 0.13%(+0.516)#26 | 0.18%(+0.475)#588 |
| 27. | University Of California Merced | 0.65% | 0.13%(+0.514)#27 | 0.18%(+0.473)#590 |
| 28. | Chino Hills | 0.63% | 0.13%(+0.499)#28 | 0.18%(+0.458)#609 |
| 29. | Reliez Valley | 0.63% | 0.13%(+0.492)#29 | 0.18%(+0.451)#622 |
| 30. | Bay Point | 0.62% | 0.13%(+0.484)#30 | 0.18%(+0.443)#630 |
| 31. | Mill Valley | 0.61% | 0.13%(+0.478)#31 | 0.18%(+0.437)#635 |
| 32. | Edwards Afb | 0.59% | 0.13%(+0.459)#32 | 0.18%(+0.418)#667 |
| 33. | Oakland | 0.57% | 0.13%(+0.439)#33 | 0.18%(+0.398)#697 |
| 34. | Highgrove | 0.57% | 0.13%(+0.431)#34 | 0.18%(+0.390)#711 |
| 35. | Lemon Grove | 0.51% | 0.13%(+0.375)#35 | 0.18%(+0.334)#777 |
| 36. | Livermore | 0.50% | 0.13%(+0.367)#36 | 0.18%(+0.326)#788 |
| 37. | Castroville | 0.50% | 0.13%(+0.364)#37 | 0.18%(+0.323)#795 |
| 38. | Foster City | 0.49% | 0.13%(+0.356)#38 | 0.18%(+0.315)#807 |
| 39. | Rancho Palos Verdes | 0.48% | 0.13%(+0.346)#39 | 0.18%(+0.305)#820 |
| 40. | Palos Verdes Estates | 0.46% | 0.13%(+0.327)#40 | 0.18%(+0.286)#839 |
| 41. | East Richmond Heights | 0.46% | 0.13%(+0.322)#41 | 0.18%(+0.281)#853 |
| 42. | Pittsburg | 0.45% | 0.13%(+0.317)#42 | 0.18%(+0.276)#861 |
| 43. | Calimesa | 0.44% | 0.13%(+0.309)#43 | 0.18%(+0.268)#879 |
| 44. | Antioch | 0.43% | 0.13%(+0.297)#44 | 0.18%(+0.256)#903 |
| 45. | Montalvin Manor | 0.41% | 0.13%(+0.275)#45 | 0.18%(+0.234)#941 |
| 46. | Elk Grove | 0.40% | 0.13%(+0.270)#46 | 0.18%(+0.229)#954 |
| 47. | Tracy | 0.39% | 0.13%(+0.260)#47 | 0.18%(+0.219)#969 |
| 48. | Culver City | 0.39% | 0.13%(+0.252)#48 | 0.18%(+0.211)#979 |
| 49. | Alondra Park | 0.38% | 0.13%(+0.250)#49 | 0.18%(+0.209)#983 |
| 50. | Ashland | 0.38% | 0.13%(+0.249)#50 | 0.18%(+0.208)#984 |
| 51. | Grand Terrace | 0.38% | 0.13%(+0.247)#51 | 0.18%(+0.206)#992 |
| 52. | La Riviera | 0.38% | 0.13%(+0.243)#52 | 0.18%(+0.202)#1,001 |
| 53. | Hanford | 0.37% | 0.13%(+0.238)#53 | 0.18%(+0.197)#1,010 |
| 54. | La Mesa | 0.37% | 0.13%(+0.236)#54 | 0.18%(+0.195)#1,016 |
| 55. | Pinole | 0.37% | 0.13%(+0.235)#55 | 0.18%(+0.194)#1,020 |
| 56. | Grover Beach | 0.37% | 0.13%(+0.234)#56 | 0.18%(+0.193)#1,023 |
| 57. | Paramount | 0.37% | 0.13%(+0.233)#57 | 0.18%(+0.192)#1,024 |
| 58. | Avenal | 0.37% | 0.13%(+0.230)#58 | 0.18%(+0.189)#1,032 |
| 59. | Pepperdine University | 0.36% | 0.13%(+0.230)#59 | 0.18%(+0.189)#1,033 |
| 60. | Rancho Cucamonga | 0.36% | 0.13%(+0.229)#60 | 0.18%(+0.188)#1,034 |
| 61. | Coronado | 0.34% | 0.13%(+0.210)#61 | 0.18%(+0.169)#1,085 |
| 62. | Newark | 0.34% | 0.13%(+0.209)#62 | 0.18%(+0.168)#1,089 |
| 63. | Petaluma | 0.34% | 0.13%(+0.207)#63 | 0.18%(+0.166)#1,094 |
| 64. | Temescal Valley | 0.32% | 0.13%(+0.184)#64 | 0.18%(+0.143)#1,154 |
| 65. | Clovis | 0.32% | 0.13%(+0.182)#65 | 0.18%(+0.141)#1,160 |
| 66. | Lemoore Station | 0.31% | 0.13%(+0.178)#66 | 0.18%(+0.137)#1,171 |
| 67. | San Ramon | 0.31% | 0.13%(+0.176)#67 | 0.18%(+0.135)#1,174 |
| 68. | Camarillo | 0.31% | 0.13%(+0.175)#68 | 0.18%(+0.134)#1,179 |
| 69. | Loma Linda | 0.30% | 0.13%(+0.167)#69 | 0.18%(+0.126)#1,201 |
| 70. | Albany | 0.30% | 0.13%(+0.165)#70 | 0.18%(+0.124)#1,202 |
| 71. | Lynwood | 0.30% | 0.13%(+0.162)#71 | 0.18%(+0.121)#1,207 |
| 72. | Camp Pendleton Mainside | 0.29% | 0.13%(+0.157)#72 | 0.18%(+0.116)#1,223 |
| 73. | Oakdale | 0.29% | 0.13%(+0.155)#73 | 0.18%(+0.114)#1,232 |
| 74. | Stockton | 0.29% | 0.13%(+0.154)#74 | 0.18%(+0.113)#1,235 |
| 75. | La Puente | 0.29% | 0.13%(+0.153)#75 | 0.18%(+0.112)#1,236 |
| 76. | Mentone | 0.28% | 0.13%(+0.143)#76 | 0.18%(+0.102)#1,272 |
| 77. | Pasadena | 0.28% | 0.13%(+0.141)#77 | 0.18%(+0.100)#1,280 |
| 78. | Santa Clara | 0.27% | 0.13%(+0.140)#78 | 0.18%(+0.099)#1,285 |
| 79. | San Mateo | 0.27% | 0.13%(+0.139)#79 | 0.18%(+0.098)#1,289 |
| 80. | San Dimas | 0.27% | 0.13%(+0.135)#80 | 0.18%(+0.094)#1,300 |
| 81. | Spring Valley Cdp San Diego County | 0.27% | 0.13%(+0.133)#81 | 0.18%(+0.092)#1,305 |
| 82. | Woodland | 0.26% | 0.13%(+0.130)#82 | 0.18%(+0.089)#1,314 |
| 83. | Palmdale | 0.26% | 0.13%(+0.124)#83 | 0.18%(+0.083)#1,328 |
| 84. | Los Osos | 0.26% | 0.13%(+0.123)#84 | 0.18%(+0.082)#1,329 |
| 85. | Rosedale | 0.25% | 0.13%(+0.116)#85 | 0.18%(+0.075)#1,353 |
| 86. | Fontana | 0.25% | 0.13%(+0.114)#86 | 0.18%(+0.073)#1,359 |
| 87. | Chino | 0.24% | 0.13%(+0.107)#87 | 0.18%(+0.066)#1,387 |
| 88. | Oildale | 0.24% | 0.13%(+0.107)#88 | 0.18%(+0.066)#1,388 |
| 89. | San Leandro | 0.24% | 0.13%(+0.106)#89 | 0.18%(+0.065)#1,390 |
| 90. | Rosemont | 0.24% | 0.13%(+0.104)#90 | 0.18%(+0.063)#1,398 |
| 91. | Rancho Santa Margarita | 0.24% | 0.13%(+0.102)#91 | 0.18%(+0.061)#1,411 |
| 92. | Redlands | 0.24% | 0.13%(+0.101)#92 | 0.18%(+0.060)#1,417 |
| 93. | Brentwood | 0.24% | 0.13%(+0.101)#93 | 0.18%(+0.060)#1,419 |
| 94. | Carlsbad | 0.23% | 0.13%(+0.098)#94 | 0.18%(+0.057)#1,428 |
| 95. | Rolling Hills Estates | 0.23% | 0.13%(+0.097)#95 | 0.18%(+0.056)#1,435 |
| 96. | San Luis Obispo | 0.23% | 0.13%(+0.095)#96 | 0.18%(+0.054)#1,439 |
| 97. | Florin | 0.22% | 0.13%(+0.085)#97 | 0.18%(+0.044)#1,460 |
| 98. | Lancaster | 0.22% | 0.13%(+0.082)#98 | 0.18%(+0.041)#1,479 |
| 99. | Ontario | 0.22% | 0.13%(+0.081)#99 | 0.18%(+0.040)#1,481 |
| 100. | Cerritos | 0.21% | 0.13%(+0.079)#100 | 0.18%(+0.038)#1,486 |
Common Questions
What are the Top 10 Cities with the Highest Percentage of Nigerian Population in California?
Top 10 Cities with the Highest Percentage of Nigerian Population in California are:
#1
2.32%
#2
2.15%
#3
1.87%
#4
1.78%
#5
1.74%
#6
1.43%
#7
1.42%
#8
1.39%
#9
1.29%
#10
1.22%
What city has the Highest Percentage of Nigerian Population in California?
Hercules has the Highest Percentage of Nigerian Population in California with 2.32%.
What is the Percentage of Nigerian Population in the State of California?
Percentage of Nigerian Population in California is 0.13%.
What is the Percentage of Nigerian Population in the United States?
Percentage of Nigerian Population in the United States is 0.18%.