Zip Codes with the Highest Percentage of Population Employed in Installation, Maintenance & Repair in Pleasanton, CA
RELATED REPORTS & OPTIONS
Installation, Maintenance & Repair
Pleasanton
Compare Zip Codes
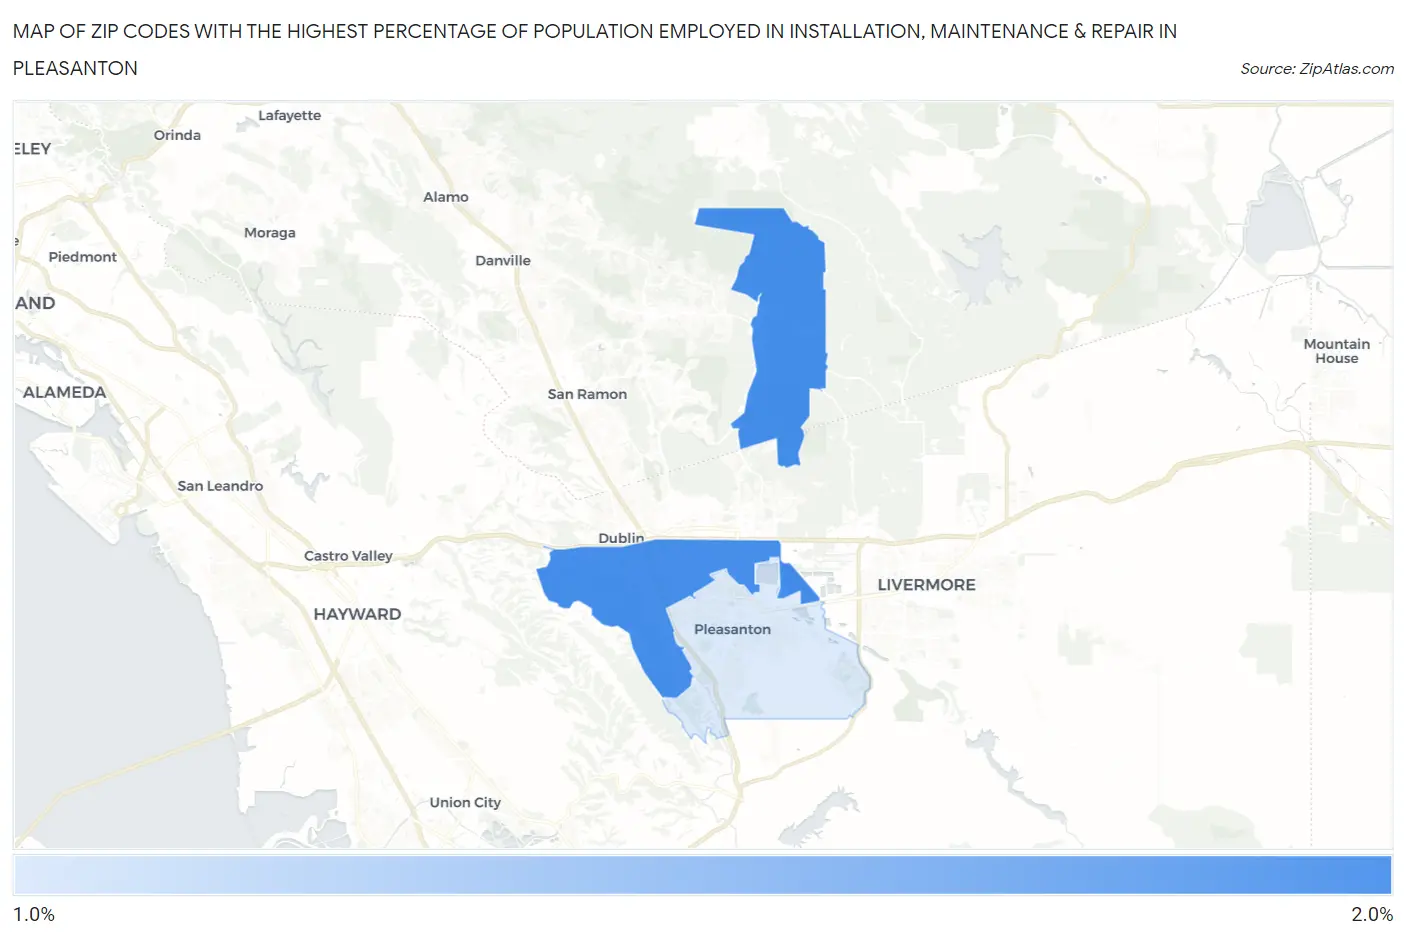
Map of Zip Codes with the Highest Percentage of Population Employed in Installation, Maintenance & Repair in Pleasanton
1.0%
1.7%
Zip Codes with the Highest Percentage of Population Employed in Installation, Maintenance & Repair in Pleasanton, CA
| Zip Code | % Employed | vs State | vs National | |
| 1. | 94588 | 1.7% | 2.6%(-0.874)#1,064 | 3.1%(-1.38)#23,422 |
| 2. | 94566 | 1.0% | 2.6%(-1.55)#1,248 | 3.1%(-2.06)#25,916 |
1
Common Questions
What are the Top Zip Codes with the Highest Percentage of Population Employed in Installation, Maintenance & Repair in Pleasanton, CA?
Top Zip Codes with the Highest Percentage of Population Employed in Installation, Maintenance & Repair in Pleasanton, CA are:
What zip code has the Highest Percentage of Population Employed in Installation, Maintenance & Repair in Pleasanton, CA?
94588 has the Highest Percentage of Population Employed in Installation, Maintenance & Repair in Pleasanton, CA with 1.7%.
What is the Percentage of Population Employed in Installation, Maintenance & Repair in Pleasanton, CA?
Percentage of Population Employed in Installation, Maintenance & Repair in Pleasanton is 1.3%.
What is the Percentage of Population Employed in Installation, Maintenance & Repair in California?
Percentage of Population Employed in Installation, Maintenance & Repair in California is 2.6%.
What is the Percentage of Population Employed in Installation, Maintenance & Repair in the United States?
Percentage of Population Employed in Installation, Maintenance & Repair in the United States is 3.1%.