Cities with the Largest Guatemalan Community in California
RELATED REPORTS & OPTIONS
Guatemalan
California
Compare Cities
Map of Cities with the Largest Guatemalan Community in California
0
200,000
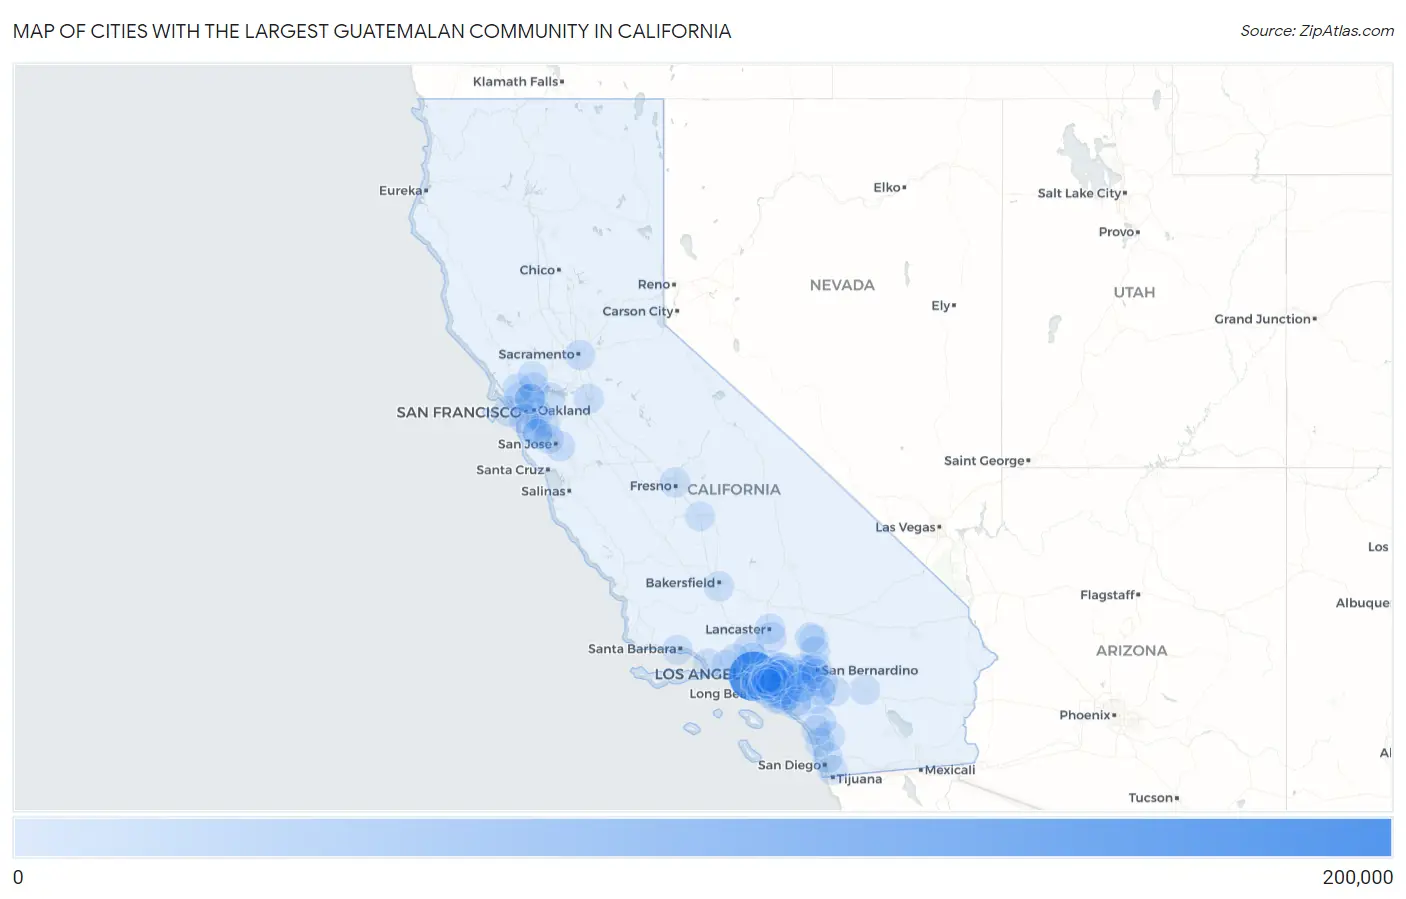
Cities with the Largest Guatemalan Community in California
| City | Guatemalan | vs State | vs National | |
| 1. | Los Angeles | 177,815 | 468,407(37.96%)#1 | 1,669,094(10.65%)#1 |
| 2. | Oakland | 13,260 | 468,407(2.83%)#2 | 1,669,094(0.79%)#6 |
| 3. | Long Beach | 6,607 | 468,407(1.41%)#3 | 1,669,094(0.40%)#18 |
| 4. | San Rafael | 6,042 | 468,407(1.29%)#4 | 1,669,094(0.36%)#20 |
| 5. | San Francisco | 5,978 | 468,407(1.28%)#5 | 1,669,094(0.36%)#22 |
| 6. | Riverside | 5,891 | 468,407(1.26%)#6 | 1,669,094(0.35%)#23 |
| 7. | Santa Clarita | 5,171 | 468,407(1.10%)#7 | 1,669,094(0.31%)#27 |
| 8. | Palmdale | 4,927 | 468,407(1.05%)#8 | 1,669,094(0.30%)#30 |
| 9. | Inglewood | 4,556 | 468,407(0.97%)#9 | 1,669,094(0.27%)#35 |
| 10. | San Diego | 4,458 | 468,407(0.95%)#10 | 1,669,094(0.27%)#37 |
| 11. | Anaheim | 4,374 | 468,407(0.93%)#11 | 1,669,094(0.26%)#38 |
| 12. | San Bernardino | 4,285 | 468,407(0.91%)#12 | 1,669,094(0.26%)#40 |
| 13. | Fontana | 4,069 | 468,407(0.87%)#13 | 1,669,094(0.24%)#43 |
| 14. | Hawthorne | 4,053 | 468,407(0.87%)#14 | 1,669,094(0.24%)#44 |
| 15. | Santa Ana | 3,988 | 468,407(0.85%)#15 | 1,669,094(0.24%)#45 |
| 16. | San Jose | 3,759 | 468,407(0.80%)#16 | 1,669,094(0.23%)#48 |
| 17. | Downey | 3,614 | 468,407(0.77%)#17 | 1,669,094(0.22%)#53 |
| 18. | Richmond | 3,560 | 468,407(0.76%)#18 | 1,669,094(0.21%)#56 |
| 19. | San Mateo | 3,234 | 468,407(0.69%)#19 | 1,669,094(0.19%)#64 |
| 20. | Moreno Valley | 3,140 | 468,407(0.67%)#20 | 1,669,094(0.19%)#67 |
| 21. | Pomona | 3,119 | 468,407(0.67%)#21 | 1,669,094(0.19%)#68 |
| 22. | Westmont | 2,998 | 468,407(0.64%)#22 | 1,669,094(0.18%)#73 |
| 23. | South Gate | 2,718 | 468,407(0.58%)#23 | 1,669,094(0.16%)#78 |
| 24. | East Los Angeles | 2,647 | 468,407(0.57%)#24 | 1,669,094(0.16%)#79 |
| 25. | Norwalk | 2,613 | 468,407(0.56%)#25 | 1,669,094(0.16%)#81 |
| 26. | Lancaster | 2,598 | 468,407(0.55%)#26 | 1,669,094(0.16%)#82 |
| 27. | Escondido | 2,579 | 468,407(0.55%)#27 | 1,669,094(0.15%)#83 |
| 28. | Novato | 2,548 | 468,407(0.54%)#28 | 1,669,094(0.15%)#85 |
| 29. | Lawndale | 2,341 | 468,407(0.50%)#29 | 1,669,094(0.14%)#95 |
| 30. | Florence Graham | 2,298 | 468,407(0.49%)#30 | 1,669,094(0.14%)#99 |
| 31. | Sacramento | 2,248 | 468,407(0.48%)#31 | 1,669,094(0.13%)#103 |
| 32. | Rialto | 2,184 | 468,407(0.47%)#32 | 1,669,094(0.13%)#107 |
| 33. | Redwood City | 2,115 | 468,407(0.45%)#33 | 1,669,094(0.13%)#109 |
| 34. | Bakersfield | 2,080 | 468,407(0.44%)#34 | 1,669,094(0.12%)#113 |
| 35. | Hayward | 1,960 | 468,407(0.42%)#35 | 1,669,094(0.12%)#122 |
| 36. | Huntington Park | 1,938 | 468,407(0.41%)#36 | 1,669,094(0.12%)#127 |
| 37. | Willowbrook | 1,920 | 468,407(0.41%)#37 | 1,669,094(0.12%)#128 |
| 38. | Stockton | 1,913 | 468,407(0.41%)#38 | 1,669,094(0.11%)#129 |
| 39. | Ontario | 1,903 | 468,407(0.41%)#39 | 1,669,094(0.11%)#130 |
| 40. | Compton | 1,895 | 468,407(0.40%)#40 | 1,669,094(0.11%)#131 |
| 41. | Daly City | 1,876 | 468,407(0.40%)#41 | 1,669,094(0.11%)#134 |
| 42. | Pasadena | 1,848 | 468,407(0.39%)#42 | 1,669,094(0.11%)#135 |
| 43. | El Monte | 1,844 | 468,407(0.39%)#43 | 1,669,094(0.11%)#136 |
| 44. | Gardena | 1,797 | 468,407(0.38%)#44 | 1,669,094(0.11%)#141 |
| 45. | Rancho Cucamonga | 1,752 | 468,407(0.37%)#45 | 1,669,094(0.10%)#142 |
| 46. | Fresno | 1,726 | 468,407(0.37%)#46 | 1,669,094(0.10%)#144 |
| 47. | Lynwood | 1,726 | 468,407(0.37%)#47 | 1,669,094(0.10%)#145 |
| 48. | Baldwin Park | 1,661 | 468,407(0.35%)#48 | 1,669,094(0.10%)#152 |
| 49. | Lake Elsinore | 1,604 | 468,407(0.34%)#49 | 1,669,094(0.10%)#161 |
| 50. | Vallejo | 1,580 | 468,407(0.34%)#50 | 1,669,094(0.09%)#163 |
| 51. | Encinitas | 1,573 | 468,407(0.34%)#51 | 1,669,094(0.09%)#166 |
| 52. | Bellflower | 1,534 | 468,407(0.33%)#52 | 1,669,094(0.09%)#170 |
| 53. | Costa Mesa | 1,531 | 468,407(0.33%)#53 | 1,669,094(0.09%)#171 |
| 54. | Cathedral City | 1,531 | 468,407(0.33%)#54 | 1,669,094(0.09%)#172 |
| 55. | Lennox | 1,526 | 468,407(0.33%)#55 | 1,669,094(0.09%)#174 |
| 56. | Victorville | 1,485 | 468,407(0.32%)#56 | 1,669,094(0.09%)#180 |
| 57. | Whittier | 1,476 | 468,407(0.32%)#57 | 1,669,094(0.09%)#181 |
| 58. | Fallbrook | 1,447 | 468,407(0.31%)#58 | 1,669,094(0.09%)#187 |
| 59. | Carson | 1,435 | 468,407(0.31%)#59 | 1,669,094(0.09%)#190 |
| 60. | Santa Barbara | 1,426 | 468,407(0.30%)#60 | 1,669,094(0.09%)#191 |
| 61. | Concord | 1,417 | 468,407(0.30%)#61 | 1,669,094(0.08%)#194 |
| 62. | Tustin | 1,363 | 468,407(0.29%)#62 | 1,669,094(0.08%)#199 |
| 63. | Garden Grove | 1,236 | 468,407(0.26%)#63 | 1,669,094(0.07%)#219 |
| 64. | Orange | 1,235 | 468,407(0.26%)#64 | 1,669,094(0.07%)#220 |
| 65. | San Jacinto | 1,222 | 468,407(0.26%)#65 | 1,669,094(0.07%)#222 |
| 66. | Jurupa Valley | 1,184 | 468,407(0.25%)#66 | 1,669,094(0.07%)#231 |
| 67. | Visalia | 1,183 | 468,407(0.25%)#67 | 1,669,094(0.07%)#232 |
| 68. | Monrovia | 1,167 | 468,407(0.25%)#68 | 1,669,094(0.07%)#234 |
| 69. | Huntington Beach | 1,163 | 468,407(0.25%)#69 | 1,669,094(0.07%)#236 |
| 70. | La Habra | 1,111 | 468,407(0.24%)#70 | 1,669,094(0.07%)#248 |
| 71. | Bell Gardens | 1,107 | 468,407(0.24%)#71 | 1,669,094(0.07%)#249 |
| 72. | Simi Valley | 1,097 | 468,407(0.23%)#72 | 1,669,094(0.07%)#252 |
| 73. | Chino | 1,058 | 468,407(0.23%)#73 | 1,669,094(0.06%)#261 |
| 74. | Sunnyvale | 1,032 | 468,407(0.22%)#74 | 1,669,094(0.06%)#265 |
| 75. | Colton | 1,027 | 468,407(0.22%)#75 | 1,669,094(0.06%)#266 |
| 76. | Azusa | 1,015 | 468,407(0.22%)#76 | 1,669,094(0.06%)#268 |
| 77. | Lakewood | 988 | 468,407(0.21%)#77 | 1,669,094(0.06%)#275 |
| 78. | West Covina | 975 | 468,407(0.21%)#78 | 1,669,094(0.06%)#278 |
| 79. | Perris | 970 | 468,407(0.21%)#79 | 1,669,094(0.06%)#280 |
| 80. | Oxnard | 938 | 468,407(0.20%)#80 | 1,669,094(0.06%)#287 |
| 81. | La Puente | 925 | 468,407(0.20%)#81 | 1,669,094(0.06%)#292 |
| 82. | Fullerton | 924 | 468,407(0.20%)#82 | 1,669,094(0.06%)#293 |
| 83. | Mission Viejo | 908 | 468,407(0.19%)#83 | 1,669,094(0.05%)#297 |
| 84. | Montebello | 894 | 468,407(0.19%)#84 | 1,669,094(0.05%)#304 |
| 85. | San Fernando | 892 | 468,407(0.19%)#85 | 1,669,094(0.05%)#306 |
| 86. | Hesperia | 891 | 468,407(0.19%)#86 | 1,669,094(0.05%)#307 |
| 87. | Maywood | 886 | 468,407(0.19%)#87 | 1,669,094(0.05%)#310 |
| 88. | Oceanside | 874 | 468,407(0.19%)#88 | 1,669,094(0.05%)#313 |
| 89. | San Pablo | 847 | 468,407(0.18%)#89 | 1,669,094(0.05%)#315 |
| 90. | Adelanto | 837 | 468,407(0.18%)#90 | 1,669,094(0.05%)#319 |
| 91. | Thousand Oaks | 831 | 468,407(0.18%)#91 | 1,669,094(0.05%)#323 |
| 92. | Lake Forest | 826 | 468,407(0.18%)#92 | 1,669,094(0.05%)#324 |
| 93. | North Fair Oaks | 824 | 468,407(0.18%)#93 | 1,669,094(0.05%)#325 |
| 94. | Cudahy | 819 | 468,407(0.17%)#94 | 1,669,094(0.05%)#328 |
| 95. | Corona | 768 | 468,407(0.16%)#95 | 1,669,094(0.05%)#344 |
| 96. | Pico Rivera | 763 | 468,407(0.16%)#96 | 1,669,094(0.05%)#346 |
| 97. | South Whittier | 755 | 468,407(0.16%)#97 | 1,669,094(0.05%)#350 |
| 98. | Chula Vista | 753 | 468,407(0.16%)#98 | 1,669,094(0.05%)#352 |
| 99. | Napa | 742 | 468,407(0.16%)#99 | 1,669,094(0.04%)#357 |
| 100. | Paramount | 741 | 468,407(0.16%)#100 | 1,669,094(0.04%)#358 |
Common Questions
What are the Top 10 Cities with the Largest Guatemalan Community in California?
Top 10 Cities with the Largest Guatemalan Community in California are:
#1
177,815
#2
13,260
#3
6,607
#4
6,042
#5
5,978
#6
5,891
#7
5,171
#8
4,927
#9
4,556
#10
4,458
What city has the Largest Guatemalan Community in California?
Los Angeles has the Largest Guatemalan Community in California with 177,815.
What is the Total Guatemalan Population in the State of California?
Total Guatemalan Population in California is 468,407.
What is the Total Guatemalan Population in the United States?
Total Guatemalan Population in the United States is 1,669,094.