Zip Codes with the Highest Percentage of Population Employed in Installation, Maintenance & Repair in Santa Maria, CA
RELATED REPORTS & OPTIONS
Installation, Maintenance & Repair
Santa Maria
Compare Zip Codes
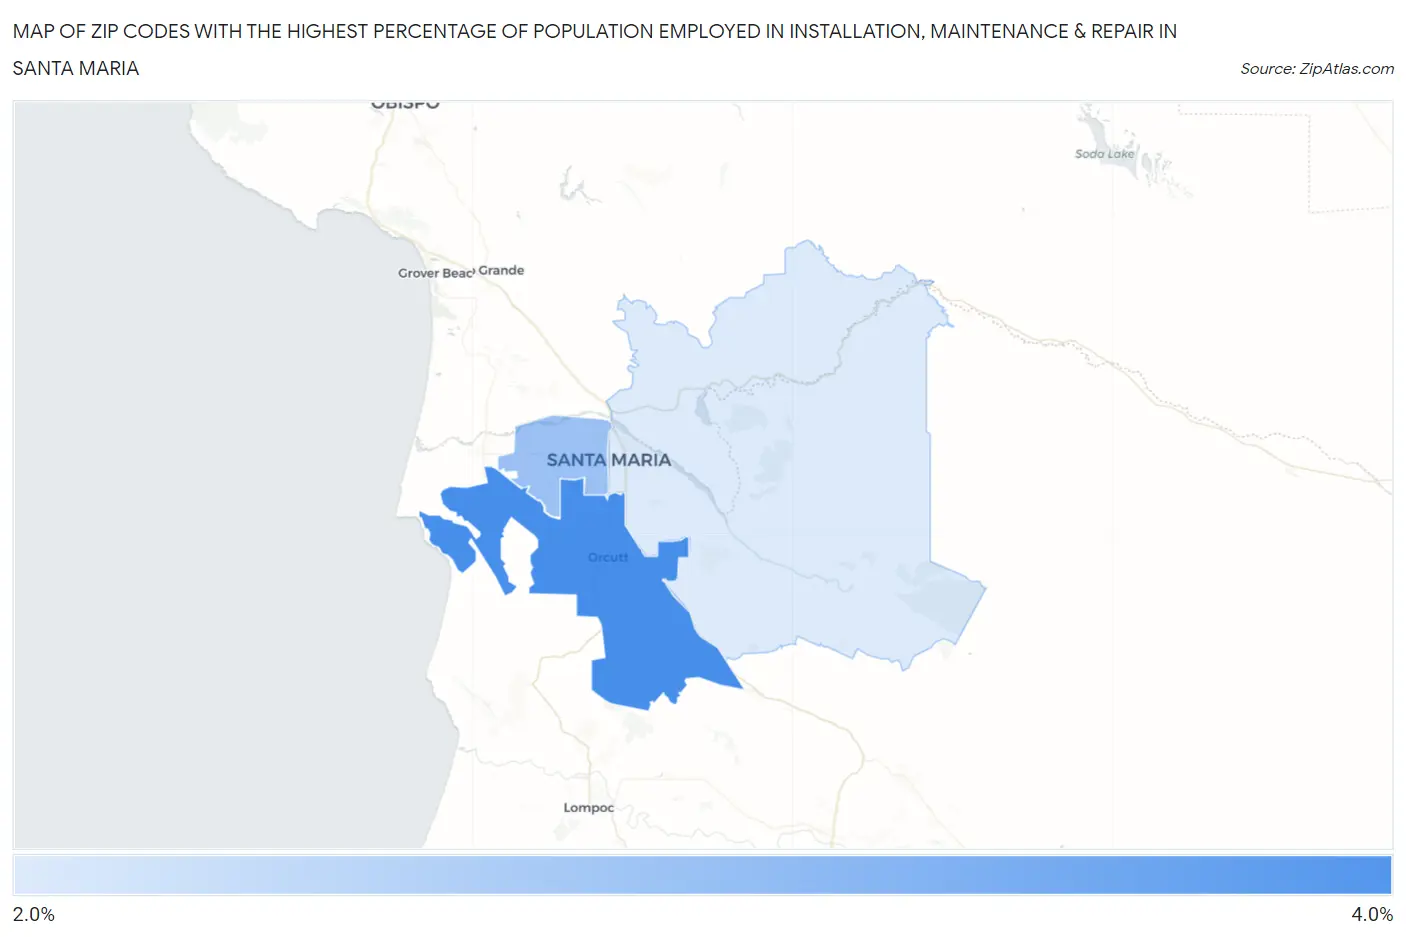
Map of Zip Codes with the Highest Percentage of Population Employed in Installation, Maintenance & Repair in Santa Maria
2.2%
3.6%
Zip Codes with the Highest Percentage of Population Employed in Installation, Maintenance & Repair in Santa Maria, CA
| Zip Code | % Employed | vs State | vs National | |
| 1. | 93455 | 3.6% | 2.6%(+1.01)#440 | 3.1%(+0.497)#14,310 |
| 2. | 93458 | 2.8% | 2.6%(+0.249)#665 | 3.1%(-0.263)#17,983 |
| 3. | 93454 | 2.2% | 2.6%(-0.356)#907 | 3.1%(-0.868)#21,082 |
1
Common Questions
What are the Top Zip Codes with the Highest Percentage of Population Employed in Installation, Maintenance & Repair in Santa Maria, CA?
Top Zip Codes with the Highest Percentage of Population Employed in Installation, Maintenance & Repair in Santa Maria, CA are:
What zip code has the Highest Percentage of Population Employed in Installation, Maintenance & Repair in Santa Maria, CA?
93455 has the Highest Percentage of Population Employed in Installation, Maintenance & Repair in Santa Maria, CA with 3.6%.
What is the Percentage of Population Employed in Installation, Maintenance & Repair in Santa Maria, CA?
Percentage of Population Employed in Installation, Maintenance & Repair in Santa Maria is 2.5%.
What is the Percentage of Population Employed in Installation, Maintenance & Repair in California?
Percentage of Population Employed in Installation, Maintenance & Repair in California is 2.6%.
What is the Percentage of Population Employed in Installation, Maintenance & Repair in the United States?
Percentage of Population Employed in Installation, Maintenance & Repair in the United States is 3.1%.