Cities with the Highest Percentage of Population with a Degree in Bio, Nature & Agricultural in California
RELATED REPORTS & OPTIONS
Bio, Nature & Agricultural
California
Compare Cities
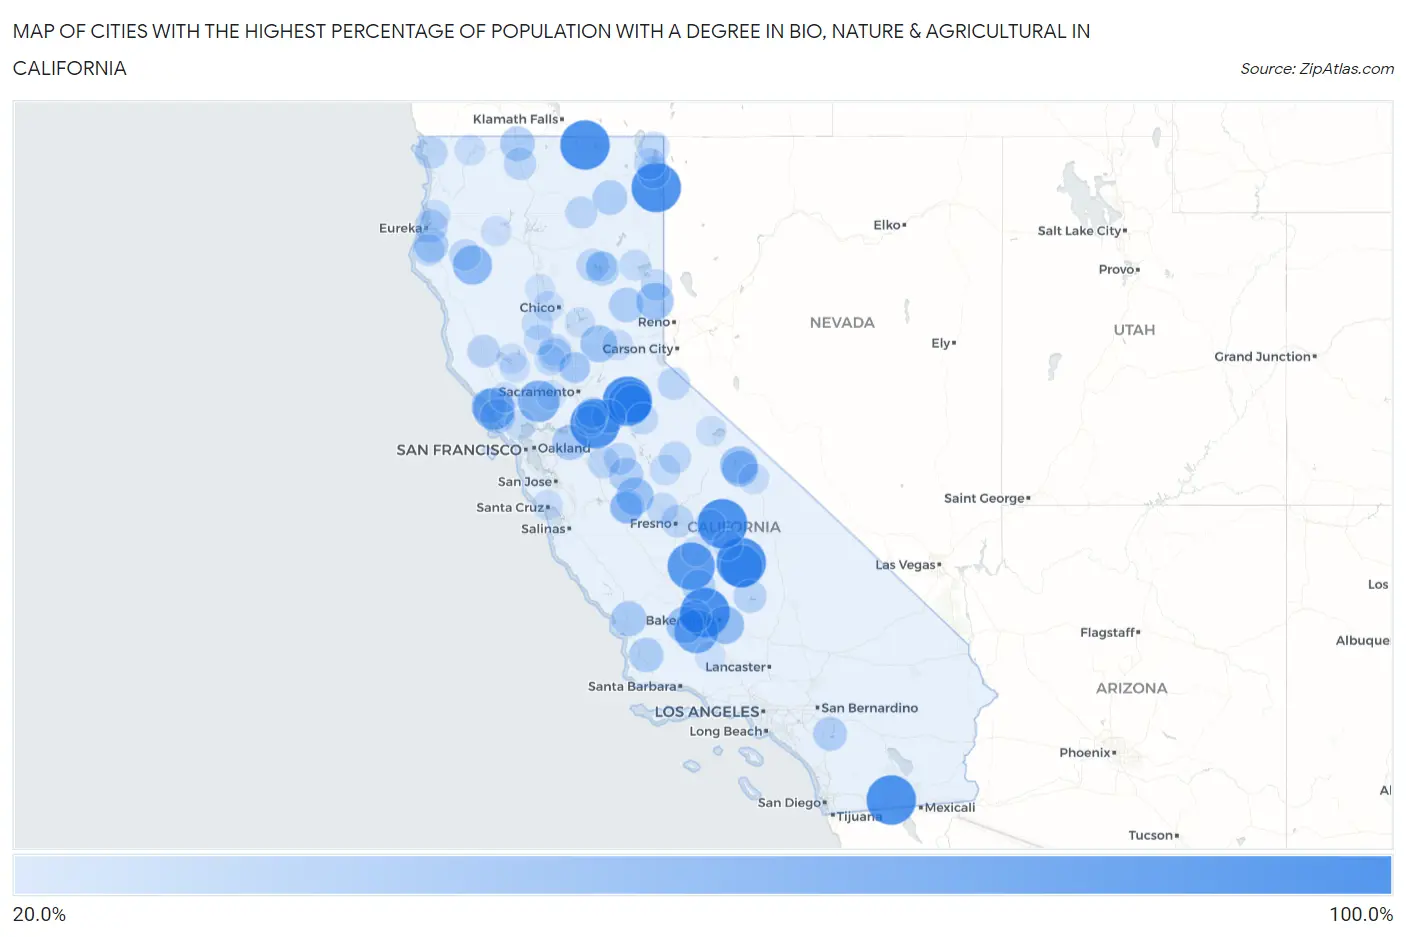
Map of Cities with the Highest Percentage of Population with a Degree in Bio, Nature & Agricultural in California
0.0%
100.0%
Cities with the Highest Percentage of Population with a Degree in Bio, Nature & Agricultural in California
| City | % Graduates | vs State | vs National | |
| 1. | Victor | 100.0% | 6.8%(+93.2)#1 | 6.4%(+93.6)#5 |
| 2. | Newell | 100.0% | 6.8%(+93.2)#2 | 6.4%(+93.6)#15 |
| 3. | Smith Corner | 100.0% | 6.8%(+93.2)#3 | 6.4%(+93.6)#19 |
| 4. | Ocotillo | 100.0% | 6.8%(+93.2)#4 | 6.4%(+93.6)#40 |
| 5. | Post Mountain | 100.0% | 6.8%(+93.2)#5 | 6.4%(+93.6)#55 |
| 6. | Sequoia Crest | 100.0% | 6.8%(+93.2)#6 | 6.4%(+93.6)#58 |
| 7. | Volcano | 100.0% | 6.8%(+93.2)#7 | 6.4%(+93.6)#75 |
| 8. | Wilsonia | 100.0% | 6.8%(+93.2)#8 | 6.4%(+93.6)#99 |
| 9. | Eagleville | 100.0% | 6.8%(+93.2)#9 | 6.4%(+93.6)#110 |
| 10. | Waukena | 90.9% | 6.8%(+84.1)#10 | 6.4%(+84.6)#119 |
| 11. | Valley Acres | 76.5% | 6.8%(+69.7)#11 | 6.4%(+70.1)#152 |
| 12. | Pioneer | 76.4% | 6.8%(+69.7)#12 | 6.4%(+70.1)#154 |
| 13. | Pierpoint | 71.9% | 6.8%(+65.1)#13 | 6.4%(+65.5)#168 |
| 14. | Bodega | 68.8% | 6.8%(+62.1)#14 | 6.4%(+62.5)#178 |
| 15. | Moskowite Corner | 67.5% | 6.8%(+60.7)#15 | 6.4%(+61.1)#181 |
| 16. | Yosemite West | 66.7% | 6.8%(+59.9)#16 | 6.4%(+60.3)#201 |
| 17. | Ruth | 58.1% | 6.8%(+51.3)#17 | 6.4%(+51.7)#253 |
| 18. | Fuller Acres | 53.8% | 6.8%(+47.1)#18 | 6.4%(+47.5)#279 |
| 19. | West Point | 52.0% | 6.8%(+45.2)#19 | 6.4%(+45.6)#305 |
| 20. | Rumsey | 51.2% | 6.8%(+44.4)#20 | 6.4%(+44.8)#311 |
| 21. | El Nido | 50.0% | 6.8%(+43.2)#21 | 6.4%(+43.6)#321 |
| 22. | Chilcoot Vinton | 50.0% | 6.8%(+43.2)#22 | 6.4%(+43.6)#326 |
| 23. | Mckittrick | 50.0% | 6.8%(+43.2)#23 | 6.4%(+43.6)#353 |
| 24. | Rivergrove | 50.0% | 6.8%(+43.2)#24 | 6.4%(+43.6)#357 |
| 25. | Sunny Slopes | 50.0% | 6.8%(+43.2)#25 | 6.4%(+43.6)#361 |
| 26. | Rough And Ready | 48.4% | 6.8%(+41.6)#26 | 6.4%(+42.0)#389 |
| 27. | Sonoma State University | 47.1% | 6.8%(+40.3)#27 | 6.4%(+40.7)#403 |
| 28. | Swall Meadows | 46.3% | 6.8%(+39.5)#28 | 6.4%(+40.0)#419 |
| 29. | Byron | 42.2% | 6.8%(+35.5)#29 | 6.4%(+35.9)#483 |
| 30. | Santa Margarita | 42.0% | 6.8%(+35.2)#30 | 6.4%(+35.6)#491 |
| 31. | Sereno Del Mar | 40.6% | 6.8%(+33.8)#31 | 6.4%(+34.2)#524 |
| 32. | Hornbrook | 40.0% | 6.8%(+33.2)#32 | 6.4%(+33.6)#538 |
| 33. | Tomales | 40.0% | 6.8%(+33.2)#33 | 6.4%(+33.6)#549 |
| 34. | Graeagle | 39.5% | 6.8%(+32.7)#34 | 6.4%(+33.1)#573 |
| 35. | Adin | 39.3% | 6.8%(+32.5)#35 | 6.4%(+32.9)#581 |
| 36. | Sisquoc | 39.1% | 6.8%(+32.4)#36 | 6.4%(+32.8)#585 |
| 37. | Hydesville | 38.0% | 6.8%(+31.2)#37 | 6.4%(+31.6)#611 |
| 38. | Cressey | 37.5% | 6.8%(+30.7)#38 | 6.4%(+31.1)#626 |
| 39. | Dos Palos | 37.2% | 6.8%(+30.4)#39 | 6.4%(+30.8)#646 |
| 40. | Camanche North Shore | 37.0% | 6.8%(+30.3)#40 | 6.4%(+30.7)#650 |
| 41. | Winchester | 37.0% | 6.8%(+30.2)#41 | 6.4%(+30.6)#652 |
| 42. | East Shore | 35.8% | 6.8%(+29.1)#42 | 6.4%(+29.5)#681 |
| 43. | Allensworth | 35.7% | 6.8%(+28.9)#43 | 6.4%(+29.4)#685 |
| 44. | Wofford Heights | 34.2% | 6.8%(+27.5)#44 | 6.4%(+27.9)#727 |
| 45. | Indianola | 33.6% | 6.8%(+26.8)#45 | 6.4%(+27.3)#745 |
| 46. | Grimes | 33.3% | 6.8%(+26.6)#46 | 6.4%(+27.0)#761 |
| 47. | Talmage | 32.6% | 6.8%(+25.9)#47 | 6.4%(+26.3)#844 |
| 48. | Buttonwillow | 31.8% | 6.8%(+25.0)#48 | 6.4%(+25.5)#868 |
| 49. | Grenada | 31.7% | 6.8%(+24.9)#49 | 6.4%(+25.4)#876 |
| 50. | Mayfair | 31.7% | 6.8%(+24.9)#50 | 6.4%(+25.3)#880 |
| 51. | Hiouchi | 31.4% | 6.8%(+24.6)#51 | 6.4%(+25.0)#896 |
| 52. | Chester | 31.3% | 6.8%(+24.6)#52 | 6.4%(+25.0)#898 |
| 53. | Waterford | 31.0% | 6.8%(+24.3)#53 | 6.4%(+24.7)#915 |
| 54. | South Dos Palos | 31.0% | 6.8%(+24.3)#54 | 6.4%(+24.7)#916 |
| 55. | Markleeville | 31.0% | 6.8%(+24.3)#55 | 6.4%(+24.7)#919 |
| 56. | Collierville | 30.4% | 6.8%(+23.6)#56 | 6.4%(+24.0)#960 |
| 57. | Cedarville | 30.3% | 6.8%(+23.6)#57 | 6.4%(+24.0)#963 |
| 58. | Fall River Mills | 30.3% | 6.8%(+23.5)#58 | 6.4%(+23.9)#964 |
| 59. | Riverdale Park | 30.2% | 6.8%(+23.4)#59 | 6.4%(+23.8)#973 |
| 60. | El Portal | 30.1% | 6.8%(+23.3)#60 | 6.4%(+23.8)#974 |
| 61. | Rio Dell | 29.1% | 6.8%(+22.4)#61 | 6.4%(+22.8)#1,033 |
| 62. | Meridian | 28.6% | 6.8%(+21.8)#62 | 6.4%(+22.2)#1,052 |
| 63. | Mad River | 28.6% | 6.8%(+21.8)#63 | 6.4%(+22.2)#1,055 |
| 64. | Fort Bidwell | 28.6% | 6.8%(+21.8)#64 | 6.4%(+22.2)#1,062 |
| 65. | Nicolaus | 28.6% | 6.8%(+21.8)#65 | 6.4%(+22.2)#1,073 |
| 66. | Parksdale | 28.3% | 6.8%(+21.5)#66 | 6.4%(+22.0)#1,088 |
| 67. | Doyle | 28.1% | 6.8%(+21.3)#67 | 6.4%(+21.7)#1,100 |
| 68. | Avery | 28.0% | 6.8%(+21.2)#68 | 6.4%(+21.6)#1,105 |
| 69. | Lake City | 28.0% | 6.8%(+21.2)#69 | 6.4%(+21.6)#1,110 |
| 70. | Squaw Valley | 27.7% | 6.8%(+20.9)#70 | 6.4%(+21.3)#1,126 |
| 71. | Acampo | 27.6% | 6.8%(+20.8)#71 | 6.4%(+21.2)#1,133 |
| 72. | Herald | 27.1% | 6.8%(+20.4)#72 | 6.4%(+20.8)#1,164 |
| 73. | Willows | 26.6% | 6.8%(+19.8)#73 | 6.4%(+20.3)#1,219 |
| 74. | College City | 26.5% | 6.8%(+19.7)#74 | 6.4%(+20.1)#1,231 |
| 75. | Bear Valley Cdp Alpine County | 26.3% | 6.8%(+19.5)#75 | 6.4%(+20.0)#1,251 |
| 76. | Janesville | 26.2% | 6.8%(+19.5)#76 | 6.4%(+19.9)#1,255 |
| 77. | Mariposa | 25.7% | 6.8%(+19.0)#77 | 6.4%(+19.4)#1,291 |
| 78. | Hamilton Branch | 25.6% | 6.8%(+18.8)#78 | 6.4%(+19.2)#1,308 |
| 79. | Whitmore | 25.5% | 6.8%(+18.8)#79 | 6.4%(+19.2)#1,316 |
| 80. | Happy Camp | 25.2% | 6.8%(+18.4)#80 | 6.4%(+18.8)#1,341 |
| 81. | Alta | 25.1% | 6.8%(+18.3)#81 | 6.4%(+18.8)#1,345 |
| 82. | Mono City | 24.7% | 6.8%(+17.9)#82 | 6.4%(+18.3)#1,449 |
| 83. | Kelly Ridge | 24.6% | 6.8%(+17.8)#83 | 6.4%(+18.2)#1,461 |
| 84. | Black Point Green Point | 24.5% | 6.8%(+17.7)#84 | 6.4%(+18.2)#1,467 |
| 85. | Bishop | 24.4% | 6.8%(+17.6)#85 | 6.4%(+18.1)#1,474 |
| 86. | Fieldbrook | 24.1% | 6.8%(+17.4)#86 | 6.4%(+17.8)#1,497 |
| 87. | Three Rivers | 24.0% | 6.8%(+17.2)#87 | 6.4%(+17.6)#1,517 |
| 88. | Maxwell | 23.8% | 6.8%(+17.1)#88 | 6.4%(+17.5)#1,525 |
| 89. | Hamilton City | 23.8% | 6.8%(+17.0)#89 | 6.4%(+17.5)#1,526 |
| 90. | Fulton | 23.8% | 6.8%(+17.0)#90 | 6.4%(+17.5)#1,527 |
| 91. | Green Valley Cdp Solano County | 23.7% | 6.8%(+16.9)#91 | 6.4%(+17.4)#1,535 |
| 92. | East Nicolaus | 23.5% | 6.8%(+16.8)#92 | 6.4%(+17.2)#1,563 |
| 93. | Clearlake Oaks | 23.2% | 6.8%(+16.4)#93 | 6.4%(+16.9)#1,585 |
| 94. | Weaverville | 23.2% | 6.8%(+16.4)#94 | 6.4%(+16.8)#1,591 |
| 95. | Goshen | 23.0% | 6.8%(+16.2)#95 | 6.4%(+16.7)#1,621 |
| 96. | Lower Lake | 22.9% | 6.8%(+16.1)#96 | 6.4%(+16.5)#1,633 |
| 97. | Pasatiempo | 22.9% | 6.8%(+16.1)#97 | 6.4%(+16.5)#1,637 |
| 98. | Pine Mountain Club | 22.3% | 6.8%(+15.6)#98 | 6.4%(+16.0)#1,689 |
| 99. | Richfield | 22.2% | 6.8%(+15.5)#99 | 6.4%(+15.9)#1,722 |
| 100. | Winters | 22.0% | 6.8%(+15.2)#100 | 6.4%(+15.6)#1,753 |
Common Questions
What are the Top 10 Cities with the Highest Percentage of Population with a Degree in Bio, Nature & Agricultural in California?
Top 10 Cities with the Highest Percentage of Population with a Degree in Bio, Nature & Agricultural in California are:
#1
100.0%
#2
100.0%
#3
100.0%
#4
100.0%
#5
100.0%
#6
100.0%
#7
100.0%
#8
100.0%
#9
90.9%
#10
76.5%
What city has the Highest Percentage of Population with a Degree in Bio, Nature & Agricultural in California?
Victor has the Highest Percentage of Population with a Degree in Bio, Nature & Agricultural in California with 100.0%.
What is the Percentage of Population with a Degree in Bio, Nature & Agricultural in the State of California?
Percentage of Population with a Degree in Bio, Nature & Agricultural in California is 6.8%.
What is the Percentage of Population with a Degree in Bio, Nature & Agricultural in the United States?
Percentage of Population with a Degree in Bio, Nature & Agricultural in the United States is 6.4%.