Cities with the Highest Percentage of Population with a Degree in Physical and Health Sciences in California
RELATED REPORTS & OPTIONS
Physical and Health Sciences
California
Compare Cities
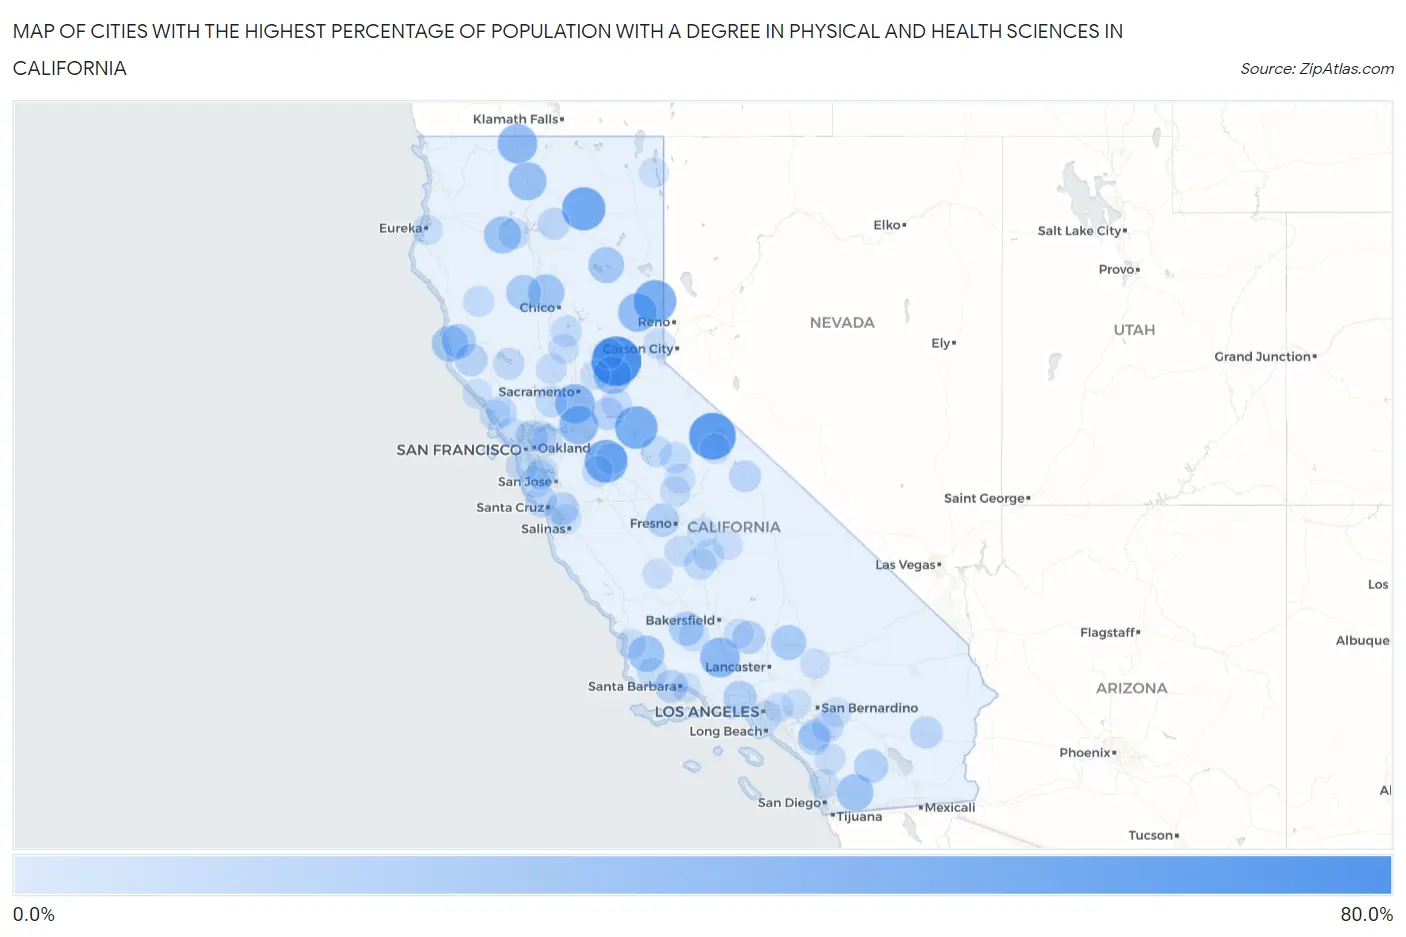
Map of Cities with the Highest Percentage of Population with a Degree in Physical and Health Sciences in California
0.0%
80.0%
Cities with the Highest Percentage of Population with a Degree in Physical and Health Sciences in California
| City | % Graduates | vs State | vs National | |
| 1. | Foresthill | 74.2% | 3.1%(+71.1)#1 | 3.1%(+71.1)#32 |
| 2. | Lee Vining | 64.5% | 3.1%(+61.4)#2 | 3.1%(+61.4)#45 |
| 3. | Franklin Cdp Sacramento County | 53.8% | 3.1%(+50.7)#3 | 3.1%(+50.7)#69 |
| 4. | Mcarthur | 52.9% | 3.1%(+49.8)#4 | 3.1%(+49.8)#72 |
| 5. | Rouse | 51.2% | 3.1%(+48.1)#5 | 3.1%(+48.1)#76 |
| 6. | Chilcoot Vinton | 50.0% | 3.1%(+46.9)#6 | 3.1%(+46.9)#86 |
| 7. | Vallecito | 50.0% | 3.1%(+46.9)#7 | 3.1%(+46.9)#88 |
| 8. | Knights Ferry | 46.2% | 3.1%(+43.0)#8 | 3.1%(+43.1)#112 |
| 9. | Lake Of The Woods | 40.1% | 3.1%(+37.0)#9 | 3.1%(+37.0)#134 |
| 10. | Hornbrook | 40.0% | 3.1%(+36.9)#10 | 3.1%(+36.9)#136 |
| 11. | Clarksburg | 39.6% | 3.1%(+36.5)#11 | 3.1%(+36.5)#146 |
| 12. | Terminous | 37.1% | 3.1%(+34.0)#12 | 3.1%(+34.0)#172 |
| 13. | Calpine | 36.8% | 3.1%(+33.7)#13 | 3.1%(+33.7)#178 |
| 14. | Weed | 34.4% | 3.1%(+31.3)#14 | 3.1%(+31.3)#198 |
| 15. | Coloma | 34.2% | 3.1%(+31.1)#15 | 3.1%(+31.1)#199 |
| 16. | Lewiston | 31.5% | 3.1%(+28.4)#16 | 3.1%(+28.4)#234 |
| 17. | Descanso | 30.4% | 3.1%(+27.3)#17 | 3.1%(+27.3)#250 |
| 18. | Garey | 28.6% | 3.1%(+25.5)#18 | 3.1%(+25.5)#295 |
| 19. | Vina | 28.5% | 3.1%(+25.3)#19 | 3.1%(+25.4)#296 |
| 20. | Albion | 28.2% | 3.1%(+25.1)#20 | 3.1%(+25.1)#298 |
| 21. | Westwood | 26.9% | 3.1%(+23.7)#21 | 3.1%(+23.8)#319 |
| 22. | Flournoy | 25.0% | 3.1%(+21.9)#22 | 3.1%(+21.9)#385 |
| 23. | North Edwards | 24.4% | 3.1%(+21.2)#23 | 3.1%(+21.3)#407 |
| 24. | Cold Springs Cdp El Dorado County | 23.6% | 3.1%(+20.5)#24 | 3.1%(+20.5)#421 |
| 25. | Bear Valley Cdp Alpine County | 22.8% | 3.1%(+19.7)#25 | 3.1%(+19.7)#444 |
| 26. | Stebbins | 22.6% | 3.1%(+19.5)#26 | 3.1%(+19.5)#450 |
| 27. | Derby Acres | 22.2% | 3.1%(+19.1)#27 | 3.1%(+19.1)#459 |
| 28. | Comptche | 22.2% | 3.1%(+19.1)#28 | 3.1%(+19.1)#465 |
| 29. | Borrego Springs | 20.6% | 3.1%(+17.5)#29 | 3.1%(+17.5)#520 |
| 30. | Millerton | 19.8% | 3.1%(+16.7)#30 | 3.1%(+16.7)#561 |
| 31. | Santa Susana | 19.6% | 3.1%(+16.5)#31 | 3.1%(+16.5)#567 |
| 32. | Tehachapi | 18.7% | 3.1%(+15.6)#32 | 3.1%(+15.6)#611 |
| 33. | Biola | 18.6% | 3.1%(+15.5)#33 | 3.1%(+15.5)#614 |
| 34. | Amesti | 18.0% | 3.1%(+14.9)#34 | 3.1%(+14.9)#639 |
| 35. | Isla Vista | 17.7% | 3.1%(+14.6)#35 | 3.1%(+14.6)#657 |
| 36. | Boonville | 17.6% | 3.1%(+14.5)#36 | 3.1%(+14.5)#658 |
| 37. | Camanche Village | 16.7% | 3.1%(+13.6)#37 | 3.1%(+13.6)#714 |
| 38. | Lakeland Village | 16.2% | 3.1%(+13.1)#38 | 3.1%(+13.1)#769 |
| 39. | Desert Center | 16.0% | 3.1%(+12.9)#39 | 3.1%(+12.9)#790 |
| 40. | University Of California-Santa Barbara | 15.4% | 3.1%(+12.3)#40 | 3.1%(+12.3)#822 |
| 41. | Bonny Doon | 15.1% | 3.1%(+12.0)#41 | 3.1%(+12.0)#855 |
| 42. | Montgomery Creek | 14.9% | 3.1%(+11.8)#42 | 3.1%(+11.8)#884 |
| 43. | Warm Springs | 14.8% | 3.1%(+11.7)#43 | 3.1%(+11.7)#891 |
| 44. | Rollingwood | 14.6% | 3.1%(+11.5)#44 | 3.1%(+11.5)#916 |
| 45. | Round Valley | 14.3% | 3.1%(+11.2)#45 | 3.1%(+11.2)#947 |
| 46. | Matheny | 14.0% | 3.1%(+10.9)#46 | 3.1%(+10.9)#988 |
| 47. | Clearlake Riviera | 13.5% | 3.1%(+10.4)#47 | 3.1%(+10.4)#1,039 |
| 48. | Lakeview | 13.3% | 3.1%(+10.2)#48 | 3.1%(+10.2)#1,067 |
| 49. | Empire | 13.0% | 3.1%(+9.93)#49 | 3.1%(+9.94)#1,089 |
| 50. | Allendale | 13.0% | 3.1%(+9.92)#50 | 3.1%(+9.94)#1,100 |
| 51. | El Portal | 13.0% | 3.1%(+9.84)#51 | 3.1%(+9.85)#1,110 |
| 52. | La Honda | 12.8% | 3.1%(+9.70)#52 | 3.1%(+9.71)#1,127 |
| 53. | Greeley Hill | 12.7% | 3.1%(+9.61)#53 | 3.1%(+9.63)#1,132 |
| 54. | Grangeville | 12.5% | 3.1%(+9.38)#54 | 3.1%(+9.40)#1,159 |
| 55. | Biggs | 12.4% | 3.1%(+9.29)#55 | 3.1%(+9.30)#1,172 |
| 56. | French Gulch | 12.1% | 3.1%(+8.95)#56 | 3.1%(+8.97)#1,212 |
| 57. | Montara | 11.9% | 3.1%(+8.78)#57 | 3.1%(+8.80)#1,235 |
| 58. | Covelo | 11.7% | 3.1%(+8.54)#58 | 3.1%(+8.55)#1,272 |
| 59. | Maywood | 11.6% | 3.1%(+8.51)#59 | 3.1%(+8.52)#1,279 |
| 60. | Patterson | 11.6% | 3.1%(+8.49)#60 | 3.1%(+8.51)#1,280 |
| 61. | Dillon Beach | 11.5% | 3.1%(+8.40)#61 | 3.1%(+8.41)#1,293 |
| 62. | Farmersville | 11.5% | 3.1%(+8.36)#62 | 3.1%(+8.37)#1,300 |
| 63. | Dunnigan | 11.3% | 3.1%(+8.16)#63 | 3.1%(+8.17)#1,328 |
| 64. | Shell Ridge | 11.2% | 3.1%(+8.13)#64 | 3.1%(+8.14)#1,334 |
| 65. | Colfax | 11.0% | 3.1%(+7.85)#65 | 3.1%(+7.86)#1,381 |
| 66. | El Sobrante Cdp Riverside County | 10.9% | 3.1%(+7.79)#66 | 3.1%(+7.80)#1,388 |
| 67. | East Palo Alto | 10.8% | 3.1%(+7.73)#67 | 3.1%(+7.74)#1,406 |
| 68. | Bloomfield | 10.8% | 3.1%(+7.65)#68 | 3.1%(+7.67)#1,416 |
| 69. | Orange Cove | 10.7% | 3.1%(+7.62)#69 | 3.1%(+7.64)#1,418 |
| 70. | Pala | 10.7% | 3.1%(+7.60)#70 | 3.1%(+7.61)#1,421 |
| 71. | Buellton | 10.5% | 3.1%(+7.42)#71 | 3.1%(+7.44)#1,458 |
| 72. | Ahwahnee | 10.4% | 3.1%(+7.29)#72 | 3.1%(+7.30)#1,499 |
| 73. | Meyers | 10.4% | 3.1%(+7.26)#73 | 3.1%(+7.28)#1,504 |
| 74. | Yosemite Lakes | 10.2% | 3.1%(+7.11)#74 | 3.1%(+7.13)#1,553 |
| 75. | June Lake | 10.2% | 3.1%(+7.11)#75 | 3.1%(+7.13)#1,556 |
| 76. | Amador City | 10.0% | 3.1%(+6.88)#76 | 3.1%(+6.90)#1,613 |
| 77. | Carnelian Bay | 10.0% | 3.1%(+6.85)#77 | 3.1%(+6.87)#1,627 |
| 78. | Cutten | 9.8% | 3.1%(+6.67)#78 | 3.1%(+6.68)#1,657 |
| 79. | Sutter | 9.5% | 3.1%(+6.42)#79 | 3.1%(+6.44)#1,713 |
| 80. | Taft Heights | 9.5% | 3.1%(+6.41)#80 | 3.1%(+6.42)#1,716 |
| 81. | Bear Valley Springs | 9.3% | 3.1%(+6.23)#81 | 3.1%(+6.25)#1,769 |
| 82. | Cedar Flat | 9.3% | 3.1%(+6.20)#82 | 3.1%(+6.22)#1,777 |
| 83. | Three Rivers | 9.1% | 3.1%(+5.99)#83 | 3.1%(+6.01)#1,827 |
| 84. | Avenal | 9.1% | 3.1%(+5.98)#84 | 3.1%(+5.99)#1,830 |
| 85. | Baywood Park | 9.1% | 3.1%(+5.98)#85 | 3.1%(+5.99)#1,834 |
| 86. | Elkhorn | 9.1% | 3.1%(+5.94)#86 | 3.1%(+5.96)#1,868 |
| 87. | Silver Lakes | 9.1% | 3.1%(+5.94)#87 | 3.1%(+5.95)#1,869 |
| 88. | San Geronimo | 9.1% | 3.1%(+5.94)#88 | 3.1%(+5.95)#1,870 |
| 89. | Cedarville | 9.0% | 3.1%(+5.90)#89 | 3.1%(+5.92)#1,886 |
| 90. | Woodlands | 9.0% | 3.1%(+5.86)#90 | 3.1%(+5.87)#1,899 |
| 91. | Loomis | 8.8% | 3.1%(+5.70)#91 | 3.1%(+5.71)#1,953 |
| 92. | Fairbanks Ranch | 8.7% | 3.1%(+5.54)#92 | 3.1%(+5.55)#2,003 |
| 93. | Timber Cove | 8.6% | 3.1%(+5.49)#93 | 3.1%(+5.50)#2,023 |
| 94. | Camp Pendleton Mainside | 8.5% | 3.1%(+5.40)#94 | 3.1%(+5.42)#2,046 |
| 95. | San Antonio Heights | 8.5% | 3.1%(+5.35)#95 | 3.1%(+5.37)#2,066 |
| 96. | Oak Glen | 8.5% | 3.1%(+5.35)#96 | 3.1%(+5.37)#2,067 |
| 97. | Alhambra Valley | 8.4% | 3.1%(+5.24)#97 | 3.1%(+5.26)#2,092 |
| 98. | Summerland | 8.1% | 3.1%(+4.95)#98 | 3.1%(+4.96)#2,206 |
| 99. | Irwindale | 8.0% | 3.1%(+4.91)#99 | 3.1%(+4.92)#2,221 |
| 100. | Stanford | 8.0% | 3.1%(+4.89)#100 | 3.1%(+4.91)#2,223 |
Common Questions
What are the Top 10 Cities with the Highest Percentage of Population with a Degree in Physical and Health Sciences in California?
Top 10 Cities with the Highest Percentage of Population with a Degree in Physical and Health Sciences in California are:
#1
74.2%
#2
64.5%
#3
52.9%
#4
51.2%
#5
50.0%
#6
50.0%
#7
40.1%
#8
40.0%
#9
39.6%
#10
37.1%
What city has the Highest Percentage of Population with a Degree in Physical and Health Sciences in California?
Foresthill has the Highest Percentage of Population with a Degree in Physical and Health Sciences in California with 74.2%.
What is the Percentage of Population with a Degree in Physical and Health Sciences in the State of California?
Percentage of Population with a Degree in Physical and Health Sciences in California is 3.1%.
What is the Percentage of Population with a Degree in Physical and Health Sciences in the United States?
Percentage of Population with a Degree in Physical and Health Sciences in the United States is 3.1%.