Cities with the Most Immigrants from Cameroon in California
RELATED REPORTS & OPTIONS
Cameroon
California
Compare Cities
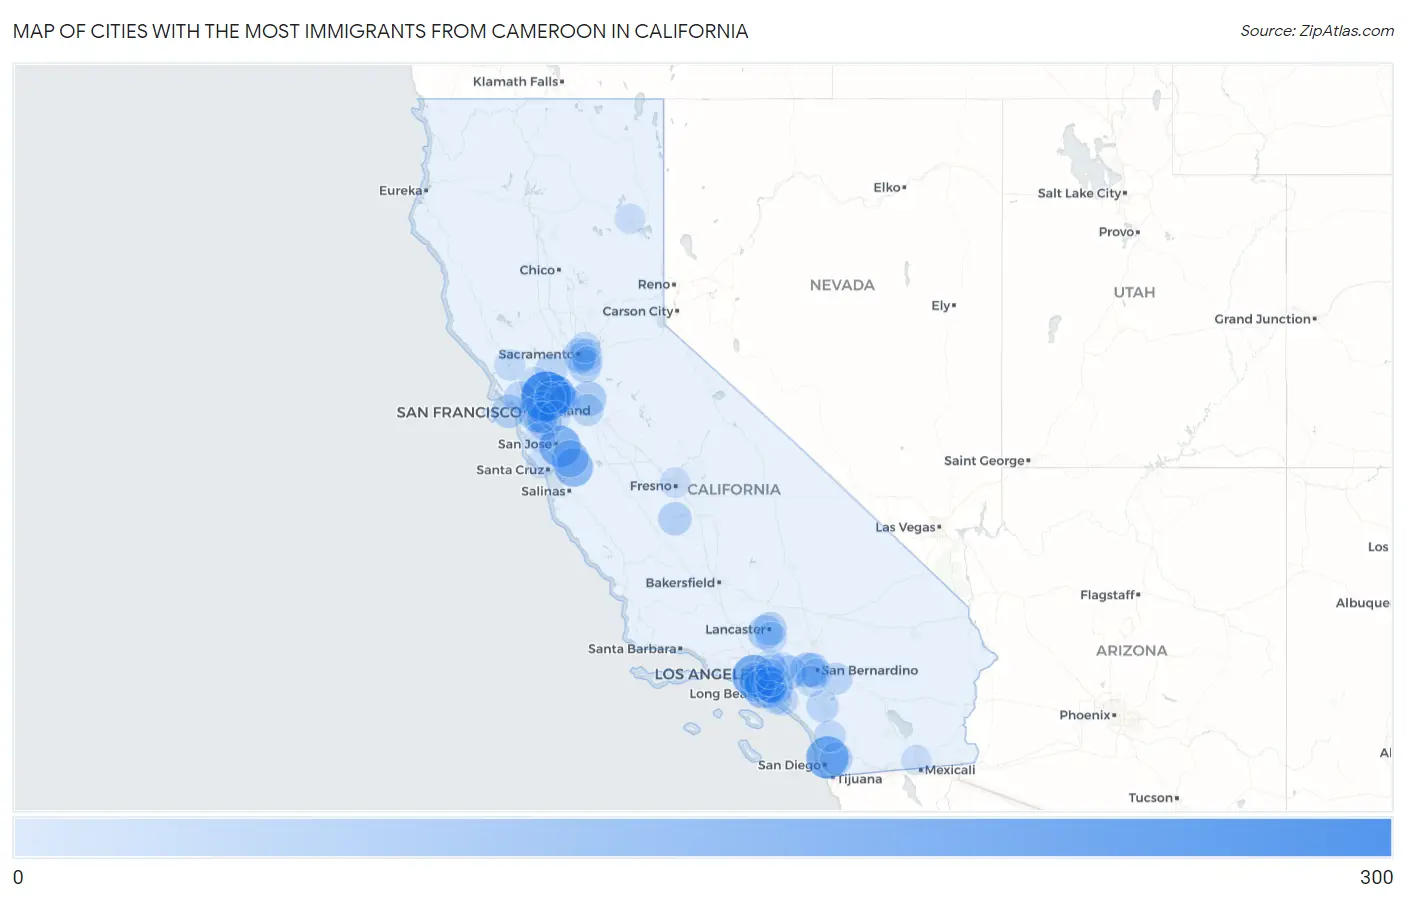
Map of Cities with the Most Immigrants from Cameroon in California
0
300

Cities with the Most Immigrants from Cameroon in California
| City | Cameroon | vs State | vs National | |
| 1. | Pacheco | 289 | 3,174(9.11%)#1 | 82,690(0.35%)#50 |
| 2. | Los Angeles | 188 | 3,174(5.92%)#2 | 82,690(0.23%)#96 |
| 3. | San Diego | 178 | 3,174(5.61%)#3 | 82,690(0.22%)#104 |
| 4. | San Jose | 162 | 3,174(5.10%)#4 | 82,690(0.20%)#113 |
| 5. | Pittsburg | 146 | 3,174(4.60%)#5 | 82,690(0.18%)#126 |
| 6. | Carson | 125 | 3,174(3.94%)#6 | 82,690(0.15%)#147 |
| 7. | Gilroy | 124 | 3,174(3.91%)#7 | 82,690(0.15%)#149 |
| 8. | Cerritos | 116 | 3,174(3.65%)#8 | 82,690(0.14%)#159 |
| 9. | Hawthorne | 105 | 3,174(3.31%)#9 | 82,690(0.13%)#175 |
| 10. | Morgan Hill | 103 | 3,174(3.25%)#10 | 82,690(0.12%)#177 |
| 11. | Oakland | 86 | 3,174(2.71%)#11 | 82,690(0.10%)#207 |
| 12. | Stockton | 68 | 3,174(2.14%)#12 | 82,690(0.08%)#248 |
| 13. | Fontana | 68 | 3,174(2.14%)#13 | 82,690(0.08%)#250 |
| 14. | Inglewood | 67 | 3,174(2.11%)#14 | 82,690(0.08%)#252 |
| 15. | Bellflower | 65 | 3,174(2.05%)#15 | 82,690(0.08%)#258 |
| 16. | Quartz Hill | 65 | 3,174(2.05%)#16 | 82,690(0.08%)#259 |
| 17. | Rialto | 58 | 3,174(1.83%)#17 | 82,690(0.07%)#277 |
| 18. | Pomona | 55 | 3,174(1.73%)#18 | 82,690(0.07%)#288 |
| 19. | San Francisco | 52 | 3,174(1.64%)#19 | 82,690(0.06%)#303 |
| 20. | Westmont | 50 | 3,174(1.58%)#20 | 82,690(0.06%)#309 |
| 21. | Sacramento | 49 | 3,174(1.54%)#21 | 82,690(0.06%)#313 |
| 22. | Lancaster | 47 | 3,174(1.48%)#22 | 82,690(0.06%)#320 |
| 23. | Lemoore | 47 | 3,174(1.48%)#23 | 82,690(0.06%)#322 |
| 24. | Hayward | 46 | 3,174(1.45%)#24 | 82,690(0.06%)#323 |
| 25. | Elk Grove | 45 | 3,174(1.42%)#25 | 82,690(0.05%)#328 |
| 26. | San Leandro | 42 | 3,174(1.32%)#26 | 82,690(0.05%)#342 |
| 27. | El Cajon | 38 | 3,174(1.20%)#27 | 82,690(0.05%)#362 |
| 28. | Vacaville | 33 | 3,174(1.04%)#28 | 82,690(0.04%)#393 |
| 29. | Moraga | 33 | 3,174(1.04%)#29 | 82,690(0.04%)#397 |
| 30. | Murrieta | 32 | 3,174(1.01%)#30 | 82,690(0.04%)#400 |
| 31. | La Riviera | 30 | 3,174(0.95%)#31 | 82,690(0.04%)#414 |
| 32. | Cherry Valley | 30 | 3,174(0.95%)#32 | 82,690(0.04%)#415 |
| 33. | Brentwood | 28 | 3,174(0.88%)#33 | 82,690(0.03%)#425 |
| 34. | San Rafael | 28 | 3,174(0.88%)#34 | 82,690(0.03%)#426 |
| 35. | Lathrop | 28 | 3,174(0.88%)#35 | 82,690(0.03%)#427 |
| 36. | Long Beach | 27 | 3,174(0.85%)#36 | 82,690(0.03%)#430 |
| 37. | East San Gabriel | 27 | 3,174(0.85%)#37 | 82,690(0.03%)#434 |
| 38. | Escondido | 26 | 3,174(0.82%)#38 | 82,690(0.03%)#437 |
| 39. | Antioch | 26 | 3,174(0.82%)#39 | 82,690(0.03%)#438 |
| 40. | Costa Mesa | 20 | 3,174(0.63%)#40 | 82,690(0.02%)#490 |
| 41. | Ashland | 20 | 3,174(0.63%)#41 | 82,690(0.02%)#496 |
| 42. | Cudahy | 20 | 3,174(0.63%)#42 | 82,690(0.02%)#497 |
| 43. | Palmdale | 18 | 3,174(0.57%)#43 | 82,690(0.02%)#514 |
| 44. | Santa Rosa | 17 | 3,174(0.54%)#44 | 82,690(0.02%)#524 |
| 45. | Culver City | 15 | 3,174(0.47%)#45 | 82,690(0.02%)#557 |
| 46. | American Canyon | 15 | 3,174(0.47%)#46 | 82,690(0.02%)#560 |
| 47. | Lemon Hill | 15 | 3,174(0.47%)#47 | 82,690(0.02%)#562 |
| 48. | Riverside | 14 | 3,174(0.44%)#48 | 82,690(0.02%)#568 |
| 49. | Huntington Beach | 14 | 3,174(0.44%)#49 | 82,690(0.02%)#570 |
| 50. | Dublin | 14 | 3,174(0.44%)#50 | 82,690(0.02%)#571 |
| 51. | Concord | 13 | 3,174(0.41%)#51 | 82,690(0.02%)#579 |
| 52. | North Highlands | 13 | 3,174(0.41%)#52 | 82,690(0.02%)#582 |
| 53. | Hawaiian Gardens | 13 | 3,174(0.41%)#53 | 82,690(0.02%)#586 |
| 54. | Lakewood | 12 | 3,174(0.38%)#54 | 82,690(0.01%)#594 |
| 55. | Gardena | 12 | 3,174(0.38%)#55 | 82,690(0.01%)#597 |
| 56. | Pasadena | 10 | 3,174(0.32%)#56 | 82,690(0.01%)#615 |
| 57. | Colton | 10 | 3,174(0.32%)#57 | 82,690(0.01%)#618 |
| 58. | Azusa | 6 | 3,174(0.19%)#58 | 82,690(0.01%)#666 |
| 59. | Fresno | 5 | 3,174(0.16%)#59 | 82,690(0.01%)#674 |
| 60. | Susanville | 4 | 3,174(0.13%)#60 | 82,690(0.00%)#690 |
| 61. | El Centro | 3 | 3,174(0.09%)#61 | 82,690(0.00%)#697 |
| 62. | Stanford | 3 | 3,174(0.09%)#62 | 82,690(0.00%)#699 |
| 63. | Downey | 1 | 3,174(0.03%)#63 | 82,690(0.00%)#719 |
| 64. | Monterey Park | 1 | 3,174(0.03%)#64 | 82,690(0.00%)#721 |
| 65. | Vineyard | 1 | 3,174(0.03%)#65 | 82,690(0.00%)#722 |
| 66. | Bonny Doon | 1 | 3,174(0.03%)#66 | 82,690(0.00%)#728 |
Common Questions
What are the Top 10 Cities with the Most Immigrants from Cameroon in California?
Top 10 Cities with the Most Immigrants from Cameroon in California are:
#1
289
#2
188
#3
178
#4
162
#5
146
#6
125
#7
124
#8
116
#9
105
#10
103
What city has the Most Immigrants from Cameroon in California?
Pacheco has the Most Immigrants from Cameroon in California with 289.
What is the Total Immigrants from Cameroon in the State of California?
Total Immigrants from Cameroon in California is 3,174.
What is the Total Immigrants from Cameroon in the United States?
Total Immigrants from Cameroon in the United States is 82,690.