Zip Codes with the Highest Percentage of Population Employed in Installation, Maintenance & Repair in Daly City, CA
RELATED REPORTS & OPTIONS
Installation, Maintenance & Repair
Daly City
Compare Zip Codes
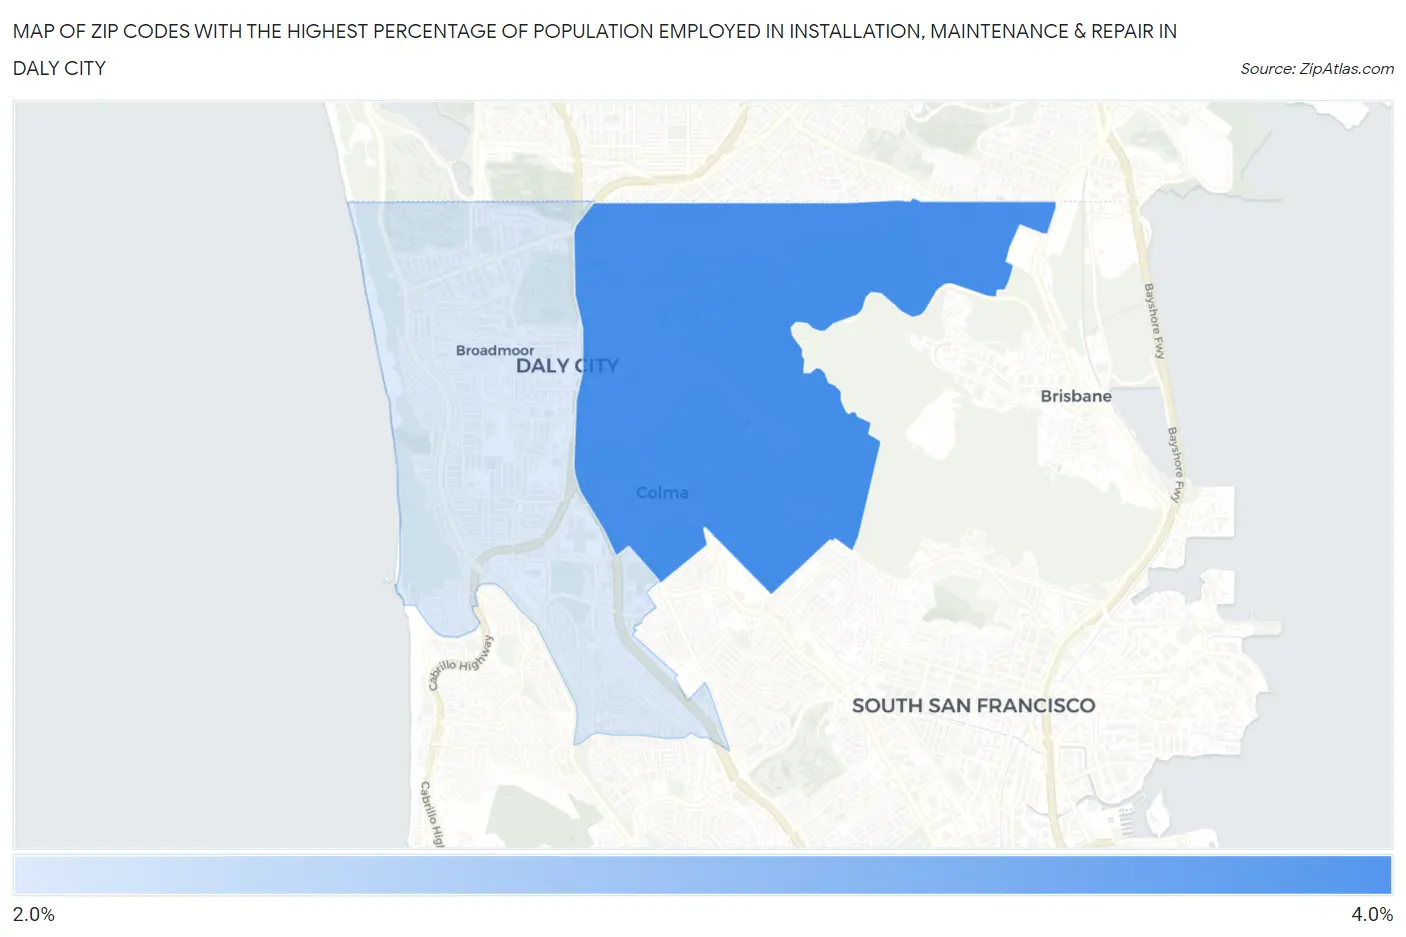
Map of Zip Codes with the Highest Percentage of Population Employed in Installation, Maintenance & Repair in Daly City
2.2%
3.1%
Zip Codes with the Highest Percentage of Population Employed in Installation, Maintenance & Repair in Daly City, CA
| Zip Code | % Employed | vs State | vs National | |
| 1. | 94014 | 3.1% | 2.6%(+0.498)#579 | 3.1%(-0.013)#16,746 |
| 2. | 94015 | 2.2% | 2.6%(-0.385)#921 | 3.1%(-0.896)#21,215 |
1
Common Questions
What are the Top Zip Codes with the Highest Percentage of Population Employed in Installation, Maintenance & Repair in Daly City, CA?
Top Zip Codes with the Highest Percentage of Population Employed in Installation, Maintenance & Repair in Daly City, CA are:
What zip code has the Highest Percentage of Population Employed in Installation, Maintenance & Repair in Daly City, CA?
94014 has the Highest Percentage of Population Employed in Installation, Maintenance & Repair in Daly City, CA with 3.1%.
What is the Percentage of Population Employed in Installation, Maintenance & Repair in Daly City, CA?
Percentage of Population Employed in Installation, Maintenance & Repair in Daly City is 2.6%.
What is the Percentage of Population Employed in Installation, Maintenance & Repair in California?
Percentage of Population Employed in Installation, Maintenance & Repair in California is 2.6%.
What is the Percentage of Population Employed in Installation, Maintenance & Repair in the United States?
Percentage of Population Employed in Installation, Maintenance & Repair in the United States is 3.1%.