Cities with the Highest Percentage of Population Employed in Legal Services & Support in California
RELATED REPORTS & OPTIONS
Legal Services & Support
California
Compare Cities
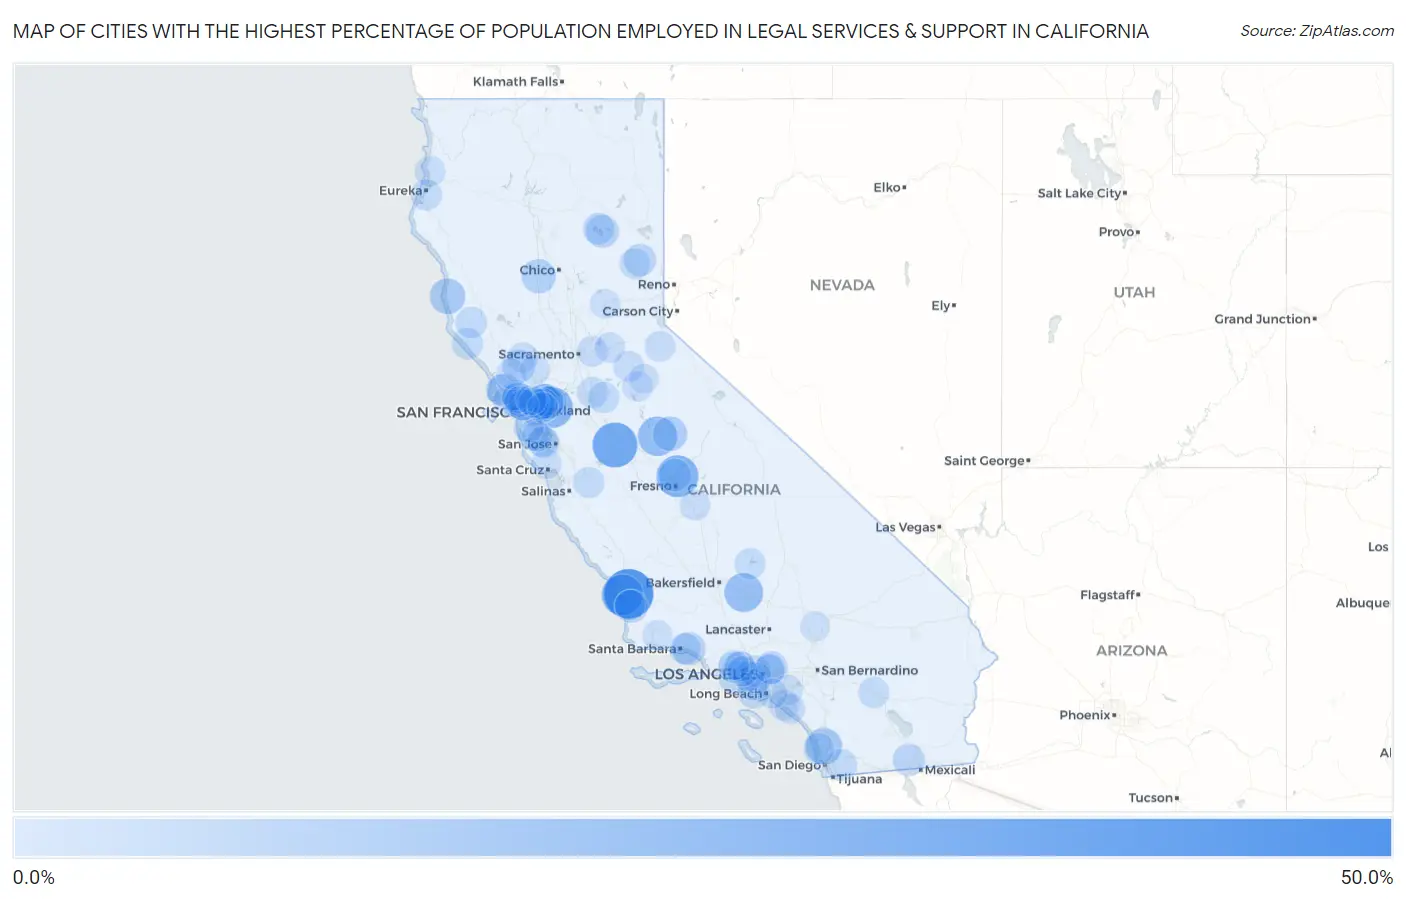
Map of Cities with the Highest Percentage of Population Employed in Legal Services & Support in California
0.0%
50.0%
Cities with the Highest Percentage of Population Employed in Legal Services & Support in California
| City | % Employed | vs State | vs National | |
| 1. | Rumsey | 40.4% | 1.3%(+39.1)#1 | 1.2%(+39.2)#14 |
| 2. | Edna | 37.1% | 1.3%(+35.8)#2 | 1.2%(+35.9)#16 |
| 3. | Stevinson | 28.8% | 1.3%(+27.6)#3 | 1.2%(+27.7)#27 |
| 4. | Fort Washington | 23.7% | 1.3%(+22.5)#4 | 1.2%(+22.6)#40 |
| 5. | Avila Beach | 22.9% | 1.3%(+21.6)#5 | 1.2%(+21.7)#45 |
| 6. | Diablo | 21.6% | 1.3%(+20.4)#6 | 1.2%(+20.4)#51 |
| 7. | Catheys Valley | 19.4% | 1.3%(+18.1)#7 | 1.2%(+18.2)#61 |
| 8. | Keene | 18.6% | 1.3%(+17.3)#8 | 1.2%(+17.4)#72 |
| 9. | Acalanes Ridge | 15.7% | 1.3%(+14.4)#9 | 1.2%(+14.5)#97 |
| 10. | Fairbanks Ranch | 14.7% | 1.3%(+13.5)#10 | 1.2%(+13.5)#106 |
| 11. | Caspar | 13.0% | 1.3%(+11.7)#11 | 1.2%(+11.8)#142 |
| 12. | Alto | 12.3% | 1.3%(+11.1)#12 | 1.2%(+11.1)#153 |
| 13. | Bootjack | 11.0% | 1.3%(+9.79)#13 | 1.2%(+9.87)#182 |
| 14. | Artois | 10.7% | 1.3%(+9.46)#14 | 1.2%(+9.53)#192 |
| 15. | Toro Canyon | 9.5% | 1.3%(+8.24)#15 | 1.2%(+8.31)#251 |
| 16. | Cedar Flat | 9.5% | 1.3%(+8.23)#16 | 1.2%(+8.30)#252 |
| 17. | Point Reyes Station | 9.1% | 1.3%(+7.79)#17 | 1.2%(+7.87)#269 |
| 18. | Woodlands | 8.9% | 1.3%(+7.63)#18 | 1.2%(+7.71)#279 |
| 19. | East Shore | 8.8% | 1.3%(+7.57)#19 | 1.2%(+7.64)#283 |
| 20. | North Gate | 8.8% | 1.3%(+7.52)#20 | 1.2%(+7.59)#287 |
| 21. | Kenwood | 8.3% | 1.3%(+7.05)#21 | 1.2%(+7.13)#321 |
| 22. | Malibu | 8.3% | 1.3%(+6.99)#22 | 1.2%(+7.07)#322 |
| 23. | Rolling Hills | 8.2% | 1.3%(+6.94)#23 | 1.2%(+7.02)#327 |
| 24. | San Pasqual | 8.2% | 1.3%(+6.89)#24 | 1.2%(+6.97)#331 |
| 25. | Piedmont | 8.0% | 1.3%(+6.70)#25 | 1.2%(+6.78)#343 |
| 26. | Beckwourth | 7.8% | 1.3%(+6.58)#26 | 1.2%(+6.65)#348 |
| 27. | Seeley | 7.7% | 1.3%(+6.48)#27 | 1.2%(+6.55)#358 |
| 28. | Reliez Valley | 7.4% | 1.3%(+6.12)#28 | 1.2%(+6.19)#393 |
| 29. | Elfin Forest | 7.3% | 1.3%(+6.05)#29 | 1.2%(+6.12)#403 |
| 30. | Palos Verdes Estates | 7.3% | 1.3%(+6.03)#30 | 1.2%(+6.11)#404 |
| 31. | Shell Ridge | 7.3% | 1.3%(+6.03)#31 | 1.2%(+6.10)#405 |
| 32. | Orinda | 7.2% | 1.3%(+5.93)#32 | 1.2%(+6.01)#422 |
| 33. | Lake Almanor Peninsula | 6.7% | 1.3%(+5.47)#33 | 1.2%(+5.55)#467 |
| 34. | Ross | 6.5% | 1.3%(+5.28)#34 | 1.2%(+5.35)#502 |
| 35. | Beverly Hills | 6.5% | 1.3%(+5.26)#35 | 1.2%(+5.34)#505 |
| 36. | Jamul | 6.5% | 1.3%(+5.22)#36 | 1.2%(+5.30)#514 |
| 37. | Sea Ranch | 6.3% | 1.3%(+5.03)#37 | 1.2%(+5.10)#547 |
| 38. | Emerald Lake Hills | 6.3% | 1.3%(+5.01)#38 | 1.2%(+5.08)#553 |
| 39. | Boonville | 6.2% | 1.3%(+4.99)#39 | 1.2%(+5.07)#559 |
| 40. | La Canada Flintridge | 6.2% | 1.3%(+4.99)#40 | 1.2%(+5.07)#562 |
| 41. | Montecito | 6.2% | 1.3%(+4.90)#41 | 1.2%(+4.98)#572 |
| 42. | Loyola | 6.0% | 1.3%(+4.76)#42 | 1.2%(+4.83)#597 |
| 43. | Del Dios | 6.0% | 1.3%(+4.76)#43 | 1.2%(+4.83)#598 |
| 44. | Belvedere | 6.0% | 1.3%(+4.72)#44 | 1.2%(+4.79)#608 |
| 45. | Morada | 6.0% | 1.3%(+4.69)#45 | 1.2%(+4.77)#613 |
| 46. | Pine Hills | 5.9% | 1.3%(+4.66)#46 | 1.2%(+4.73)#624 |
| 47. | Bolinas | 5.9% | 1.3%(+4.65)#47 | 1.2%(+4.73)#625 |
| 48. | Lake Isabella | 5.9% | 1.3%(+4.60)#48 | 1.2%(+4.68)#630 |
| 49. | Delleker | 5.8% | 1.3%(+4.54)#49 | 1.2%(+4.61)#641 |
| 50. | Calabasas | 5.8% | 1.3%(+4.51)#50 | 1.2%(+4.58)#648 |
| 51. | Peters | 5.7% | 1.3%(+4.48)#51 | 1.2%(+4.55)#653 |
| 52. | Tres Pinos | 5.6% | 1.3%(+4.33)#52 | 1.2%(+4.41)#690 |
| 53. | Desert Palms | 5.6% | 1.3%(+4.31)#53 | 1.2%(+4.38)#697 |
| 54. | Agoura Hills | 5.5% | 1.3%(+4.22)#54 | 1.2%(+4.29)#713 |
| 55. | Del Mar | 5.4% | 1.3%(+4.16)#55 | 1.2%(+4.24)#726 |
| 56. | South Pasadena | 5.4% | 1.3%(+4.15)#56 | 1.2%(+4.22)#729 |
| 57. | Green Valley Cdp Los Angeles County | 5.2% | 1.3%(+3.99)#57 | 1.2%(+4.06)#769 |
| 58. | Red Corral | 5.2% | 1.3%(+3.97)#58 | 1.2%(+4.04)#776 |
| 59. | Ladera Heights | 5.2% | 1.3%(+3.95)#59 | 1.2%(+4.02)#787 |
| 60. | Manhattan Beach | 5.1% | 1.3%(+3.80)#60 | 1.2%(+3.87)#827 |
| 61. | Lafayette | 5.0% | 1.3%(+3.77)#61 | 1.2%(+3.84)#835 |
| 62. | Los Altos Hills | 4.9% | 1.3%(+3.66)#62 | 1.2%(+3.74)#859 |
| 63. | Mill Valley | 4.9% | 1.3%(+3.65)#63 | 1.2%(+3.73)#861 |
| 64. | Gold River | 4.9% | 1.3%(+3.65)#64 | 1.2%(+3.72)#865 |
| 65. | Kirkwood | 4.9% | 1.3%(+3.64)#65 | 1.2%(+3.72)#868 |
| 66. | Newport Beach | 4.9% | 1.3%(+3.63)#66 | 1.2%(+3.70)#878 |
| 67. | London | 4.9% | 1.3%(+3.60)#67 | 1.2%(+3.67)#890 |
| 68. | Mount Hermon | 4.8% | 1.3%(+3.58)#68 | 1.2%(+3.65)#896 |
| 69. | Deer Park | 4.8% | 1.3%(+3.53)#69 | 1.2%(+3.61)#913 |
| 70. | Villa Park | 4.8% | 1.3%(+3.53)#70 | 1.2%(+3.60)#916 |
| 71. | Murphys | 4.7% | 1.3%(+3.48)#71 | 1.2%(+3.55)#931 |
| 72. | Sleepy Hollow | 4.7% | 1.3%(+3.44)#72 | 1.2%(+3.52)#947 |
| 73. | Laguna Beach | 4.7% | 1.3%(+3.41)#73 | 1.2%(+3.49)#958 |
| 74. | Santa Monica | 4.7% | 1.3%(+3.41)#74 | 1.2%(+3.48)#959 |
| 75. | Westhaven Moonstone | 4.7% | 1.3%(+3.40)#75 | 1.2%(+3.47)#963 |
| 76. | Inverness | 4.6% | 1.3%(+3.36)#76 | 1.2%(+3.44)#973 |
| 77. | Shingle Springs | 4.6% | 1.3%(+3.33)#77 | 1.2%(+3.40)#987 |
| 78. | Tiburon | 4.6% | 1.3%(+3.33)#78 | 1.2%(+3.40)#988 |
| 79. | San Anselmo | 4.6% | 1.3%(+3.32)#79 | 1.2%(+3.40)#991 |
| 80. | West Menlo Park | 4.6% | 1.3%(+3.30)#80 | 1.2%(+3.38)#998 |
| 81. | San Marino | 4.5% | 1.3%(+3.25)#81 | 1.2%(+3.32)#1,013 |
| 82. | Cold Springs Cdp El Dorado County | 4.5% | 1.3%(+3.20)#82 | 1.2%(+3.27)#1,027 |
| 83. | Penngrove | 4.5% | 1.3%(+3.19)#83 | 1.2%(+3.27)#1,029 |
| 84. | Hidden Hills | 4.4% | 1.3%(+3.14)#84 | 1.2%(+3.22)#1,045 |
| 85. | Baywood Park | 4.4% | 1.3%(+3.14)#85 | 1.2%(+3.22)#1,046 |
| 86. | Topanga | 4.4% | 1.3%(+3.10)#86 | 1.2%(+3.18)#1,060 |
| 87. | Callender | 4.4% | 1.3%(+3.09)#87 | 1.2%(+3.17)#1,065 |
| 88. | Corte Madera | 4.3% | 1.3%(+3.08)#88 | 1.2%(+3.16)#1,077 |
| 89. | Hillsborough | 4.3% | 1.3%(+3.04)#89 | 1.2%(+3.11)#1,089 |
| 90. | Kensington | 4.3% | 1.3%(+3.00)#90 | 1.2%(+3.08)#1,104 |
| 91. | Oak Park | 4.3% | 1.3%(+2.99)#91 | 1.2%(+3.07)#1,110 |
| 92. | Silverado Resort | 4.2% | 1.3%(+2.97)#92 | 1.2%(+3.05)#1,117 |
| 93. | Nevada City | 4.2% | 1.3%(+2.96)#93 | 1.2%(+3.04)#1,124 |
| 94. | Seal Beach | 4.2% | 1.3%(+2.95)#94 | 1.2%(+3.03)#1,131 |
| 95. | East Richmond Heights | 4.1% | 1.3%(+2.85)#95 | 1.2%(+2.92)#1,177 |
| 96. | Santa Ynez | 4.1% | 1.3%(+2.81)#96 | 1.2%(+2.89)#1,197 |
| 97. | Moraga | 4.0% | 1.3%(+2.78)#97 | 1.2%(+2.85)#1,213 |
| 98. | Rancho Mission Viejo | 4.0% | 1.3%(+2.75)#98 | 1.2%(+2.82)#1,226 |
| 99. | Arnold | 4.0% | 1.3%(+2.72)#99 | 1.2%(+2.79)#1,245 |
| 100. | Silver Lakes | 4.0% | 1.3%(+2.70)#100 | 1.2%(+2.78)#1,252 |
Common Questions
What are the Top 10 Cities with the Highest Percentage of Population Employed in Legal Services & Support in California?
Top 10 Cities with the Highest Percentage of Population Employed in Legal Services & Support in California are:
#1
37.1%
#2
28.8%
#3
23.7%
#4
22.9%
#5
21.6%
#6
19.4%
#7
18.6%
#8
15.7%
#9
14.7%
#10
13.0%
What city has the Highest Percentage of Population Employed in Legal Services & Support in California?
Edna has the Highest Percentage of Population Employed in Legal Services & Support in California with 37.1%.
What is the Percentage of Population Employed in Legal Services & Support in the State of California?
Percentage of Population Employed in Legal Services & Support in California is 1.3%.
What is the Percentage of Population Employed in Legal Services & Support in the United States?
Percentage of Population Employed in Legal Services & Support in the United States is 1.2%.