Cities with the Highest Percentage of Population Employed in Education, Arts & Media in California
RELATED REPORTS & OPTIONS
Education, Arts & Media
California
Compare Cities
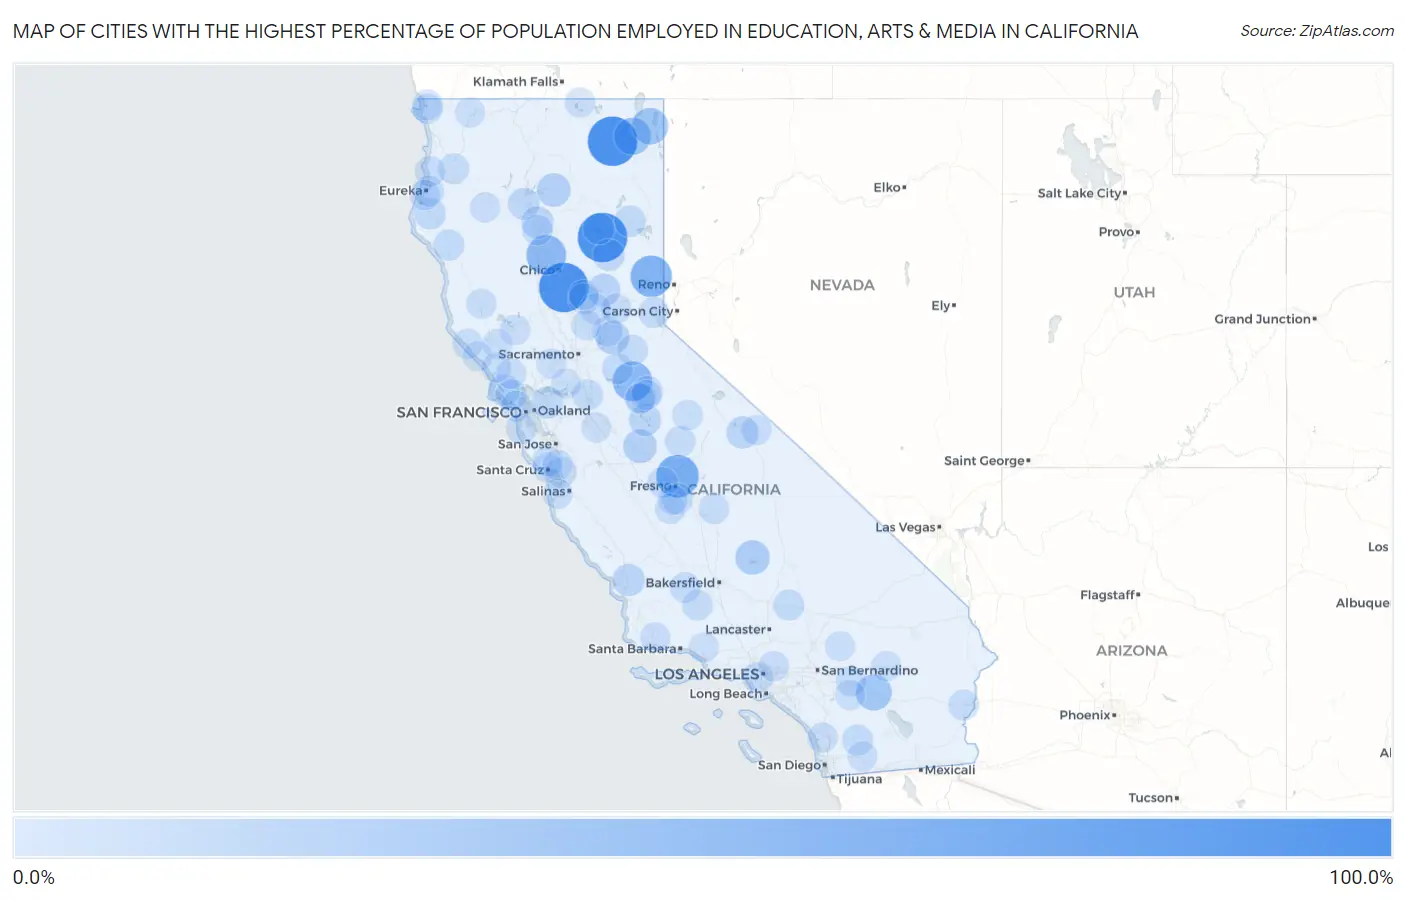
Map of Cities with the Highest Percentage of Population Employed in Education, Arts & Media in California
0.0%
100.0%
Cities with the Highest Percentage of Population Employed in Education, Arts & Media in California
| City | % Employed | vs State | vs National | |
| 1. | Canby | 100.0% | 1.7%(+98.3)#1 | 1.8%(+98.2)#1 |
| 2. | Richvale | 100.0% | 1.7%(+98.3)#2 | 1.8%(+98.2)#2 |
| 3. | Canyondam | 100.0% | 1.7%(+98.3)#3 | 1.8%(+98.2)#14 |
| 4. | Fort Washington | 65.0% | 1.7%(+63.3)#4 | 1.8%(+63.2)#30 |
| 5. | Sierra Brooks | 59.1% | 1.7%(+57.4)#5 | 1.8%(+57.3)#34 |
| 6. | Vina | 50.4% | 1.7%(+48.7)#6 | 1.8%(+48.6)#37 |
| 7. | Mountain Ranch | 50.0% | 1.7%(+48.3)#7 | 1.8%(+48.2)#40 |
| 8. | Daphnedale Park | 37.7% | 1.7%(+36.0)#8 | 1.8%(+35.9)#75 |
| 9. | Lake City | 35.0% | 1.7%(+33.3)#9 | 1.8%(+33.2)#88 |
| 10. | Desert Palms | 32.6% | 1.7%(+30.8)#10 | 1.8%(+30.8)#99 |
| 11. | Kernville | 24.8% | 1.7%(+23.1)#11 | 1.8%(+23.0)#148 |
| 12. | Stones Landing | 23.7% | 1.7%(+22.0)#12 | 1.8%(+21.9)#160 |
| 13. | Bear Creek | 20.8% | 1.7%(+19.1)#13 | 1.8%(+19.0)#195 |
| 14. | Coloma | 20.5% | 1.7%(+18.7)#14 | 1.8%(+18.7)#203 |
| 15. | Round Mountain | 20.0% | 1.7%(+18.3)#15 | 1.8%(+18.2)#211 |
| 16. | Camptonville | 16.7% | 1.7%(+15.0)#16 | 1.8%(+14.9)#286 |
| 17. | Paradise | 14.0% | 1.7%(+12.3)#17 | 1.8%(+12.2)#376 |
| 18. | Lake California | 13.7% | 1.7%(+12.0)#18 | 1.8%(+11.9)#389 |
| 19. | Garden Farms | 13.7% | 1.7%(+12.0)#19 | 1.8%(+11.9)#390 |
| 20. | Lake Don Pedro | 13.2% | 1.7%(+11.5)#20 | 1.8%(+11.4)#409 |
| 21. | Olde Stockdale | 12.9% | 1.7%(+11.2)#21 | 1.8%(+11.1)#425 |
| 22. | Keswick | 12.5% | 1.7%(+10.8)#22 | 1.8%(+10.7)#449 |
| 23. | Quincy | 12.4% | 1.7%(+10.7)#23 | 1.8%(+10.6)#461 |
| 24. | Shell Ridge | 11.4% | 1.7%(+9.64)#24 | 1.8%(+9.57)#515 |
| 25. | Scotia | 10.7% | 1.7%(+9.00)#25 | 1.8%(+8.93)#581 |
| 26. | Lake Almanor Peninsula | 10.6% | 1.7%(+8.86)#26 | 1.8%(+8.79)#588 |
| 27. | Johnstonville | 10.5% | 1.7%(+8.76)#27 | 1.8%(+8.69)#599 |
| 28. | Point Reyes Station | 10.3% | 1.7%(+8.63)#28 | 1.8%(+8.56)#610 |
| 29. | Monmouth | 9.7% | 1.7%(+7.96)#29 | 1.8%(+7.89)#674 |
| 30. | Benbow | 9.0% | 1.7%(+7.24)#30 | 1.8%(+7.17)#787 |
| 31. | San Geronimo | 8.8% | 1.7%(+7.14)#31 | 1.8%(+7.06)#801 |
| 32. | Woody | 8.8% | 1.7%(+7.06)#32 | 1.8%(+6.99)#813 |
| 33. | Julian | 8.5% | 1.7%(+6.79)#33 | 1.8%(+6.71)#862 |
| 34. | North Edwards | 8.4% | 1.7%(+6.70)#34 | 1.8%(+6.63)#873 |
| 35. | Sutter Creek | 8.4% | 1.7%(+6.64)#35 | 1.8%(+6.57)#884 |
| 36. | Lincoln Village | 8.3% | 1.7%(+6.63)#36 | 1.8%(+6.55)#887 |
| 37. | Grizzly Flats | 8.2% | 1.7%(+6.47)#37 | 1.8%(+6.39)#935 |
| 38. | Muir Beach | 8.2% | 1.7%(+6.45)#38 | 1.8%(+6.38)#939 |
| 39. | View Park Windsor Hills | 7.8% | 1.7%(+6.06)#39 | 1.8%(+5.99)#1,023 |
| 40. | Hoopa | 7.7% | 1.7%(+6.01)#40 | 1.8%(+5.94)#1,031 |
| 41. | Mesa Verde | 7.6% | 1.7%(+5.88)#41 | 1.8%(+5.80)#1,069 |
| 42. | Mckittrick | 7.5% | 1.7%(+5.79)#42 | 1.8%(+5.71)#1,101 |
| 43. | Loma Rica | 7.4% | 1.7%(+5.69)#43 | 1.8%(+5.62)#1,121 |
| 44. | Sonora | 7.4% | 1.7%(+5.67)#44 | 1.8%(+5.59)#1,131 |
| 45. | Biola | 7.4% | 1.7%(+5.64)#45 | 1.8%(+5.57)#1,138 |
| 46. | Ahwahnee | 7.3% | 1.7%(+5.62)#46 | 1.8%(+5.55)#1,141 |
| 47. | Sunnyside Tahoe City | 7.3% | 1.7%(+5.61)#47 | 1.8%(+5.54)#1,143 |
| 48. | Maricopa | 7.3% | 1.7%(+5.56)#48 | 1.8%(+5.49)#1,151 |
| 49. | Penn Valley | 7.2% | 1.7%(+5.46)#49 | 1.8%(+5.39)#1,175 |
| 50. | Cedar Ridge | 6.9% | 1.7%(+5.23)#50 | 1.8%(+5.16)#1,252 |
| 51. | Woodlake | 6.9% | 1.7%(+5.21)#51 | 1.8%(+5.13)#1,262 |
| 52. | Smith River | 6.7% | 1.7%(+4.97)#52 | 1.8%(+4.90)#1,342 |
| 53. | Myrtletown | 6.7% | 1.7%(+4.95)#53 | 1.8%(+4.88)#1,347 |
| 54. | Lower Lake | 6.6% | 1.7%(+4.86)#54 | 1.8%(+4.78)#1,391 |
| 55. | Green Valley Cdp Los Angeles County | 6.4% | 1.7%(+4.70)#55 | 1.8%(+4.63)#1,471 |
| 56. | Bend | 6.4% | 1.7%(+4.68)#56 | 1.8%(+4.61)#1,477 |
| 57. | Yosemite Valley | 6.4% | 1.7%(+4.64)#57 | 1.8%(+4.57)#1,491 |
| 58. | Freedom | 6.3% | 1.7%(+4.59)#58 | 1.8%(+4.52)#1,506 |
| 59. | Auburn Lake Trails | 5.9% | 1.7%(+4.16)#59 | 1.8%(+4.09)#1,702 |
| 60. | Dutch Flat | 5.8% | 1.7%(+4.06)#60 | 1.8%(+3.98)#1,752 |
| 61. | Zayante | 5.7% | 1.7%(+4.03)#61 | 1.8%(+3.96)#1,758 |
| 62. | Westhaven Moonstone | 5.7% | 1.7%(+4.03)#62 | 1.8%(+3.96)#1,759 |
| 63. | Solvang | 5.7% | 1.7%(+4.01)#63 | 1.8%(+3.93)#1,767 |
| 64. | Phoenix Lake | 5.6% | 1.7%(+3.91)#64 | 1.8%(+3.84)#1,818 |
| 65. | Jamestown | 5.6% | 1.7%(+3.87)#65 | 1.8%(+3.79)#1,845 |
| 66. | Chalfant | 5.6% | 1.7%(+3.87)#66 | 1.8%(+3.79)#1,846 |
| 67. | Whitewater | 5.6% | 1.7%(+3.86)#67 | 1.8%(+3.79)#1,848 |
| 68. | Tulelake | 5.5% | 1.7%(+3.81)#68 | 1.8%(+3.74)#1,879 |
| 69. | Lake San Marcos | 5.5% | 1.7%(+3.81)#69 | 1.8%(+3.74)#1,880 |
| 70. | Montara | 5.5% | 1.7%(+3.77)#70 | 1.8%(+3.69)#1,899 |
| 71. | Hayfork | 5.5% | 1.7%(+3.75)#71 | 1.8%(+3.67)#1,915 |
| 72. | Sierra Madre | 5.5% | 1.7%(+3.74)#72 | 1.8%(+3.67)#1,921 |
| 73. | Humboldt Hill | 5.4% | 1.7%(+3.66)#73 | 1.8%(+3.59)#1,973 |
| 74. | Redwood Valley | 5.3% | 1.7%(+3.56)#74 | 1.8%(+3.48)#2,041 |
| 75. | Sea Ranch | 5.2% | 1.7%(+3.48)#75 | 1.8%(+3.41)#2,104 |
| 76. | Penngrove | 5.2% | 1.7%(+3.46)#76 | 1.8%(+3.39)#2,114 |
| 77. | Riverdale | 5.2% | 1.7%(+3.45)#77 | 1.8%(+3.38)#2,127 |
| 78. | Pepperdine University | 5.1% | 1.7%(+3.37)#78 | 1.8%(+3.29)#2,190 |
| 79. | Sheridan | 5.1% | 1.7%(+3.35)#79 | 1.8%(+3.28)#2,202 |
| 80. | Millerton | 5.1% | 1.7%(+3.34)#80 | 1.8%(+3.27)#2,215 |
| 81. | Rio Vista | 4.9% | 1.7%(+3.20)#81 | 1.8%(+3.13)#2,324 |
| 82. | Fort Dick | 4.9% | 1.7%(+3.18)#82 | 1.8%(+3.11)#2,342 |
| 83. | Lucerne Valley | 4.7% | 1.7%(+3.03)#83 | 1.8%(+2.96)#2,475 |
| 84. | Allendale | 4.7% | 1.7%(+3.01)#84 | 1.8%(+2.93)#2,496 |
| 85. | Mira Monte | 4.7% | 1.7%(+2.97)#85 | 1.8%(+2.90)#2,530 |
| 86. | Bonadelle Ranchos | 4.7% | 1.7%(+2.95)#86 | 1.8%(+2.88)#2,548 |
| 87. | Idyllwild Pine Cove | 4.7% | 1.7%(+2.95)#87 | 1.8%(+2.88)#2,552 |
| 88. | Grayson | 4.6% | 1.7%(+2.92)#88 | 1.8%(+2.85)#2,594 |
| 89. | Del Dios | 4.5% | 1.7%(+2.80)#89 | 1.8%(+2.73)#2,719 |
| 90. | Pine Valley | 4.5% | 1.7%(+2.75)#90 | 1.8%(+2.68)#2,772 |
| 91. | Twentynine Palms | 4.4% | 1.7%(+2.74)#91 | 1.8%(+2.66)#2,788 |
| 92. | Geyserville | 4.4% | 1.7%(+2.71)#92 | 1.8%(+2.64)#2,804 |
| 93. | Paradise Park | 4.4% | 1.7%(+2.68)#93 | 1.8%(+2.61)#2,834 |
| 94. | Happy Camp | 4.3% | 1.7%(+2.61)#94 | 1.8%(+2.54)#2,901 |
| 95. | Timber Cove | 4.3% | 1.7%(+2.60)#95 | 1.8%(+2.52)#2,917 |
| 96. | Sand City | 4.3% | 1.7%(+2.54)#96 | 1.8%(+2.47)#2,975 |
| 97. | Caruthers | 4.2% | 1.7%(+2.53)#97 | 1.8%(+2.46)#2,994 |
| 98. | Day Valley | 4.2% | 1.7%(+2.51)#98 | 1.8%(+2.44)#3,015 |
| 99. | Occidental | 4.2% | 1.7%(+2.50)#99 | 1.8%(+2.42)#3,027 |
| 100. | Bangor | 4.2% | 1.7%(+2.50)#100 | 1.8%(+2.42)#3,031 |
Common Questions
What are the Top 10 Cities with the Highest Percentage of Population Employed in Education, Arts & Media in California?
Top 10 Cities with the Highest Percentage of Population Employed in Education, Arts & Media in California are:
#1
100.0%
#2
100.0%
#3
100.0%
#4
65.0%
#5
59.1%
#6
50.4%
#7
50.0%
#8
37.7%
#9
35.0%
#10
32.6%
What city has the Highest Percentage of Population Employed in Education, Arts & Media in California?
Canby has the Highest Percentage of Population Employed in Education, Arts & Media in California with 100.0%.
What is the Percentage of Population Employed in Education, Arts & Media in the State of California?
Percentage of Population Employed in Education, Arts & Media in California is 1.7%.
What is the Percentage of Population Employed in Education, Arts & Media in the United States?
Percentage of Population Employed in Education, Arts & Media in the United States is 1.8%.