Cities with the Most Immigrants from Belarus in California
RELATED REPORTS & OPTIONS
Belarus
California
Compare Cities
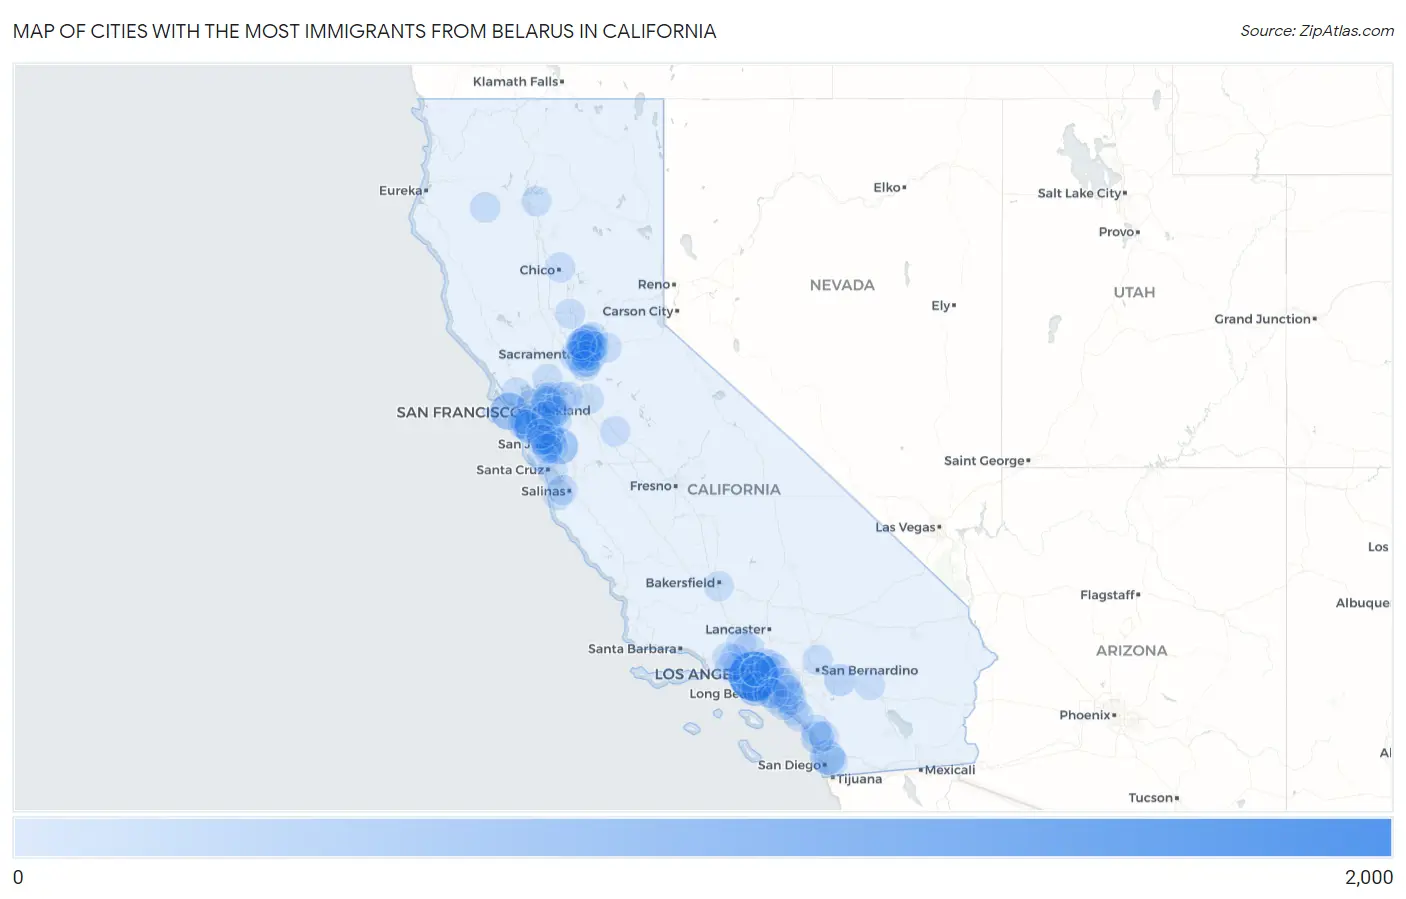
Map of Cities with the Most Immigrants from Belarus in California
0
2,000
Cities with the Most Immigrants from Belarus in California
| City | Belarus | vs State | vs National | |
| 1. | Los Angeles | 1,664 | 11,157(14.91%)#1 | 71,687(2.32%)#2 |
| 2. | San Francisco | 585 | 11,157(5.24%)#2 | 71,687(0.82%)#7 |
| 3. | San Jose | 505 | 11,157(4.53%)#3 | 71,687(0.70%)#9 |
| 4. | Antelope | 465 | 11,157(4.17%)#4 | 71,687(0.65%)#10 |
| 5. | San Diego | 389 | 11,157(3.49%)#5 | 71,687(0.54%)#13 |
| 6. | Torrance | 382 | 11,157(3.42%)#6 | 71,687(0.53%)#15 |
| 7. | North Highlands | 290 | 11,157(2.60%)#7 | 71,687(0.40%)#23 |
| 8. | San Mateo | 278 | 11,157(2.49%)#8 | 71,687(0.39%)#25 |
| 9. | Sunnyvale | 263 | 11,157(2.36%)#9 | 71,687(0.37%)#27 |
| 10. | Citrus Heights | 263 | 11,157(2.36%)#10 | 71,687(0.37%)#28 |
| 11. | Foothill Farms | 256 | 11,157(2.29%)#11 | 71,687(0.36%)#29 |
| 12. | Carmichael | 247 | 11,157(2.21%)#12 | 71,687(0.34%)#30 |
| 13. | Carlsbad | 236 | 11,157(2.12%)#13 | 71,687(0.33%)#33 |
| 14. | Irvine | 191 | 11,157(1.71%)#14 | 71,687(0.27%)#42 |
| 15. | Florin | 180 | 11,157(1.61%)#15 | 71,687(0.25%)#47 |
| 16. | Banning | 163 | 11,157(1.46%)#16 | 71,687(0.23%)#51 |
| 17. | Berkeley | 155 | 11,157(1.39%)#17 | 71,687(0.22%)#55 |
| 18. | Sacramento | 150 | 11,157(1.34%)#18 | 71,687(0.21%)#59 |
| 19. | South San Francisco | 128 | 11,157(1.15%)#19 | 71,687(0.18%)#68 |
| 20. | Walnut Creek | 125 | 11,157(1.12%)#20 | 71,687(0.17%)#71 |
| 21. | Arden Arcade | 120 | 11,157(1.08%)#21 | 71,687(0.17%)#74 |
| 22. | Rancho Cordova | 119 | 11,157(1.07%)#22 | 71,687(0.17%)#75 |
| 23. | Roseville | 117 | 11,157(1.05%)#23 | 71,687(0.16%)#77 |
| 24. | Santa Clara | 115 | 11,157(1.03%)#24 | 71,687(0.16%)#80 |
| 25. | Pleasant Hill | 113 | 11,157(1.01%)#25 | 71,687(0.16%)#86 |
| 26. | Santa Monica | 109 | 11,157(0.98%)#26 | 71,687(0.15%)#90 |
| 27. | Campbell | 108 | 11,157(0.97%)#27 | 71,687(0.15%)#92 |
| 28. | West Hollywood | 104 | 11,157(0.93%)#28 | 71,687(0.15%)#96 |
| 29. | San Ramon | 97 | 11,157(0.87%)#29 | 71,687(0.14%)#108 |
| 30. | Mountain View | 91 | 11,157(0.82%)#30 | 71,687(0.13%)#119 |
| 31. | Foster City | 89 | 11,157(0.80%)#31 | 71,687(0.12%)#122 |
| 32. | Cupertino | 78 | 11,157(0.70%)#32 | 71,687(0.11%)#139 |
| 33. | Vineyard | 76 | 11,157(0.68%)#33 | 71,687(0.11%)#143 |
| 34. | Oakland | 70 | 11,157(0.63%)#34 | 71,687(0.10%)#158 |
| 35. | Calabasas | 66 | 11,157(0.59%)#35 | 71,687(0.09%)#174 |
| 36. | Rocklin | 65 | 11,157(0.58%)#36 | 71,687(0.09%)#178 |
| 37. | Glendale | 63 | 11,157(0.56%)#37 | 71,687(0.09%)#183 |
| 38. | La Mesa | 61 | 11,157(0.55%)#38 | 71,687(0.09%)#193 |
| 39. | Santa Clarita | 59 | 11,157(0.53%)#39 | 71,687(0.08%)#195 |
| 40. | Boulder Creek | 59 | 11,157(0.53%)#40 | 71,687(0.08%)#198 |
| 41. | Oceanside | 58 | 11,157(0.52%)#41 | 71,687(0.08%)#200 |
| 42. | Laguna Niguel | 57 | 11,157(0.51%)#42 | 71,687(0.08%)#204 |
| 43. | Millbrae | 57 | 11,157(0.51%)#43 | 71,687(0.08%)#206 |
| 44. | Pleasanton | 56 | 11,157(0.50%)#44 | 71,687(0.08%)#212 |
| 45. | San Leandro | 54 | 11,157(0.48%)#45 | 71,687(0.08%)#221 |
| 46. | Tustin | 53 | 11,157(0.48%)#46 | 71,687(0.07%)#224 |
| 47. | Hillsborough | 52 | 11,157(0.47%)#47 | 71,687(0.07%)#230 |
| 48. | Concord | 48 | 11,157(0.43%)#48 | 71,687(0.07%)#245 |
| 49. | West Sacramento | 47 | 11,157(0.42%)#49 | 71,687(0.07%)#251 |
| 50. | Fremont | 46 | 11,157(0.41%)#50 | 71,687(0.06%)#255 |
| 51. | Hayfork | 46 | 11,157(0.41%)#51 | 71,687(0.06%)#261 |
| 52. | Pasadena | 44 | 11,157(0.39%)#52 | 71,687(0.06%)#265 |
| 53. | Daly City | 44 | 11,157(0.39%)#53 | 71,687(0.06%)#267 |
| 54. | Crestline | 44 | 11,157(0.39%)#54 | 71,687(0.06%)#273 |
| 55. | Danville | 42 | 11,157(0.38%)#55 | 71,687(0.06%)#283 |
| 56. | Pacifica | 41 | 11,157(0.37%)#56 | 71,687(0.06%)#295 |
| 57. | Monterey | 39 | 11,157(0.35%)#57 | 71,687(0.05%)#309 |
| 58. | Castaic | 39 | 11,157(0.35%)#58 | 71,687(0.05%)#310 |
| 59. | Simi Valley | 36 | 11,157(0.32%)#59 | 71,687(0.05%)#324 |
| 60. | San Marcos | 34 | 11,157(0.30%)#60 | 71,687(0.05%)#337 |
| 61. | Redondo Beach | 33 | 11,157(0.30%)#61 | 71,687(0.05%)#353 |
| 62. | San Clemente | 32 | 11,157(0.29%)#62 | 71,687(0.04%)#360 |
| 63. | Arcadia | 32 | 11,157(0.29%)#63 | 71,687(0.04%)#362 |
| 64. | Moorpark | 32 | 11,157(0.29%)#64 | 71,687(0.04%)#363 |
| 65. | Rio Linda | 32 | 11,157(0.29%)#65 | 71,687(0.04%)#367 |
| 66. | Rosemont | 29 | 11,157(0.26%)#66 | 71,687(0.04%)#400 |
| 67. | Palo Alto | 28 | 11,157(0.25%)#67 | 71,687(0.04%)#410 |
| 68. | Orangevale | 28 | 11,157(0.25%)#68 | 71,687(0.04%)#412 |
| 69. | Cameron Park | 28 | 11,157(0.25%)#69 | 71,687(0.04%)#416 |
| 70. | Capitola | 28 | 11,157(0.25%)#70 | 71,687(0.04%)#418 |
| 71. | Stockton | 27 | 11,157(0.24%)#71 | 71,687(0.04%)#420 |
| 72. | Alhambra | 27 | 11,157(0.24%)#72 | 71,687(0.04%)#424 |
| 73. | Spring Valley Cdp San Diego County | 27 | 11,157(0.24%)#73 | 71,687(0.04%)#426 |
| 74. | Huntington Beach | 26 | 11,157(0.23%)#74 | 71,687(0.04%)#434 |
| 75. | La Habra | 26 | 11,157(0.23%)#75 | 71,687(0.04%)#436 |
| 76. | Elk Grove | 25 | 11,157(0.22%)#76 | 71,687(0.03%)#446 |
| 77. | Westlake Village | 25 | 11,157(0.22%)#77 | 71,687(0.03%)#453 |
| 78. | Contra Costa Centre | 25 | 11,157(0.22%)#78 | 71,687(0.03%)#454 |
| 79. | Antioch | 24 | 11,157(0.22%)#79 | 71,687(0.03%)#459 |
| 80. | Saratoga | 23 | 11,157(0.21%)#80 | 71,687(0.03%)#480 |
| 81. | Marina | 23 | 11,157(0.21%)#81 | 71,687(0.03%)#481 |
| 82. | Castro Valley | 22 | 11,157(0.20%)#82 | 71,687(0.03%)#500 |
| 83. | Long Beach | 21 | 11,157(0.19%)#83 | 71,687(0.03%)#508 |
| 84. | Bakersfield | 21 | 11,157(0.19%)#84 | 71,687(0.03%)#509 |
| 85. | Newport Beach | 21 | 11,157(0.19%)#85 | 71,687(0.03%)#513 |
| 86. | Turlock | 21 | 11,157(0.19%)#86 | 71,687(0.03%)#515 |
| 87. | Brea | 20 | 11,157(0.18%)#87 | 71,687(0.03%)#535 |
| 88. | Camino Tassajara | 20 | 11,157(0.18%)#88 | 71,687(0.03%)#546 |
| 89. | Fairfield | 19 | 11,157(0.17%)#89 | 71,687(0.03%)#550 |
| 90. | Chico | 19 | 11,157(0.17%)#90 | 71,687(0.03%)#552 |
| 91. | Elverta | 19 | 11,157(0.17%)#91 | 71,687(0.03%)#561 |
| 92. | Sky Valley | 19 | 11,157(0.17%)#92 | 71,687(0.03%)#562 |
| 93. | Oakley | 17 | 11,157(0.15%)#93 | 71,687(0.02%)#584 |
| 94. | Menlo Park | 17 | 11,157(0.15%)#94 | 71,687(0.02%)#588 |
| 95. | Beverly Hills | 17 | 11,157(0.15%)#95 | 71,687(0.02%)#589 |
| 96. | Lucas Valley Marinwood | 17 | 11,157(0.15%)#96 | 71,687(0.02%)#598 |
| 97. | Orange | 16 | 11,157(0.14%)#97 | 71,687(0.02%)#601 |
| 98. | Yuba City | 16 | 11,157(0.14%)#98 | 71,687(0.02%)#603 |
| 99. | Seal Beach | 16 | 11,157(0.14%)#99 | 71,687(0.02%)#612 |
| 100. | Bella Vista | 16 | 11,157(0.14%)#100 | 71,687(0.02%)#621 |
Common Questions
What are the Top 10 Cities with the Most Immigrants from Belarus in California?
Top 10 Cities with the Most Immigrants from Belarus in California are:
#1
1,664
#2
585
#3
505
#4
465
#5
389
#6
382
#7
290
#8
278
#9
263
#10
263
What city has the Most Immigrants from Belarus in California?
Los Angeles has the Most Immigrants from Belarus in California with 1,664.
What is the Total Immigrants from Belarus in the State of California?
Total Immigrants from Belarus in California is 11,157.
What is the Total Immigrants from Belarus in the United States?
Total Immigrants from Belarus in the United States is 71,687.