Cities with the Highest Percentage of Population Employed in Security & Protection in California
RELATED REPORTS & OPTIONS
Security & Protection
California
Compare Cities
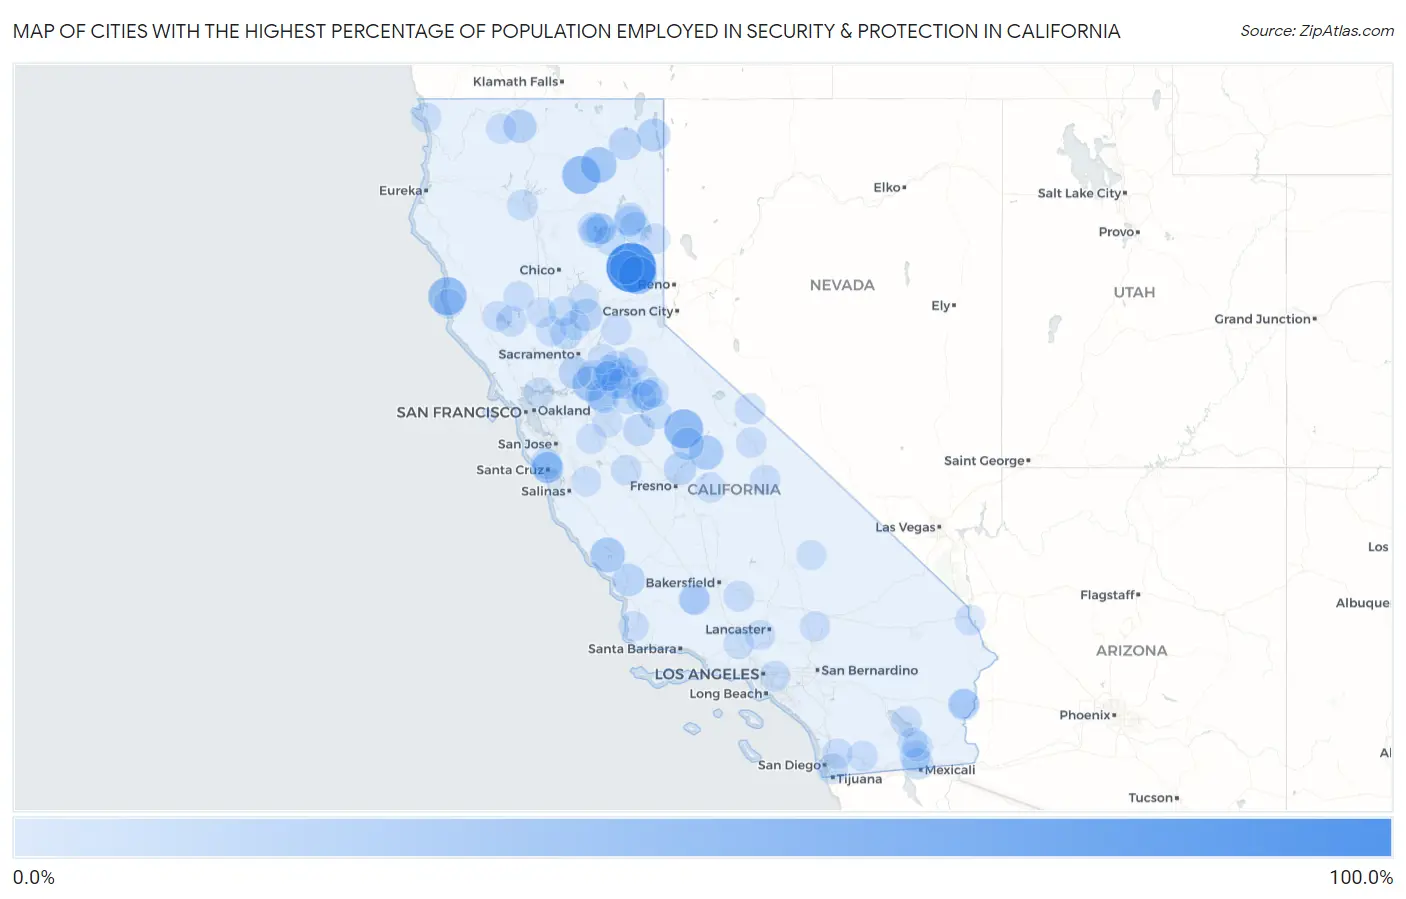
Map of Cities with the Highest Percentage of Population Employed in Security & Protection in California
0.0%
100.0%
Cities with the Highest Percentage of Population Employed in Security & Protection in California
| City | % Employed | vs State | vs National | |
| 1. | C Road | 100.0% | 2.1%(+97.9)#1 | 2.1%(+97.9)#2 |
| 2. | Kep'el | 50.0% | 2.1%(+47.9)#2 | 2.1%(+47.9)#32 |
| 3. | Igo | 47.6% | 2.1%(+45.5)#3 | 2.1%(+45.5)#37 |
| 4. | Wawona | 47.0% | 2.1%(+44.9)#4 | 2.1%(+44.8)#39 |
| 5. | Caspar | 45.1% | 2.1%(+43.0)#5 | 2.1%(+42.9)#41 |
| 6. | Fall River Mills | 43.9% | 2.1%(+41.8)#6 | 2.1%(+41.7)#47 |
| 7. | Calpine | 43.8% | 2.1%(+41.7)#7 | 2.1%(+41.6)#48 |
| 8. | Bieber | 33.3% | 2.1%(+31.3)#8 | 2.1%(+31.2)#90 |
| 9. | Acampo | 30.3% | 2.1%(+28.2)#9 | 2.1%(+28.2)#116 |
| 10. | Oak Shores | 28.9% | 2.1%(+26.8)#10 | 2.1%(+26.7)#126 |
| 11. | Big Creek | 26.1% | 2.1%(+24.0)#11 | 2.1%(+23.9)#160 |
| 12. | Graeagle | 23.3% | 2.1%(+21.3)#12 | 2.1%(+21.2)#214 |
| 13. | Grenada | 20.7% | 2.1%(+18.6)#13 | 2.1%(+18.5)#261 |
| 14. | Cedarville | 20.0% | 2.1%(+17.9)#14 | 2.1%(+17.9)#273 |
| 15. | Courtland | 18.9% | 2.1%(+16.8)#15 | 2.1%(+16.8)#308 |
| 16. | San Andreas | 18.7% | 2.1%(+16.7)#16 | 2.1%(+16.6)#311 |
| 17. | Garden Farms | 18.0% | 2.1%(+15.9)#17 | 2.1%(+15.8)#335 |
| 18. | Friant | 17.6% | 2.1%(+15.5)#18 | 2.1%(+15.4)#352 |
| 19. | California Pines | 17.2% | 2.1%(+15.1)#19 | 2.1%(+15.1)#371 |
| 20. | Bass Lake | 17.1% | 2.1%(+15.0)#20 | 2.1%(+15.0)#379 |
| 21. | Beale Afb | 16.2% | 2.1%(+14.1)#21 | 2.1%(+14.1)#424 |
| 22. | Linden | 15.3% | 2.1%(+13.2)#22 | 2.1%(+13.2)#472 |
| 23. | Susanville | 14.7% | 2.1%(+12.6)#23 | 2.1%(+12.5)#504 |
| 24. | Paradise Park | 14.3% | 2.1%(+12.2)#24 | 2.1%(+12.1)#537 |
| 25. | El Centro Naval Air Facility | 14.0% | 2.1%(+12.0)#25 | 2.1%(+11.9)#562 |
| 26. | Snelling | 13.6% | 2.1%(+11.5)#26 | 2.1%(+11.4)#609 |
| 27. | Lake Almanor Peninsula | 13.5% | 2.1%(+11.4)#27 | 2.1%(+11.3)#617 |
| 28. | Robbins | 13.0% | 2.1%(+10.9)#28 | 2.1%(+10.9)#663 |
| 29. | Peters | 12.3% | 2.1%(+10.2)#29 | 2.1%(+10.1)#727 |
| 30. | Mount Hermon | 12.0% | 2.1%(+9.93)#30 | 2.1%(+9.86)#755 |
| 31. | Heber | 11.9% | 2.1%(+9.86)#31 | 2.1%(+9.79)#770 |
| 32. | Mokelumne Hill | 11.9% | 2.1%(+9.78)#32 | 2.1%(+9.72)#779 |
| 33. | Mesa Verde | 11.7% | 2.1%(+9.57)#33 | 2.1%(+9.50)#817 |
| 34. | Janesville | 11.6% | 2.1%(+9.54)#34 | 2.1%(+9.47)#822 |
| 35. | Spring Valley Cdp Lake County | 11.6% | 2.1%(+9.47)#35 | 2.1%(+9.41)#833 |
| 36. | Buena Vista | 11.2% | 2.1%(+9.16)#36 | 2.1%(+9.09)#875 |
| 37. | Johnstonville | 10.7% | 2.1%(+8.65)#37 | 2.1%(+8.58)#963 |
| 38. | Imperial | 10.7% | 2.1%(+8.65)#38 | 2.1%(+8.58)#964 |
| 39. | Pasatiempo | 10.7% | 2.1%(+8.59)#39 | 2.1%(+8.52)#977 |
| 40. | Greenville | 10.6% | 2.1%(+8.54)#40 | 2.1%(+8.47)#996 |
| 41. | Lake Almanor West | 10.5% | 2.1%(+8.45)#41 | 2.1%(+8.38)#1,007 |
| 42. | Benton | 10.3% | 2.1%(+8.18)#42 | 2.1%(+8.11)#1,047 |
| 43. | Shasta | 10.2% | 2.1%(+8.09)#43 | 2.1%(+8.02)#1,064 |
| 44. | Bonita | 10.1% | 2.1%(+7.98)#44 | 2.1%(+7.91)#1,087 |
| 45. | Amador City | 10.0% | 2.1%(+7.92)#45 | 2.1%(+7.85)#1,094 |
| 46. | Bear Valley Springs | 10.0% | 2.1%(+7.91)#46 | 2.1%(+7.84)#1,101 |
| 47. | Copperopolis | 9.8% | 2.1%(+7.73)#47 | 2.1%(+7.66)#1,137 |
| 48. | Greeley Hill | 9.8% | 2.1%(+7.70)#48 | 2.1%(+7.63)#1,144 |
| 49. | Clearlake Oaks | 9.3% | 2.1%(+7.22)#49 | 2.1%(+7.15)#1,244 |
| 50. | Hamilton Branch | 9.1% | 2.1%(+7.07)#50 | 2.1%(+7.00)#1,274 |
| 51. | South Dos Palos | 9.1% | 2.1%(+7.06)#51 | 2.1%(+7.00)#1,276 |
| 52. | Rose Hills | 9.1% | 2.1%(+7.03)#52 | 2.1%(+6.97)#1,286 |
| 53. | Phoenix Lake | 9.0% | 2.1%(+6.87)#53 | 2.1%(+6.80)#1,345 |
| 54. | Taft Heights | 8.9% | 2.1%(+6.83)#54 | 2.1%(+6.77)#1,362 |
| 55. | Avery | 8.8% | 2.1%(+6.71)#55 | 2.1%(+6.64)#1,398 |
| 56. | Herlong | 8.7% | 2.1%(+6.66)#56 | 2.1%(+6.59)#1,416 |
| 57. | Leona Valley | 8.6% | 2.1%(+6.54)#57 | 2.1%(+6.47)#1,450 |
| 58. | Pine Valley | 8.6% | 2.1%(+6.49)#58 | 2.1%(+6.42)#1,459 |
| 59. | Mono Vista | 8.6% | 2.1%(+6.48)#59 | 2.1%(+6.41)#1,466 |
| 60. | Taft | 8.4% | 2.1%(+6.37)#60 | 2.1%(+6.30)#1,505 |
| 61. | Hasley Canyon | 8.4% | 2.1%(+6.31)#61 | 2.1%(+6.24)#1,519 |
| 62. | Squaw Valley | 8.3% | 2.1%(+6.26)#62 | 2.1%(+6.19)#1,532 |
| 63. | Bombay Beach | 8.3% | 2.1%(+6.25)#63 | 2.1%(+6.18)#1,542 |
| 64. | Stonyford | 8.3% | 2.1%(+6.25)#64 | 2.1%(+6.18)#1,547 |
| 65. | Ione | 8.3% | 2.1%(+6.23)#65 | 2.1%(+6.16)#1,554 |
| 66. | Chester | 8.3% | 2.1%(+6.22)#66 | 2.1%(+6.15)#1,558 |
| 67. | Georgetown | 8.3% | 2.1%(+6.19)#67 | 2.1%(+6.12)#1,566 |
| 68. | Needles | 8.2% | 2.1%(+6.11)#68 | 2.1%(+6.05)#1,595 |
| 69. | Fort Jones | 8.2% | 2.1%(+6.07)#69 | 2.1%(+6.00)#1,604 |
| 70. | Silver Lakes | 8.1% | 2.1%(+5.99)#70 | 2.1%(+5.93)#1,633 |
| 71. | Eucalyptus Hills | 8.0% | 2.1%(+5.92)#71 | 2.1%(+5.85)#1,654 |
| 72. | Dunnigan | 8.0% | 2.1%(+5.90)#72 | 2.1%(+5.83)#1,665 |
| 73. | Blythe | 7.9% | 2.1%(+5.85)#73 | 2.1%(+5.79)#1,676 |
| 74. | Herald | 7.9% | 2.1%(+5.79)#74 | 2.1%(+5.72)#1,697 |
| 75. | North Lakeport | 7.8% | 2.1%(+5.73)#75 | 2.1%(+5.67)#1,723 |
| 76. | Brawley | 7.5% | 2.1%(+5.47)#76 | 2.1%(+5.40)#1,826 |
| 77. | Vandenberg Afb | 7.5% | 2.1%(+5.46)#77 | 2.1%(+5.39)#1,832 |
| 78. | Independence | 7.5% | 2.1%(+5.46)#78 | 2.1%(+5.39)#1,833 |
| 79. | Sutter | 7.5% | 2.1%(+5.46)#79 | 2.1%(+5.39)#1,836 |
| 80. | West Bishop | 7.4% | 2.1%(+5.37)#80 | 2.1%(+5.30)#1,881 |
| 81. | Buckhorn | 7.4% | 2.1%(+5.30)#81 | 2.1%(+5.23)#1,916 |
| 82. | Westmorland | 7.4% | 2.1%(+5.27)#82 | 2.1%(+5.20)#1,922 |
| 83. | Port Costa | 7.2% | 2.1%(+5.17)#83 | 2.1%(+5.10)#1,959 |
| 84. | Airport | 7.2% | 2.1%(+5.15)#84 | 2.1%(+5.08)#1,973 |
| 85. | Little River | 7.1% | 2.1%(+5.06)#85 | 2.1%(+4.99)#2,004 |
| 86. | Yosemite West | 7.1% | 2.1%(+5.06)#86 | 2.1%(+4.99)#2,010 |
| 87. | Rancho Murieta | 7.1% | 2.1%(+4.97)#87 | 2.1%(+4.90)#2,048 |
| 88. | Sonora | 7.0% | 2.1%(+4.95)#88 | 2.1%(+4.88)#2,059 |
| 89. | Amador Pines | 7.0% | 2.1%(+4.91)#89 | 2.1%(+4.84)#2,081 |
| 90. | Diablo Grande | 6.9% | 2.1%(+4.85)#90 | 2.1%(+4.78)#2,115 |
| 91. | Plumas Lake | 6.9% | 2.1%(+4.78)#91 | 2.1%(+4.72)#2,153 |
| 92. | Williams | 6.9% | 2.1%(+4.78)#92 | 2.1%(+4.71)#2,156 |
| 93. | Valley Springs | 6.9% | 2.1%(+4.77)#93 | 2.1%(+4.71)#2,158 |
| 94. | Ridgemark | 6.8% | 2.1%(+4.72)#94 | 2.1%(+4.65)#2,183 |
| 95. | Loma Rica | 6.8% | 2.1%(+4.71)#95 | 2.1%(+4.64)#2,189 |
| 96. | Camanche Village | 6.8% | 2.1%(+4.69)#96 | 2.1%(+4.62)#2,200 |
| 97. | Mi Wuk Village | 6.7% | 2.1%(+4.66)#97 | 2.1%(+4.59)#2,213 |
| 98. | Cold Springs Cdp El Dorado County | 6.7% | 2.1%(+4.60)#98 | 2.1%(+4.54)#2,246 |
| 99. | Bertsch Oceanview | 6.7% | 2.1%(+4.57)#99 | 2.1%(+4.51)#2,279 |
| 100. | Searles Valley | 6.5% | 2.1%(+4.38)#100 | 2.1%(+4.31)#2,380 |
Common Questions
What are the Top 10 Cities with the Highest Percentage of Population Employed in Security & Protection in California?
Top 10 Cities with the Highest Percentage of Population Employed in Security & Protection in California are:
#1
100.0%
#2
47.0%
#3
45.1%
#4
43.9%
#5
43.8%
#6
33.3%
#7
30.3%
#8
28.9%
#9
26.1%
#10
23.3%
What city has the Highest Percentage of Population Employed in Security & Protection in California?
C Road has the Highest Percentage of Population Employed in Security & Protection in California with 100.0%.
What is the Percentage of Population Employed in Security & Protection in the State of California?
Percentage of Population Employed in Security & Protection in California is 2.1%.
What is the Percentage of Population Employed in Security & Protection in the United States?
Percentage of Population Employed in Security & Protection in the United States is 2.1%.