Muscoy, CA Map & Demographics
Muscoy Map
Muscoy Overview
$19,130
PER CAPITA INCOME
$51,280
AVG FAMILY INCOME
$54,464
AVG HOUSEHOLD INCOME
28.8%
WAGE / INCOME GAP [ % ]
71.2¢/ $1
WAGE / INCOME GAP [ $ ]
$12,815
FAMILY INCOME DEFICIT
0.45
INEQUALITY / GINI INDEX
11,802
TOTAL POPULATION
6,388
MALE POPULATION
5,414
FEMALE POPULATION
117.99
MALES / 100 FEMALES
84.75
FEMALES / 100 MALES
29.7
MEDIAN AGE
4.6
AVG FAMILY SIZE
4.5
AVG HOUSEHOLD SIZE
5,010
LABOR FORCE [ PEOPLE ]
57.8%
PERCENT IN LABOR FORCE
8.4%
UNEMPLOYMENT RATE
Income in Muscoy
Income Overview in Muscoy
Per Capita Income in Muscoy is $19,130, while median incomes of families and households are $51,280 and $54,464 respectively.
| Characteristic | Number | Measure |
| Per Capita Income | 11,802 | $19,130 |
| Median Family Income | 2,215 | $51,280 |
| Mean Family Income | 2,215 | $74,719 |
| Median Household Income | 2,528 | $54,464 |
| Mean Household Income | 2,528 | $79,558 |
| Income Deficit | 2,215 | $12,815 |
| Wage / Income Gap (%) | 11,802 | 28.78% |
| Wage / Income Gap ($) | 11,802 | 71.22¢ per $1 |
| Gini / Inequality Index | 11,802 | 0.45 |
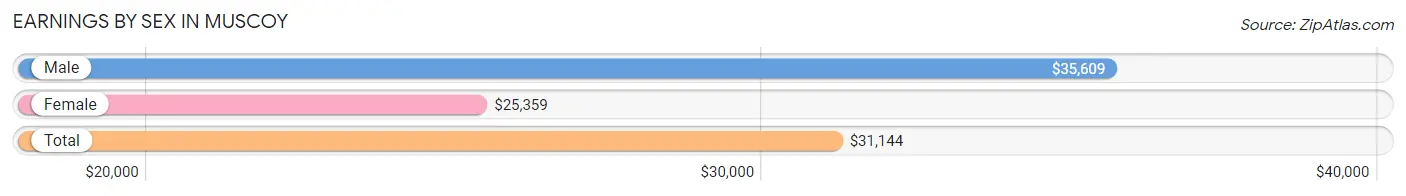
Earnings by Sex in Muscoy
Average Earnings in Muscoy are $31,144, $35,609 for men and $25,359 for women, a difference of 28.8%.
| Sex | Number | Average Earnings |
| Male | 3,084 (60.1%) | $35,609 |
| Female | 2,048 (39.9%) | $25,359 |
| Total | 5,132 (100.0%) | $31,144 |
Earnings by Sex by Income Bracket in Muscoy
The most common earnings brackets in Muscoy are $30,000 to $34,999 for men (318 | 10.3%) and $10,000 to $12,499 for women (298 | 14.5%).
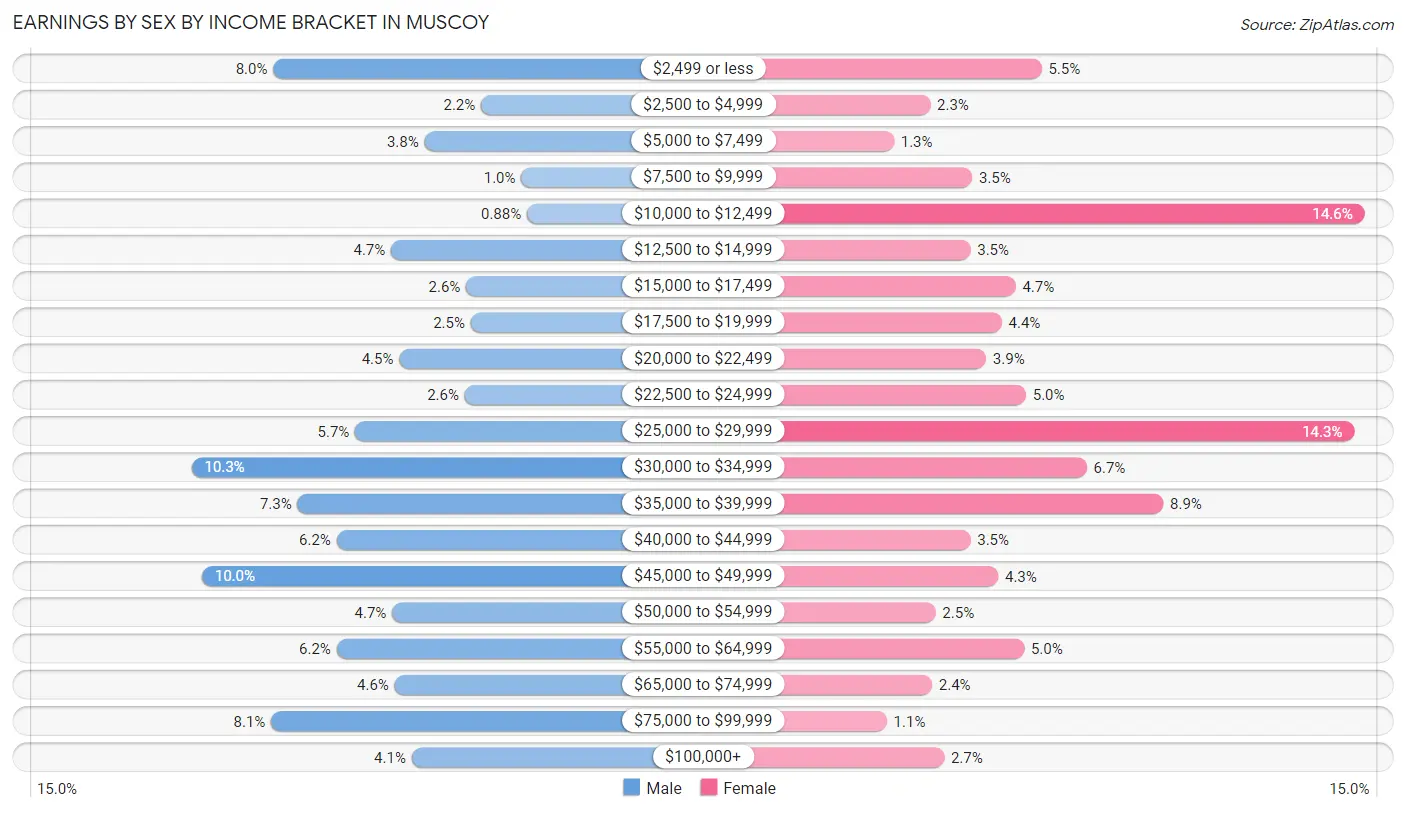
| Income | Male | Female |
| $2,499 or less | 247 (8.0%) | 112 (5.5%) |
| $2,500 to $4,999 | 67 (2.2%) | 48 (2.3%) |
| $5,000 to $7,499 | 116 (3.8%) | 27 (1.3%) |
| $7,500 to $9,999 | 32 (1.0%) | 72 (3.5%) |
| $10,000 to $12,499 | 27 (0.9%) | 298 (14.5%) |
| $12,500 to $14,999 | 145 (4.7%) | 71 (3.5%) |
| $15,000 to $17,499 | 80 (2.6%) | 97 (4.7%) |
| $17,500 to $19,999 | 76 (2.5%) | 89 (4.3%) |
| $20,000 to $22,499 | 138 (4.5%) | 80 (3.9%) |
| $22,500 to $24,999 | 81 (2.6%) | 103 (5.0%) |
| $25,000 to $29,999 | 176 (5.7%) | 292 (14.3%) |
| $30,000 to $34,999 | 318 (10.3%) | 138 (6.7%) |
| $35,000 to $39,999 | 226 (7.3%) | 182 (8.9%) |
| $40,000 to $44,999 | 192 (6.2%) | 71 (3.5%) |
| $45,000 to $49,999 | 309 (10.0%) | 87 (4.3%) |
| $50,000 to $54,999 | 144 (4.7%) | 51 (2.5%) |
| $55,000 to $64,999 | 192 (6.2%) | 102 (5.0%) |
| $65,000 to $74,999 | 142 (4.6%) | 49 (2.4%) |
| $75,000 to $99,999 | 249 (8.1%) | 23 (1.1%) |
| $100,000+ | 127 (4.1%) | 56 (2.7%) |
| Total | 3,084 (100.0%) | 2,048 (100.0%) |
Earnings by Sex by Educational Attainment in Muscoy
Average earnings in Muscoy are $40,537 for men and $26,671 for women, a difference of 34.2%. Men with an educational attainment of college or associate's degree enjoy the highest average annual earnings of $49,005, while those with bachelor's degree education earn the least with $35,539. Women with an educational attainment of bachelor's degree earn the most with the average annual earnings of $56,213, while those with less than high school education have the smallest earnings of $12,685.
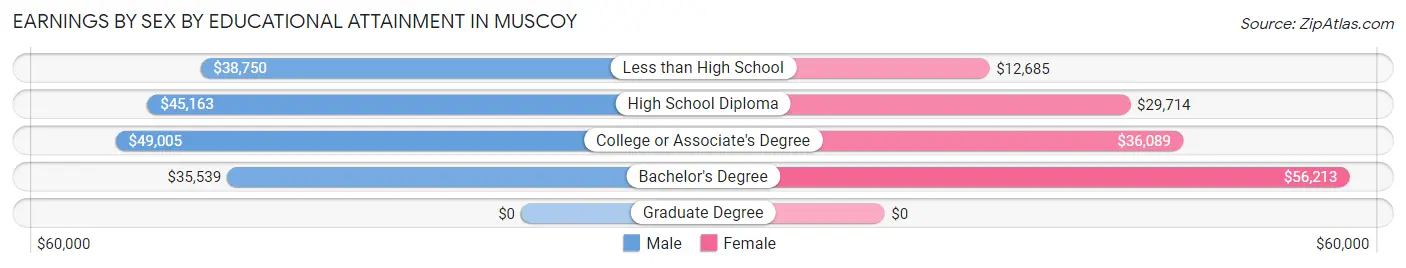
| Educational Attainment | Male Income | Female Income |
| Less than High School | $38,750 | $12,685 |
| High School Diploma | $45,163 | $29,714 |
| College or Associate's Degree | $49,005 | $36,089 |
| Bachelor's Degree | $35,539 | $56,213 |
| Graduate Degree | - | - |
| Total | $40,537 | $26,671 |
Family Income in Muscoy
Family Income Brackets in Muscoy
According to the Muscoy family income data, there are 540 families falling into the $35,000 to $49,999 income range, which is the most common income bracket and makes up 24.4% of all families. Conversely, the $200,000+ income bracket is the least frequent group with only 40 families (1.8%) belonging to this category.
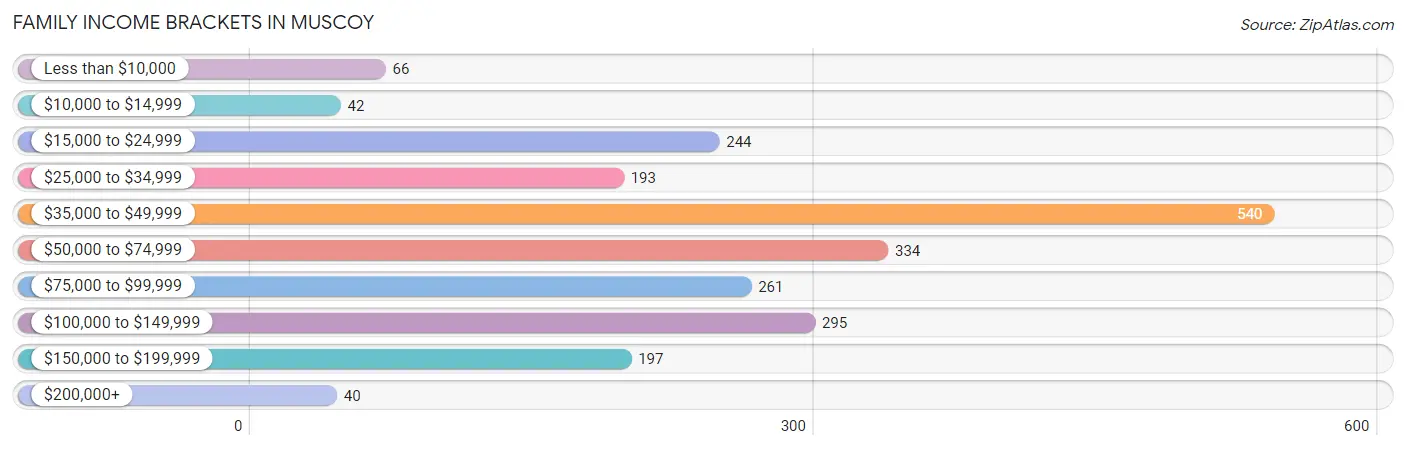
| Income Bracket | # Families | % Families |
| Less than $10,000 | 66 | 3.0% |
| $10,000 to $14,999 | 42 | 1.9% |
| $15,000 to $24,999 | 244 | 11.0% |
| $25,000 to $34,999 | 193 | 8.7% |
| $35,000 to $49,999 | 540 | 24.4% |
| $50,000 to $74,999 | 334 | 15.1% |
| $75,000 to $99,999 | 261 | 11.8% |
| $100,000 to $149,999 | 295 | 13.3% |
| $150,000 to $199,999 | 197 | 8.9% |
| $200,000+ | 40 | 1.8% |
Family Income by Famaliy Size in Muscoy
7+ person families (374 | 16.9%) account for the highest median family income in Muscoy with $142,649 per family, while 3-person families (319 | 14.4%) have the highest median income of $23,642 per family member.
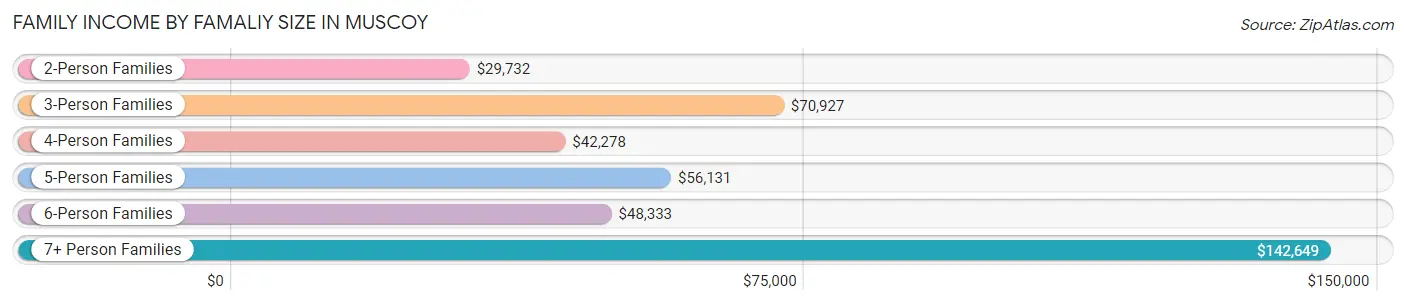
| Income Bracket | # Families | Median Income |
| 2-Person Families | 341 (15.4%) | $29,732 |
| 3-Person Families | 319 (14.4%) | $70,927 |
| 4-Person Families | 765 (34.5%) | $42,278 |
| 5-Person Families | 324 (14.6%) | $56,131 |
| 6-Person Families | 92 (4.2%) | $48,333 |
| 7+ Person Families | 374 (16.9%) | $142,649 |
| Total | 2,215 (100.0%) | $51,280 |
Family Income by Number of Earners in Muscoy
The median family income in Muscoy is $51,280, with families comprising 3+ earners (453) having the highest median family income of $133,594, while families with no earners (163) have the lowest median family income of $18,179, accounting for 20.4% and 7.4% of families, respectively.
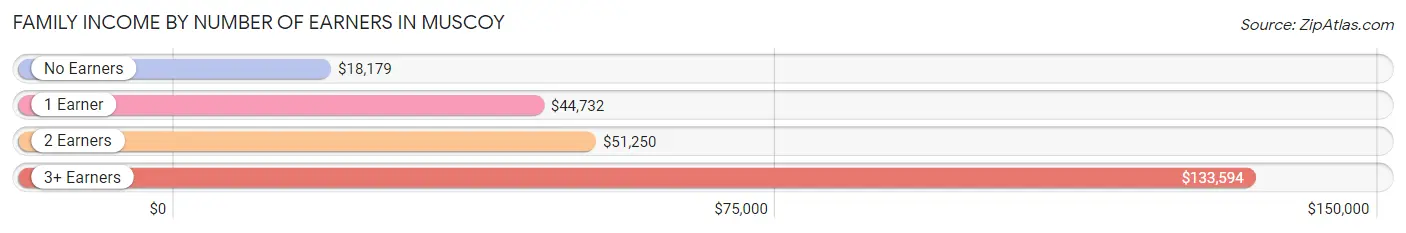
| Number of Earners | # Families | Median Income |
| No Earners | 163 (7.4%) | $18,179 |
| 1 Earner | 817 (36.9%) | $44,732 |
| 2 Earners | 782 (35.3%) | $51,250 |
| 3+ Earners | 453 (20.4%) | $133,594 |
| Total | 2,215 (100.0%) | $51,280 |
Household Income in Muscoy
Household Income Brackets in Muscoy
With 531 households falling in the category, the $35,000 to $49,999 income range is the most frequent in Muscoy, accounting for 21.0% of all households. In contrast, only 48 households (1.9%) fall into the $10,000 to $14,999 income bracket, making it the least populous group.
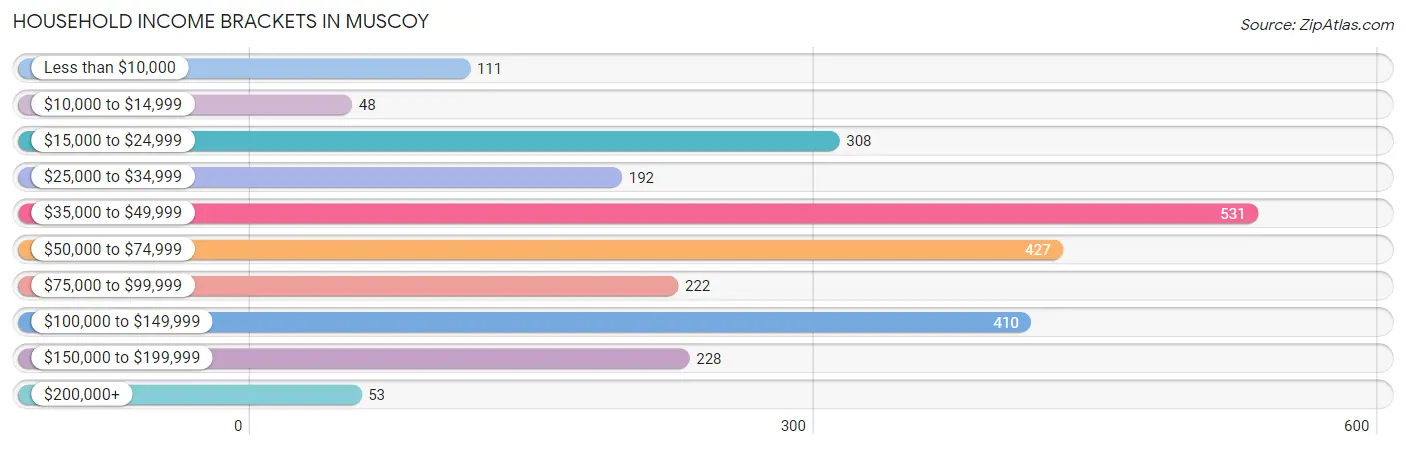
| Income Bracket | # Households | % Households |
| Less than $10,000 | 111 | 4.4% |
| $10,000 to $14,999 | 48 | 1.9% |
| $15,000 to $24,999 | 308 | 12.2% |
| $25,000 to $34,999 | 192 | 7.6% |
| $35,000 to $49,999 | 531 | 21.0% |
| $50,000 to $74,999 | 427 | 16.9% |
| $75,000 to $99,999 | 222 | 8.8% |
| $100,000 to $149,999 | 410 | 16.2% |
| $150,000 to $199,999 | 228 | 9.0% |
| $200,000+ | 53 | 2.1% |
Household Income by Householder Age in Muscoy
The median household income in Muscoy is $54,464, with the highest median household income of $69,557 found in the 45 to 64 years age bracket for the primary householder. A total of 1,157 households (45.8%) fall into this category. Meanwhile, the 15 to 24 years age bracket for the primary householder has the lowest median household income of $0, with 42 households (1.7%) in this group.
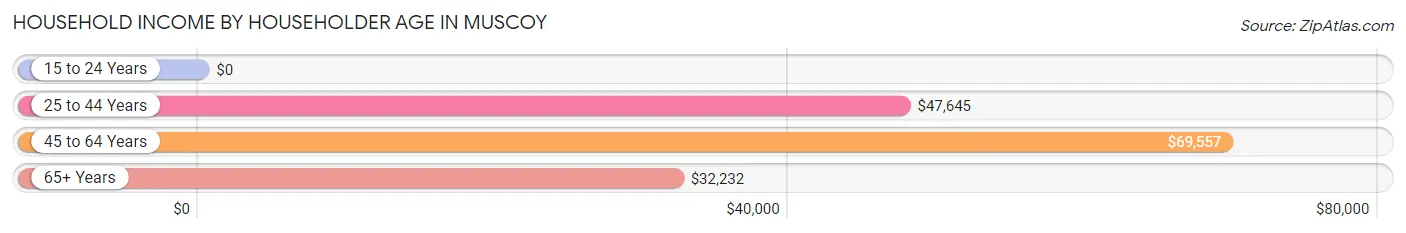
| Income Bracket | # Households | Median Income |
| 15 to 24 Years | 42 (1.7%) | $0 |
| 25 to 44 Years | 954 (37.7%) | $47,645 |
| 45 to 64 Years | 1,157 (45.8%) | $69,557 |
| 65+ Years | 375 (14.8%) | $32,232 |
| Total | 2,528 (100.0%) | $54,464 |
Poverty in Muscoy
Income Below Poverty by Sex and Age in Muscoy
With 17.9% poverty level for males and 18.8% for females among the residents of Muscoy, 15 year old males and 16 and 17 year old females are the most vulnerable to poverty, with 43 males (72.9%) and 77 females (46.9%) in their respective age groups living below the poverty level.
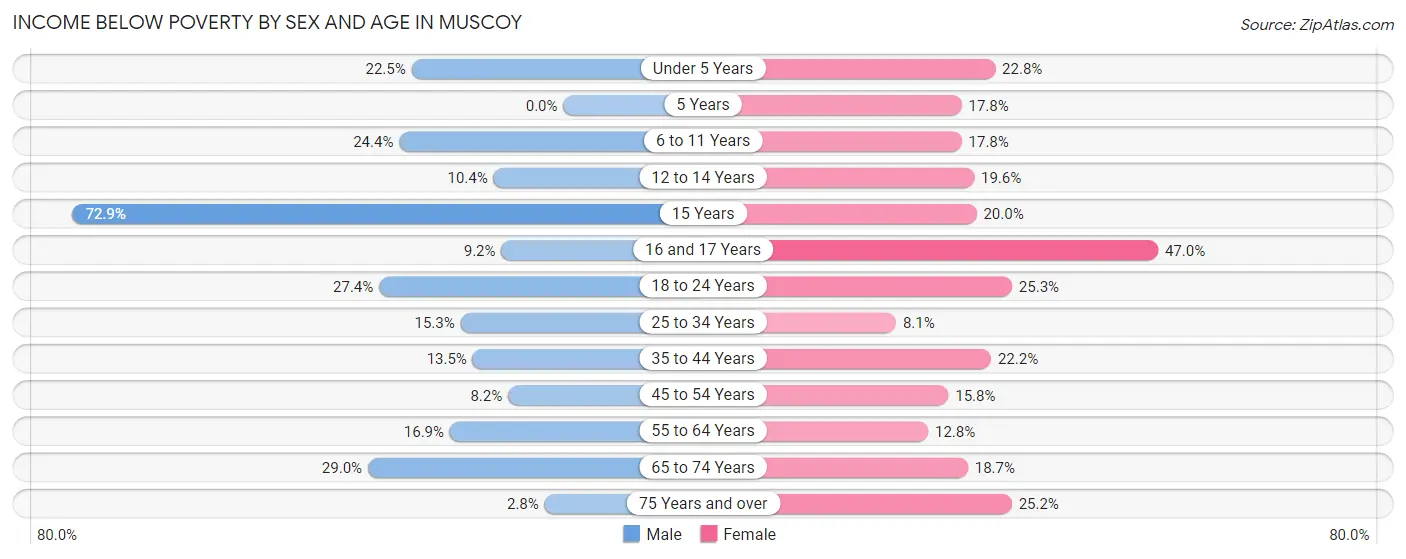
| Age Bracket | Male | Female |
| Under 5 Years | 110 (22.5%) | 87 (22.8%) |
| 5 Years | 0 (0.0%) | 8 (17.8%) |
| 6 to 11 Years | 165 (24.4%) | 90 (17.8%) |
| 12 to 14 Years | 29 (10.4%) | 66 (19.6%) |
| 15 Years | 43 (72.9%) | 17 (20.0%) |
| 16 and 17 Years | 16 (9.2%) | 77 (46.9%) |
| 18 to 24 Years | 229 (27.4%) | 172 (25.3%) |
| 25 to 34 Years | 128 (15.3%) | 73 (8.1%) |
| 35 to 44 Years | 119 (13.5%) | 136 (22.2%) |
| 45 to 54 Years | 63 (8.2%) | 109 (15.8%) |
| 55 to 64 Years | 106 (16.9%) | 47 (12.8%) |
| 65 to 74 Years | 130 (29.0%) | 64 (18.7%) |
| 75 Years and over | 3 (2.8%) | 55 (25.2%) |
| Total | 1,141 (17.9%) | 1,001 (18.8%) |
Income Above Poverty by Sex and Age in Muscoy
According to the poverty statistics in Muscoy, males aged 5 years and females aged 25 to 34 years are the age groups that are most secure financially, with 100.0% of males and 91.9% of females in these age groups living above the poverty line.
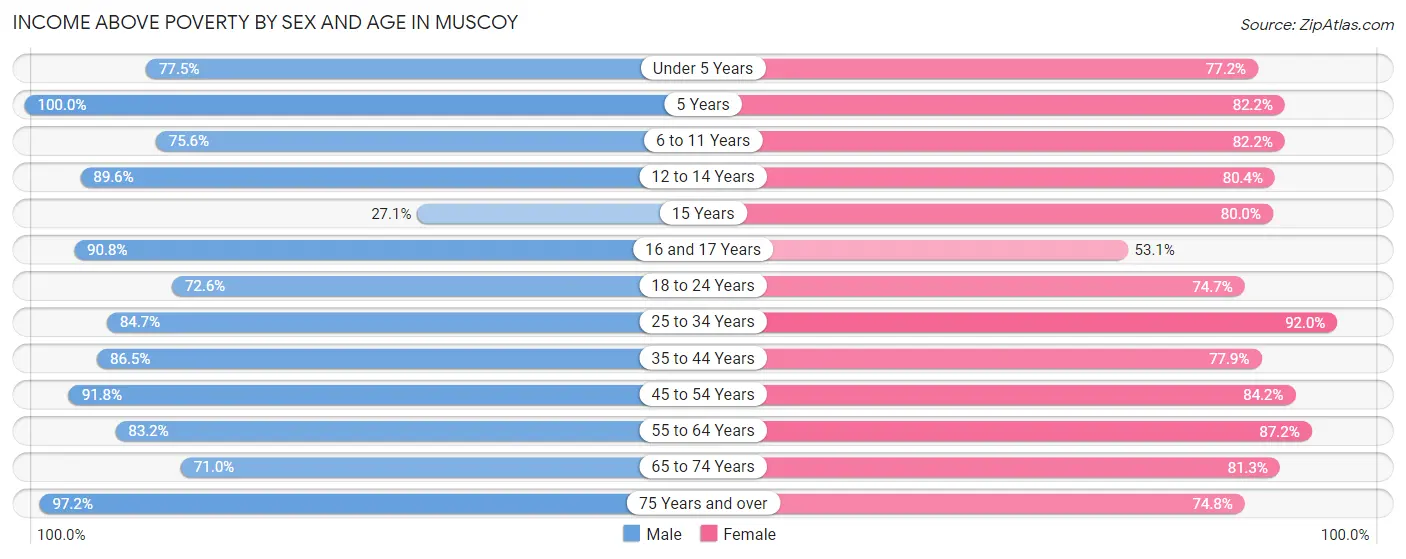
| Age Bracket | Male | Female |
| Under 5 Years | 378 (77.5%) | 295 (77.2%) |
| 5 Years | 199 (100.0%) | 37 (82.2%) |
| 6 to 11 Years | 512 (75.6%) | 416 (82.2%) |
| 12 to 14 Years | 251 (89.6%) | 270 (80.4%) |
| 15 Years | 16 (27.1%) | 68 (80.0%) |
| 16 and 17 Years | 158 (90.8%) | 87 (53.0%) |
| 18 to 24 Years | 608 (72.6%) | 509 (74.7%) |
| 25 to 34 Years | 710 (84.7%) | 834 (91.9%) |
| 35 to 44 Years | 765 (86.5%) | 478 (77.8%) |
| 45 to 54 Years | 704 (91.8%) | 580 (84.2%) |
| 55 to 64 Years | 523 (83.2%) | 320 (87.2%) |
| 65 to 74 Years | 318 (71.0%) | 278 (81.3%) |
| 75 Years and over | 105 (97.2%) | 163 (74.8%) |
| Total | 5,247 (82.1%) | 4,335 (81.2%) |
Income Below Poverty Among Married-Couple Families in Muscoy
The poverty statistics for married-couple families in Muscoy show that 10.6% or 134 of the total 1,266 families live below the poverty line. Families with 3 or 4 children have the highest poverty rate of 32.0%, comprising of 56 families. On the other hand, families with 5 or more children have the lowest poverty rate of 0.0%, which includes 0 families.
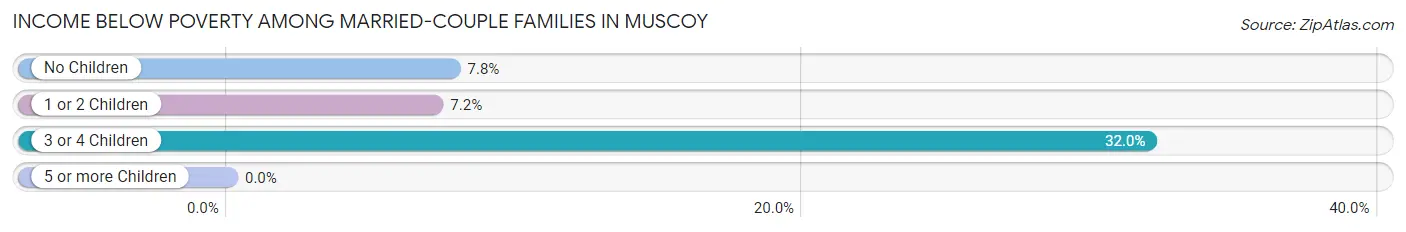
| Children | Above Poverty | Below Poverty |
| No Children | 381 (92.2%) | 32 (7.7%) |
| 1 or 2 Children | 597 (92.8%) | 46 (7.1%) |
| 3 or 4 Children | 119 (68.0%) | 56 (32.0%) |
| 5 or more Children | 35 (100.0%) | 0 (0.0%) |
| Total | 1,132 (89.4%) | 134 (10.6%) |
Income Below Poverty Among Single-Parent Households in Muscoy
According to the poverty data in Muscoy, 3.9% or 20 single-father households and 42.8% or 189 single-mother households are living below the poverty line. Among single-father households, those with 3 or 4 children have the highest poverty rate, with 7 households (13.7%) experiencing poverty. Likewise, among single-mother households, those with 5 or more children have the highest poverty rate, with 22 households (100.0%) falling below the poverty line.
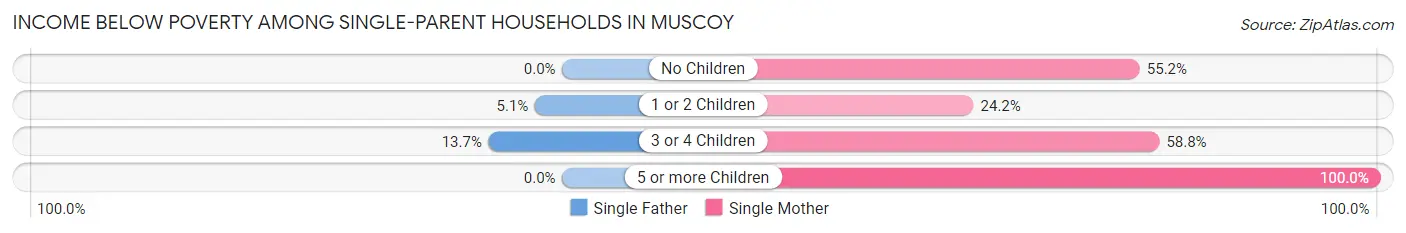
| Children | Single Father | Single Mother |
| No Children | 0 (0.0%) | 64 (55.2%) |
| 1 or 2 Children | 13 (5.1%) | 53 (24.2%) |
| 3 or 4 Children | 7 (13.7%) | 50 (58.8%) |
| 5 or more Children | 0 (0.0%) | 22 (100.0%) |
| Total | 20 (3.9%) | 189 (42.8%) |
Income Below Poverty Among Married-Couple vs Single-Parent Households in Muscoy
The poverty data for Muscoy shows that 134 of the married-couple family households (10.6%) and 209 of the single-parent households (22.0%) are living below the poverty level. Within the married-couple family households, those with 3 or 4 children have the highest poverty rate, with 56 households (32.0%) falling below the poverty line. Among the single-parent households, those with 3 or 4 children have the highest poverty rate, with 57 household (41.9%) living below poverty.
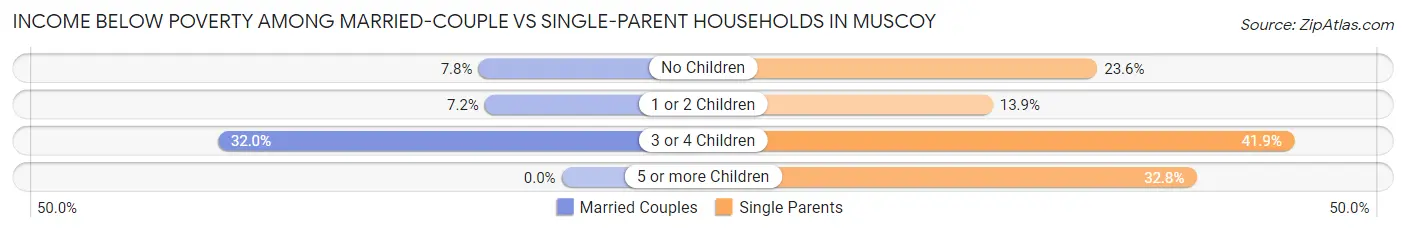
| Children | Married-Couple Families | Single-Parent Households |
| No Children | 32 (7.7%) | 64 (23.6%) |
| 1 or 2 Children | 46 (7.1%) | 66 (13.9%) |
| 3 or 4 Children | 56 (32.0%) | 57 (41.9%) |
| 5 or more Children | 0 (0.0%) | 22 (32.8%) |
| Total | 134 (10.6%) | 209 (22.0%) |
Race in Muscoy
The most populous races in Muscoy are Hispanic or Latino (10,815 | 91.6%), White / Caucasian (5,247 | 44.5%), and Some other Race (4,151 | 35.2%).
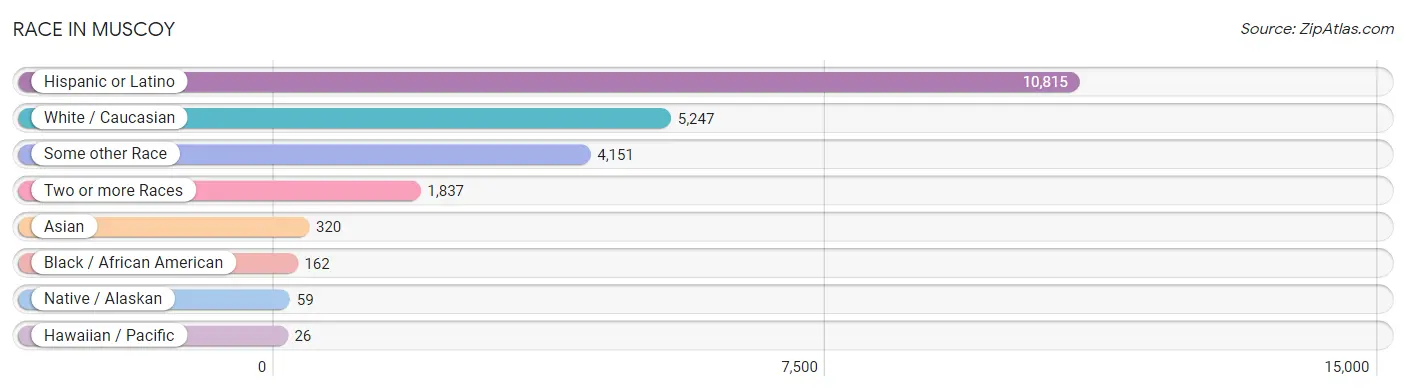
| Race | # Population | % Population |
| Asian | 320 | 2.7% |
| Black / African American | 162 | 1.4% |
| Hawaiian / Pacific | 26 | 0.2% |
| Hispanic or Latino | 10,815 | 91.6% |
| Native / Alaskan | 59 | 0.5% |
| White / Caucasian | 5,247 | 44.5% |
| Two or more Races | 1,837 | 15.6% |
| Some other Race | 4,151 | 35.2% |
| Total | 11,802 | 100.0% |
Ancestry in Muscoy
The most populous ancestries reported in Muscoy are Mexican (10,548 | 89.4%), Central American (197 | 1.7%), Thai (185 | 1.6%), Pakistani (121 | 1.0%), and Salvadoran (109 | 0.9%), together accounting for 94.6% of all Muscoy residents.
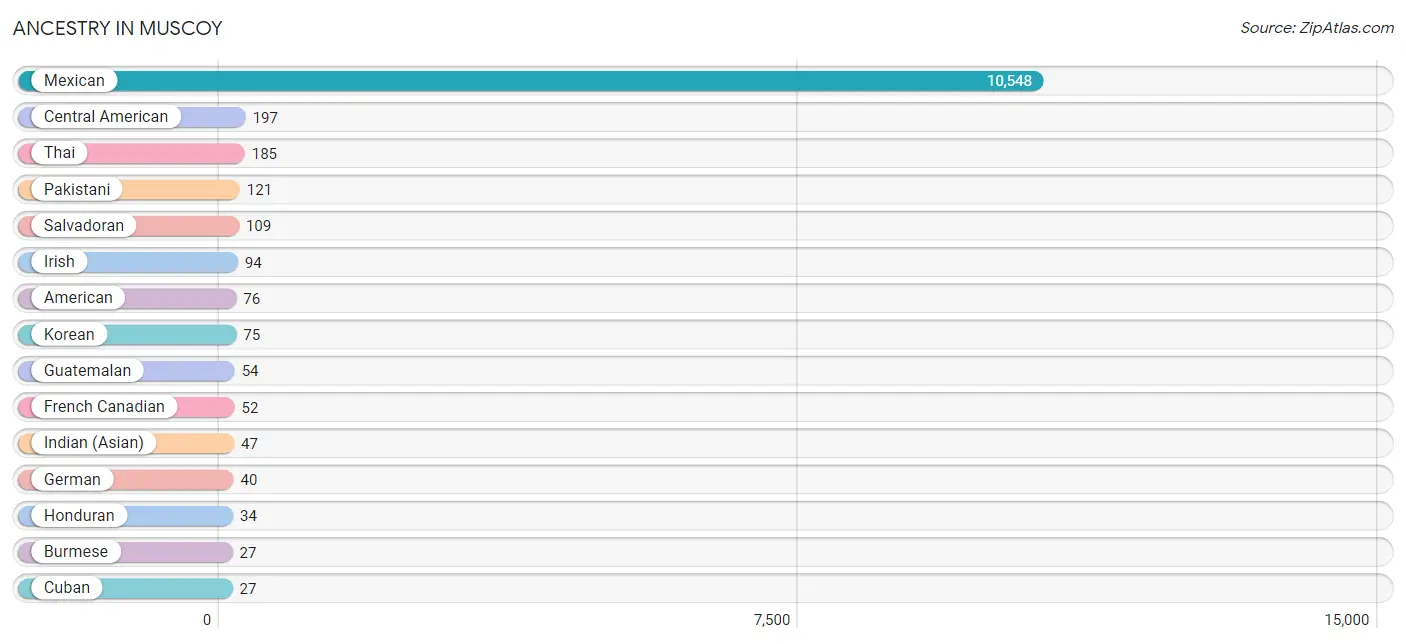
| Ancestry | # Population | % Population |
| American | 76 | 0.6% |
| Arab | 12 | 0.1% |
| Bhutanese | 19 | 0.2% |
| Burmese | 27 | 0.2% |
| Canadian | 4 | 0.0% |
| Central American | 197 | 1.7% |
| Central American Indian | 14 | 0.1% |
| Creek | 6 | 0.1% |
| Cuban | 27 | 0.2% |
| Danish | 10 | 0.1% |
| Dutch | 22 | 0.2% |
| English | 3 | 0.0% |
| French | 13 | 0.1% |
| French Canadian | 52 | 0.4% |
| German | 40 | 0.3% |
| Guatemalan | 54 | 0.5% |
| Honduran | 34 | 0.3% |
| Hungarian | 8 | 0.1% |
| Indian (Asian) | 47 | 0.4% |
| Irish | 94 | 0.8% |
| Italian | 20 | 0.2% |
| Jamaican | 23 | 0.2% |
| Japanese | 4 | 0.0% |
| Korean | 75 | 0.6% |
| Mexican | 10,548 | 89.4% |
| Mexican American Indian | 22 | 0.2% |
| Native Hawaiian | 19 | 0.2% |
| Nepalese | 4 | 0.0% |
| Pakistani | 121 | 1.0% |
| Puerto Rican | 14 | 0.1% |
| Salvadoran | 109 | 0.9% |
| Samoan | 7 | 0.1% |
| Slavic | 8 | 0.1% |
| Thai | 185 | 1.6% |
| Tongan | 7 | 0.1% | View All 35 Rows |
Immigrants in Muscoy
The most numerous immigrant groups reported in Muscoy came from Latin America (4,306 | 36.5%), Central America (4,254 | 36.0%), Mexico (4,105 | 34.8%), Asia (180 | 1.5%), and El Salvador (109 | 0.9%), together accounting for 109.8% of all Muscoy residents.
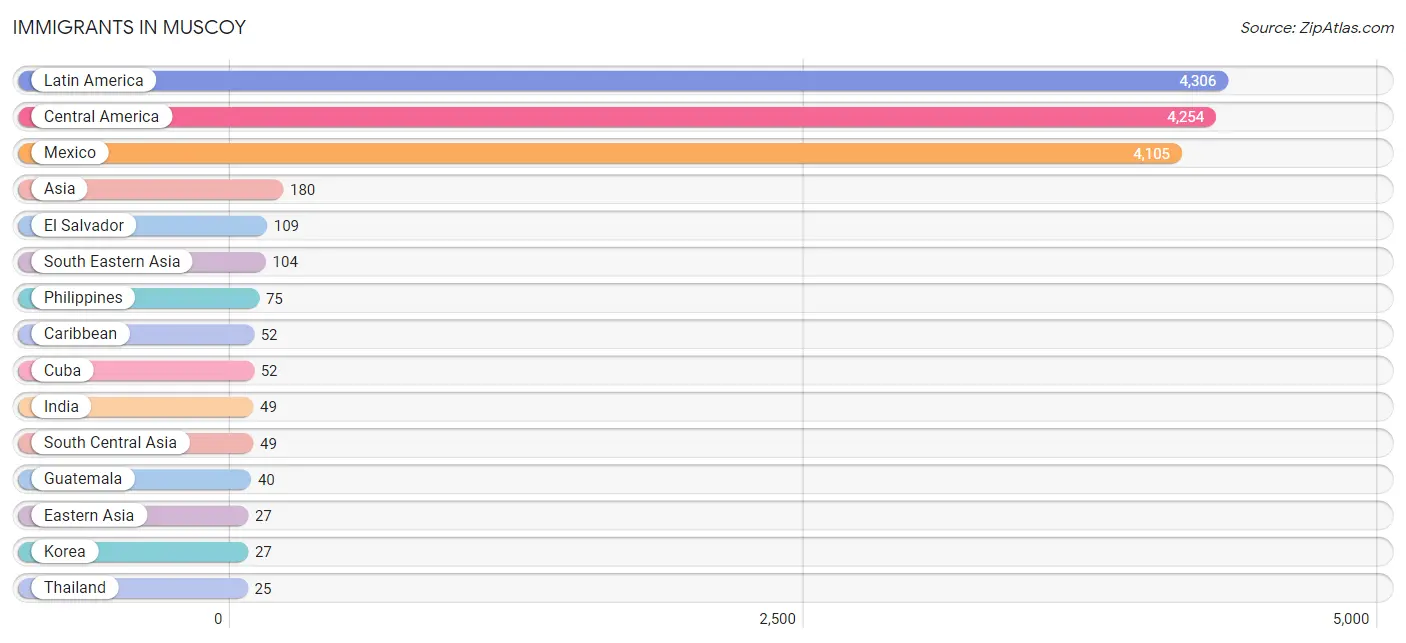
| Immigration Origin | # Population | % Population |
| Asia | 180 | 1.5% |
| Cambodia | 4 | 0.0% |
| Canada | 4 | 0.0% |
| Caribbean | 52 | 0.4% |
| Central America | 4,254 | 36.0% |
| Cuba | 52 | 0.4% |
| Eastern Asia | 27 | 0.2% |
| El Salvador | 109 | 0.9% |
| Guatemala | 40 | 0.3% |
| India | 49 | 0.4% |
| Korea | 27 | 0.2% |
| Latin America | 4,306 | 36.5% |
| Mexico | 4,105 | 34.8% |
| Philippines | 75 | 0.6% |
| South Central Asia | 49 | 0.4% |
| South Eastern Asia | 104 | 0.9% |
| Thailand | 25 | 0.2% | View All 17 Rows |
Sex and Age in Muscoy
Sex and Age in Muscoy
The most populous age groups in Muscoy are 20 to 24 Years (654 | 10.2%) for men and 25 to 29 Years (565 | 10.4%) for women.
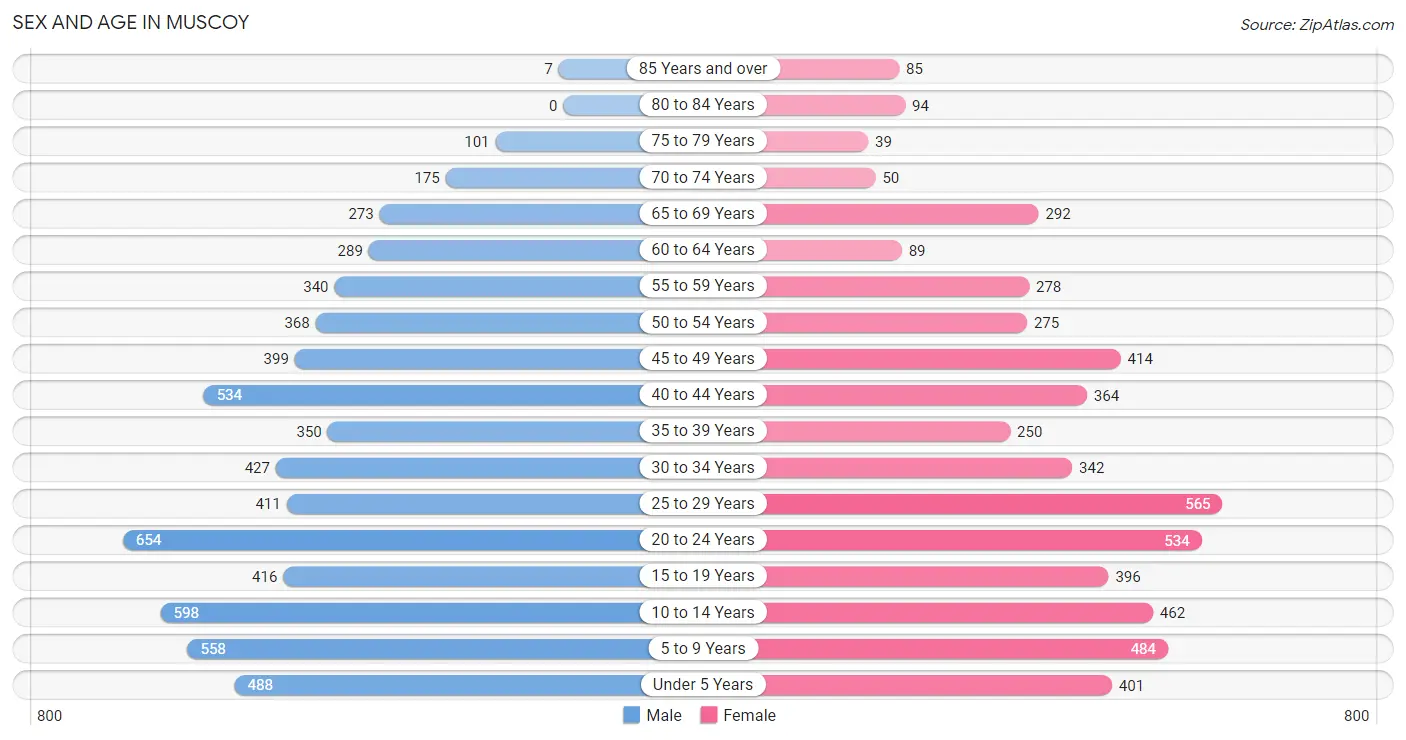
| Age Bracket | Male | Female |
| Under 5 Years | 488 (7.6%) | 401 (7.4%) |
| 5 to 9 Years | 558 (8.7%) | 484 (8.9%) |
| 10 to 14 Years | 598 (9.4%) | 462 (8.5%) |
| 15 to 19 Years | 416 (6.5%) | 396 (7.3%) |
| 20 to 24 Years | 654 (10.2%) | 534 (9.9%) |
| 25 to 29 Years | 411 (6.4%) | 565 (10.4%) |
| 30 to 34 Years | 427 (6.7%) | 342 (6.3%) |
| 35 to 39 Years | 350 (5.5%) | 250 (4.6%) |
| 40 to 44 Years | 534 (8.4%) | 364 (6.7%) |
| 45 to 49 Years | 399 (6.2%) | 414 (7.6%) |
| 50 to 54 Years | 368 (5.8%) | 275 (5.1%) |
| 55 to 59 Years | 340 (5.3%) | 278 (5.1%) |
| 60 to 64 Years | 289 (4.5%) | 89 (1.6%) |
| 65 to 69 Years | 273 (4.3%) | 292 (5.4%) |
| 70 to 74 Years | 175 (2.7%) | 50 (0.9%) |
| 75 to 79 Years | 101 (1.6%) | 39 (0.7%) |
| 80 to 84 Years | 0 (0.0%) | 94 (1.7%) |
| 85 Years and over | 7 (0.1%) | 85 (1.6%) |
| Total | 6,388 (100.0%) | 5,414 (100.0%) |
Families and Households in Muscoy
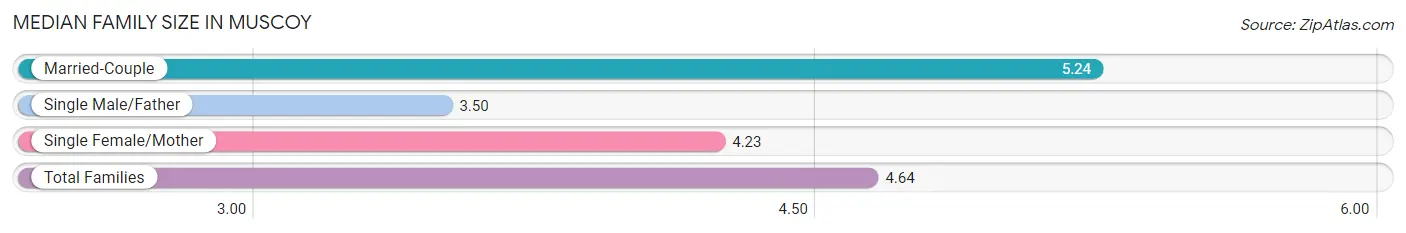
Median Family Size in Muscoy
The median family size in Muscoy is 4.64 persons per family, with married-couple families (1,266 | 57.2%) accounting for the largest median family size of 5.24 persons per family. On the other hand, single male/father families (507 | 22.9%) represent the smallest median family size with 3.50 persons per family.
| Family Type | # Families | Family Size |
| Married-Couple | 1,266 (57.2%) | 5.24 |
| Single Male/Father | 507 (22.9%) | 3.50 |
| Single Female/Mother | 442 (20.0%) | 4.23 |
| Total Families | 2,215 (100.0%) | 4.64 |
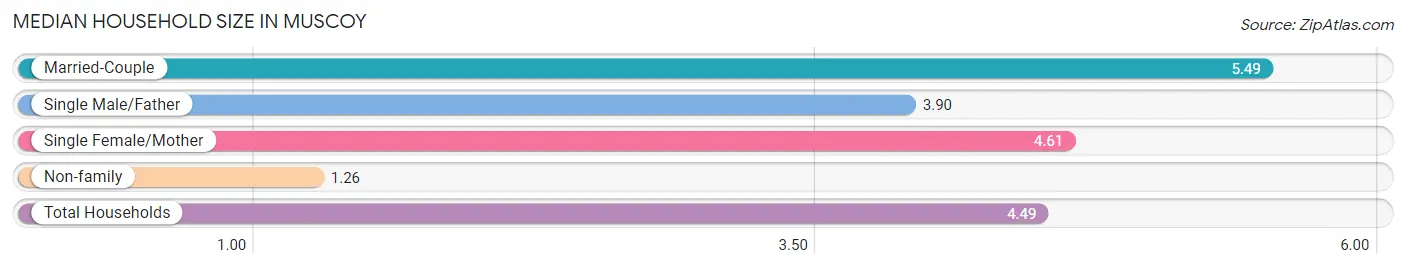
Median Household Size in Muscoy
The median household size in Muscoy is 4.49 persons per household, with married-couple households (1,266 | 50.1%) accounting for the largest median household size of 5.49 persons per household. non-family households (313 | 12.4%) represent the smallest median household size with 1.26 persons per household.
| Household Type | # Households | Household Size |
| Married-Couple | 1,266 (50.1%) | 5.49 |
| Single Male/Father | 507 (20.1%) | 3.90 |
| Single Female/Mother | 442 (17.5%) | 4.61 |
| Non-family | 313 (12.4%) | 1.26 |
| Total Households | 2,528 (100.0%) | 4.49 |
Household Size by Marriage Status in Muscoy
Out of a total of 2,528 households in Muscoy, 2,215 (87.6%) are family households, while 313 (12.4%) are nonfamily households. The most numerous type of family households are 4-person households, comprising 692, and the most common type of nonfamily households are 1-person households, comprising 286.
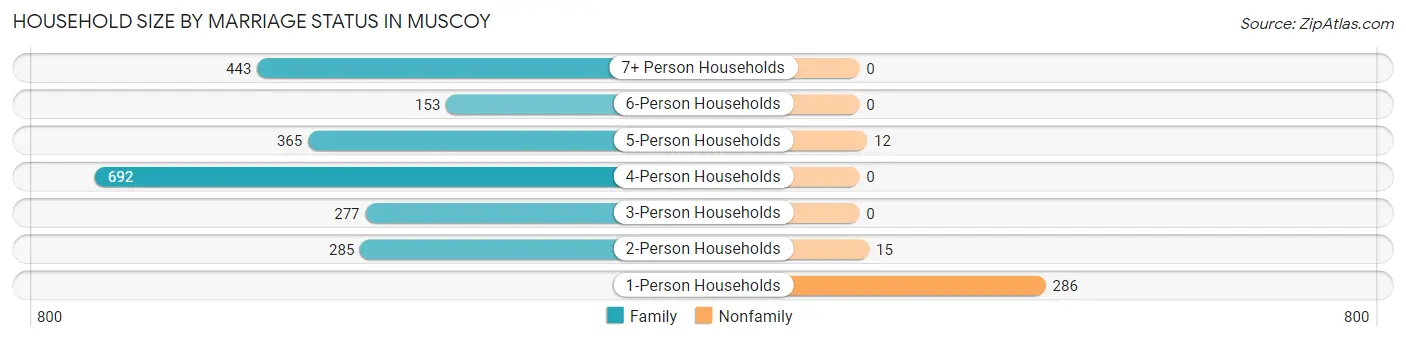
| Household Size | Family Households | Nonfamily Households |
| 1-Person Households | - | 286 (11.3%) |
| 2-Person Households | 285 (11.3%) | 15 (0.6%) |
| 3-Person Households | 277 (11.0%) | 0 (0.0%) |
| 4-Person Households | 692 (27.4%) | 0 (0.0%) |
| 5-Person Households | 365 (14.4%) | 12 (0.5%) |
| 6-Person Households | 153 (6.0%) | 0 (0.0%) |
| 7+ Person Households | 443 (17.5%) | 0 (0.0%) |
| Total | 2,215 (87.6%) | 313 (12.4%) |
Female Fertility in Muscoy
Fertility by Age in Muscoy
Average fertility rate in Muscoy is 64.0 births per 1,000 women. Women in the age bracket of 20 to 34 years have the highest fertility rate with 122.0 births per 1,000 women. Women in the age bracket of 20 to 34 years acount for 95.7% of all women with births.
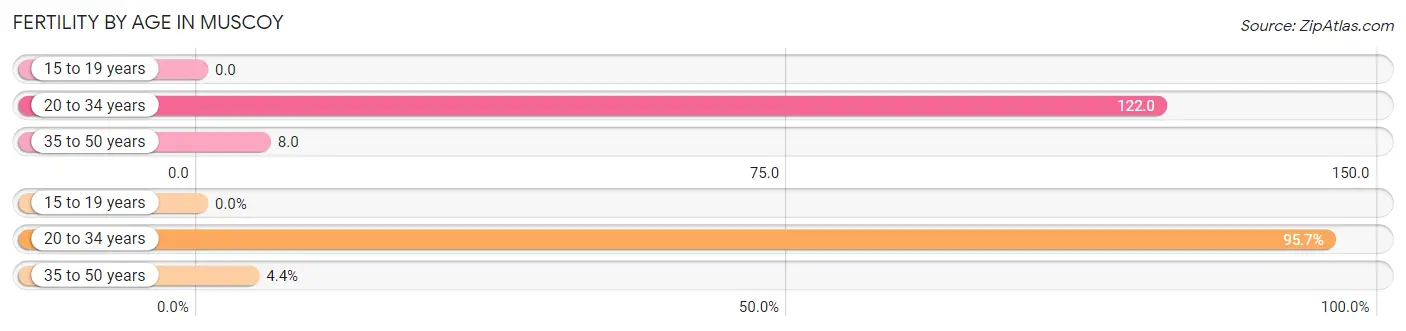
| Age Bracket | Women with Births | Births / 1,000 Women |
| 15 to 19 years | 0 (0.0%) | 0.0 |
| 20 to 34 years | 176 (95.7%) | 122.0 |
| 35 to 50 years | 8 (4.3%) | 8.0 |
| Total | 184 (100.0%) | 64.0 |
Fertility by Age by Marriage Status in Muscoy
34.2% of women with births (184) in Muscoy are married. The highest percentage of unmarried women with births falls into 20 to 34 years age bracket with 68.8% of them unmarried at the time of birth, while the lowest percentage of unmarried women with births belong to 35 to 50 years age bracket with 0.0% of them unmarried.
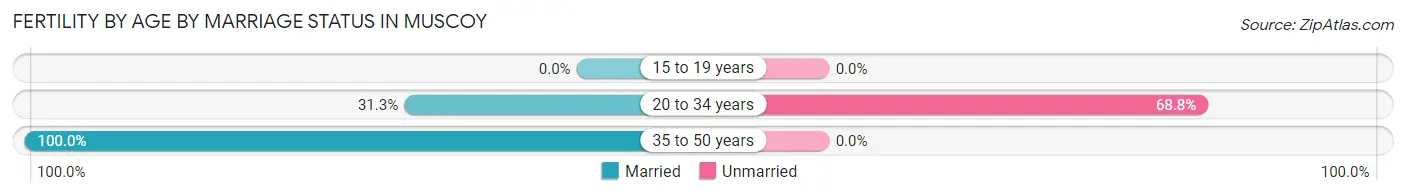
| Age Bracket | Married | Unmarried |
| 15 to 19 years | 0 (0.0%) | 0 (0.0%) |
| 20 to 34 years | 55 (31.2%) | 121 (68.8%) |
| 35 to 50 years | 8 (100.0%) | 0 (0.0%) |
| Total | 63 (34.2%) | 121 (65.8%) |
Fertility by Education in Muscoy
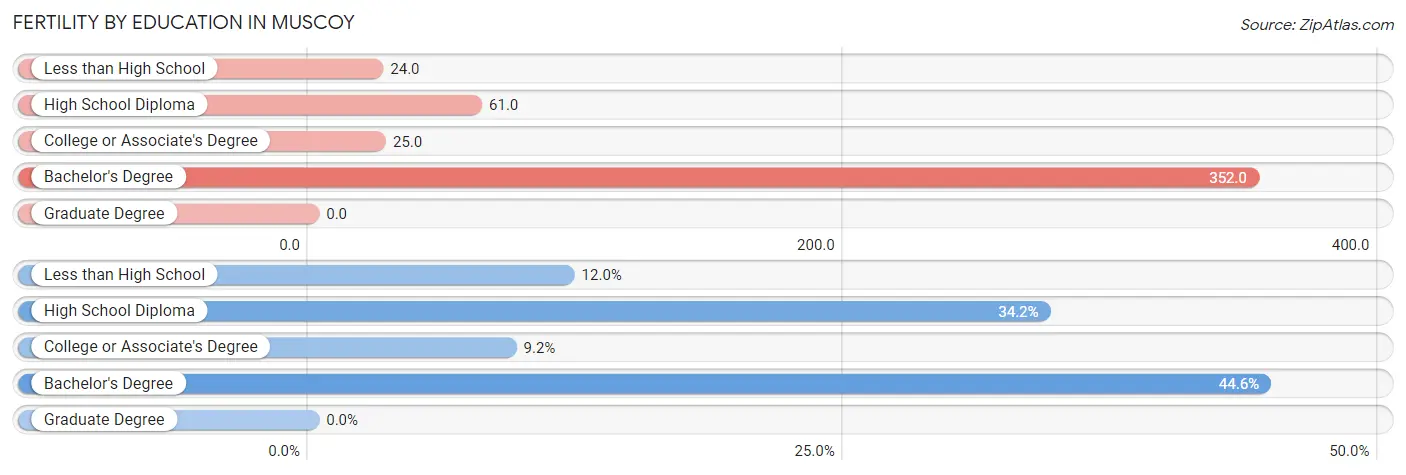
| Educational Attainment | Women with Births | Births / 1,000 Women |
| Less than High School | 22 (12.0%) | 24.0 |
| High School Diploma | 63 (34.2%) | 61.0 |
| College or Associate's Degree | 17 (9.2%) | 25.0 |
| Bachelor's Degree | 82 (44.6%) | 352.0 |
| Graduate Degree | 0 (0.0%) | 0.0 |
| Total | 184 (100.0%) | 64.0 |
Fertility by Education by Marriage Status in Muscoy
65.8% of women with births in Muscoy are unmarried. Women with the educational attainment of high school diploma are most likely to be married with 100.0% of them married at childbirth, while women with the educational attainment of less than high school are least likely to be married with 100.0% of them unmarried at childbirth.
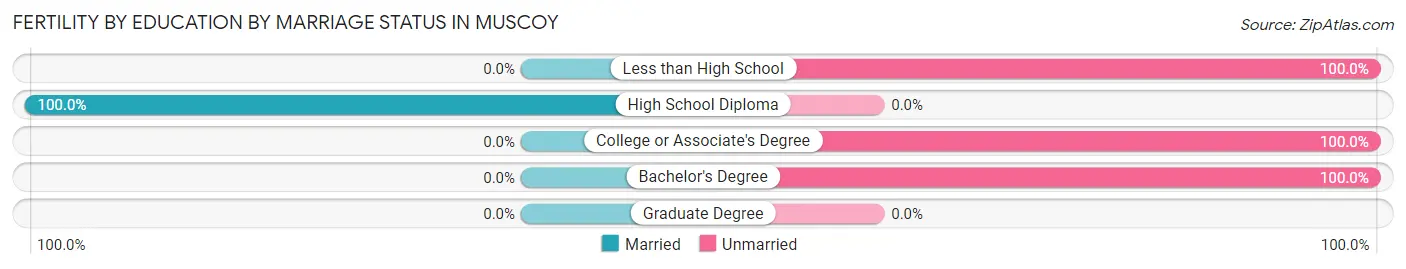
| Educational Attainment | Married | Unmarried |
| Less than High School | 0 (0.0%) | 22 (100.0%) |
| High School Diploma | 63 (100.0%) | 0 (0.0%) |
| College or Associate's Degree | 0 (0.0%) | 17 (100.0%) |
| Bachelor's Degree | 0 (0.0%) | 82 (100.0%) |
| Graduate Degree | 0 (0.0%) | 0 (0.0%) |
| Total | 63 (34.2%) | 121 (65.8%) |
Employment Characteristics in Muscoy
Employment by Class of Employer in Muscoy
Among the 4,526 employed individuals in Muscoy, private company employees (3,404 | 75.2%), self-employed (not incorporated) (489 | 10.8%), and not-for-profit organizations (203 | 4.5%) make up the most common classes of employment.
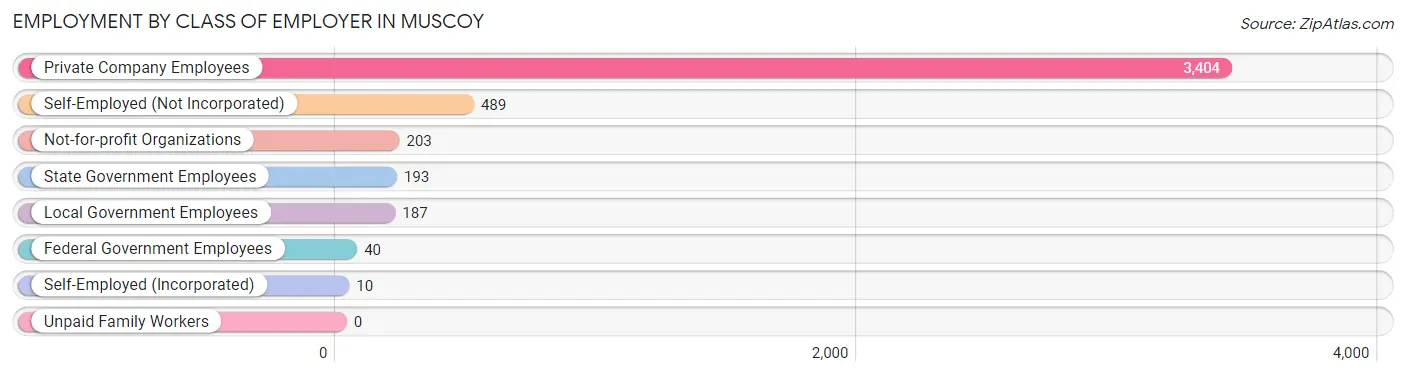
| Employer Class | # Employees | % Employees |
| Private Company Employees | 3,404 | 75.2% |
| Self-Employed (Incorporated) | 10 | 0.2% |
| Self-Employed (Not Incorporated) | 489 | 10.8% |
| Not-for-profit Organizations | 203 | 4.5% |
| Local Government Employees | 187 | 4.1% |
| State Government Employees | 193 | 4.3% |
| Federal Government Employees | 40 | 0.9% |
| Unpaid Family Workers | 0 | 0.0% |
| Total | 4,526 | 100.0% |
Employment Status by Age in Muscoy
According to the labor force statistics for Muscoy, out of the total population over 16 years of age (8,667), 57.8% or 5,010 individuals are in the labor force, with 8.4% or 421 of them unemployed. The age group with the highest labor force participation rate is 35 to 44 years, with 81.7% or 1,224 individuals in the labor force. Within the labor force, the 35 to 44 years age range has the highest percentage of unemployed individuals, with 15.8% or 193 of them being unemployed.
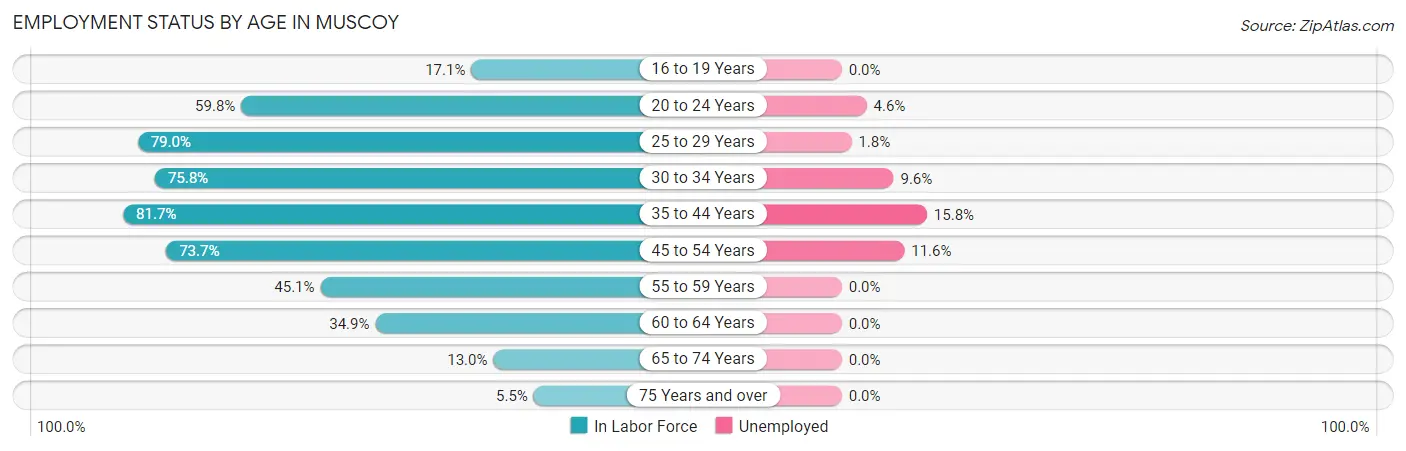
| Age Bracket | In Labor Force | Unemployed |
| 16 to 19 Years | 114 (17.1%) | 0 (0.0%) |
| 20 to 24 Years | 710 (59.8%) | 33 (4.6%) |
| 25 to 29 Years | 771 (79.0%) | 14 (1.8%) |
| 30 to 34 Years | 583 (75.8%) | 56 (9.6%) |
| 35 to 44 Years | 1,224 (81.7%) | 193 (15.8%) |
| 45 to 54 Years | 1,073 (73.7%) | 124 (11.6%) |
| 55 to 59 Years | 279 (45.1%) | 0 (0.0%) |
| 60 to 64 Years | 132 (34.9%) | 0 (0.0%) |
| 65 to 74 Years | 103 (13.0%) | 0 (0.0%) |
| 75 Years and over | 18 (5.5%) | 0 (0.0%) |
| Total | 5,010 (57.8%) | 421 (8.4%) |
Employment Status by Educational Attainment in Muscoy
According to labor force statistics for Muscoy, 71.3% of individuals (4,061) out of the total population between 25 and 64 years of age (5,695) are in the labor force, with 9.6% or 390 of them being unemployed. The group with the highest labor force participation rate are those with the educational attainment of bachelor's degree or higher, with 89.9% or 358 individuals in the labor force. Within the labor force, individuals with less than high school education have the highest percentage of unemployment, with 13.5% or 207 of them being unemployed.
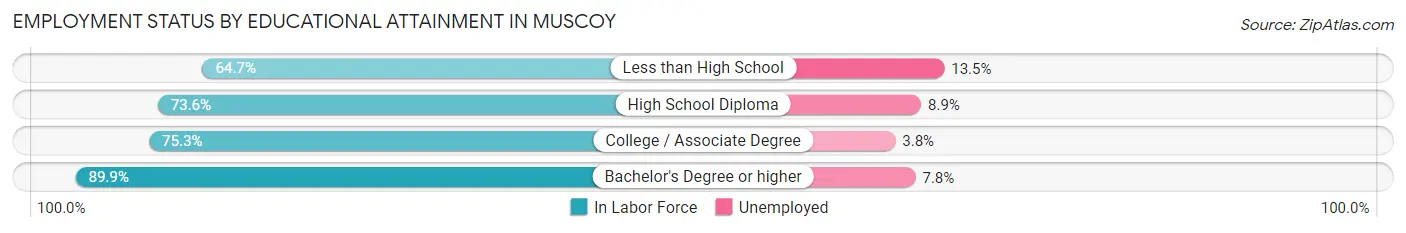
| Educational Attainment | In Labor Force | Unemployed |
| Less than High School | 1,530 (64.7%) | 319 (13.5%) |
| High School Diploma | 1,409 (73.6%) | 170 (8.9%) |
| College / Associate Degree | 766 (75.3%) | 39 (3.8%) |
| Bachelor's Degree or higher | 358 (89.9%) | 31 (7.8%) |
| Total | 4,061 (71.3%) | 547 (9.6%) |
Employment Occupations by Sex in Muscoy
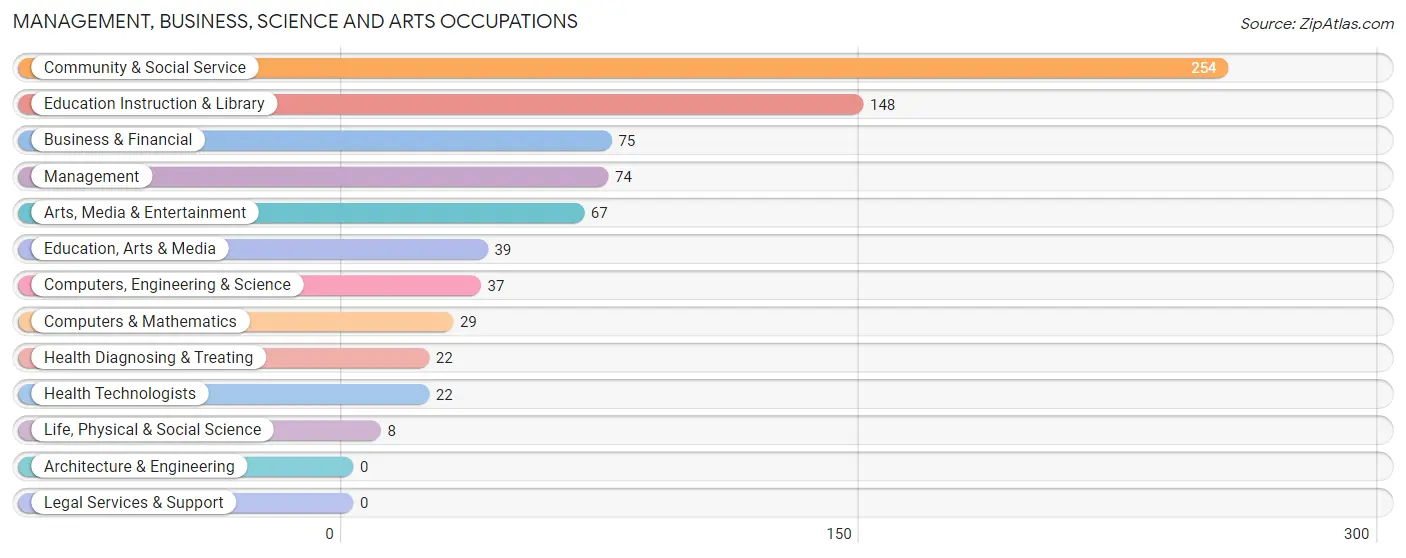
Management, Business, Science and Arts Occupations
The most common Management, Business, Science and Arts occupations in Muscoy are Community & Social Service (254 | 5.6%), Education Instruction & Library (148 | 3.2%), Business & Financial (75 | 1.6%), Management (74 | 1.6%), and Arts, Media & Entertainment (67 | 1.5%).
Management, Business, Science and Arts Occupations by Sex
Within the Management, Business, Science and Arts occupations in Muscoy, the most male-oriented occupations are Computers & Mathematics (100.0%), Management (94.6%), and Computers, Engineering & Science (78.4%), while the most female-oriented occupations are Business & Financial (100.0%), Life, Physical & Social Science (100.0%), and Education Instruction & Library (100.0%).
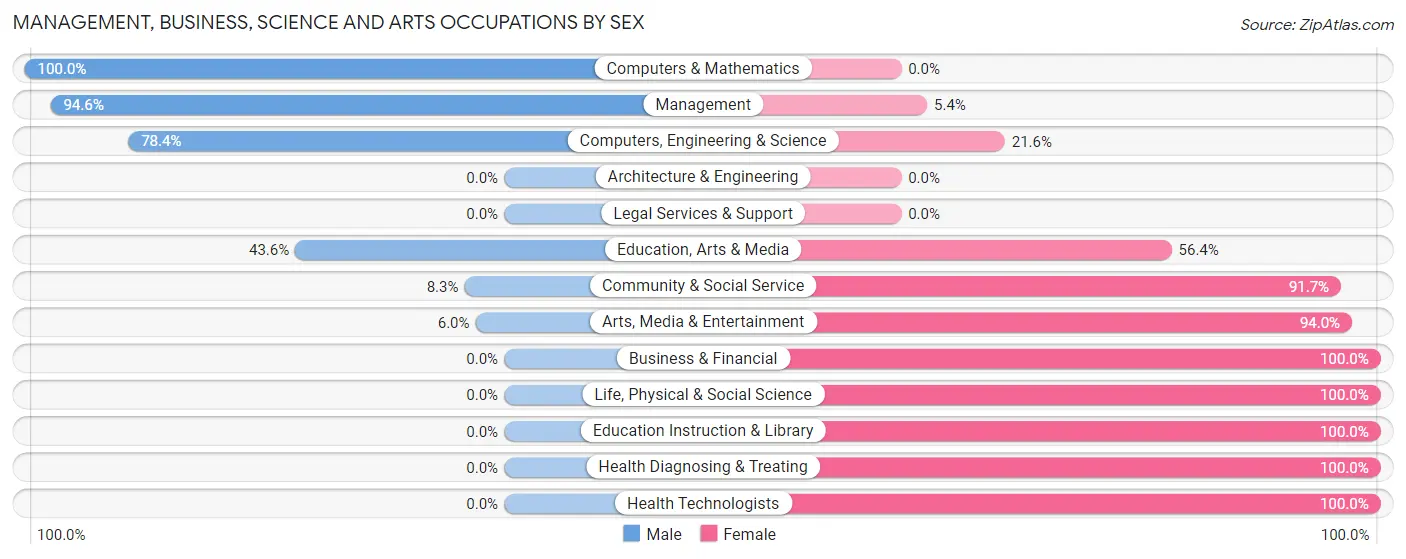
| Occupation | Male | Female |
| Management | 70 (94.6%) | 4 (5.4%) |
| Business & Financial | 0 (0.0%) | 75 (100.0%) |
| Computers, Engineering & Science | 29 (78.4%) | 8 (21.6%) |
| Computers & Mathematics | 29 (100.0%) | 0 (0.0%) |
| Architecture & Engineering | 0 (0.0%) | 0 (0.0%) |
| Life, Physical & Social Science | 0 (0.0%) | 8 (100.0%) |
| Community & Social Service | 21 (8.3%) | 233 (91.7%) |
| Education, Arts & Media | 17 (43.6%) | 22 (56.4%) |
| Legal Services & Support | 0 (0.0%) | 0 (0.0%) |
| Education Instruction & Library | 0 (0.0%) | 148 (100.0%) |
| Arts, Media & Entertainment | 4 (6.0%) | 63 (94.0%) |
| Health Diagnosing & Treating | 0 (0.0%) | 22 (100.0%) |
| Health Technologists | 0 (0.0%) | 22 (100.0%) |
| Total (Category) | 120 (26.0%) | 342 (74.0%) |
| Total (Overall) | 2,788 (61.1%) | 1,778 (38.9%) |
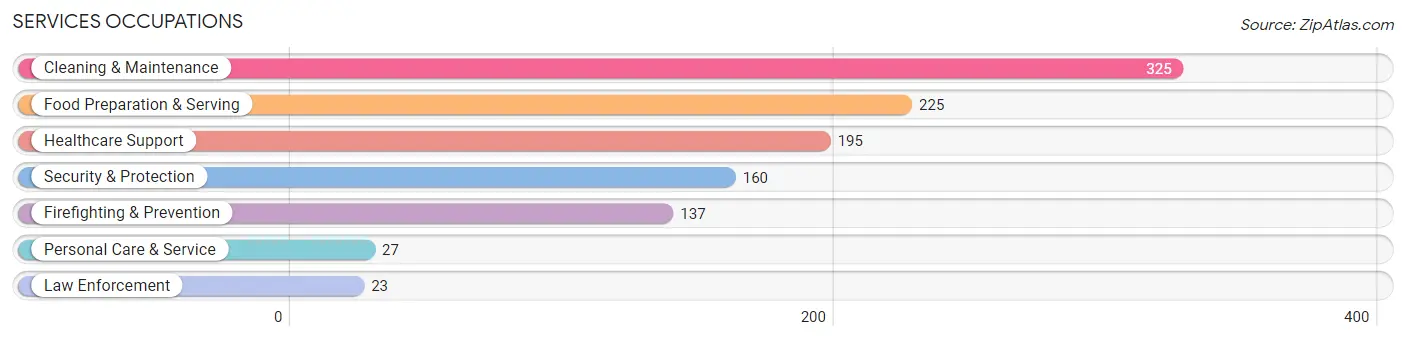
Services Occupations
The most common Services occupations in Muscoy are Cleaning & Maintenance (325 | 7.1%), Food Preparation & Serving (225 | 4.9%), Healthcare Support (195 | 4.3%), Security & Protection (160 | 3.5%), and Firefighting & Prevention (137 | 3.0%).
Services Occupations by Sex
Within the Services occupations in Muscoy, the most male-oriented occupations are Firefighting & Prevention (79.6%), Food Preparation & Serving (68.4%), and Security & Protection (68.1%), while the most female-oriented occupations are Healthcare Support (100.0%), Law Enforcement (100.0%), and Personal Care & Service (100.0%).
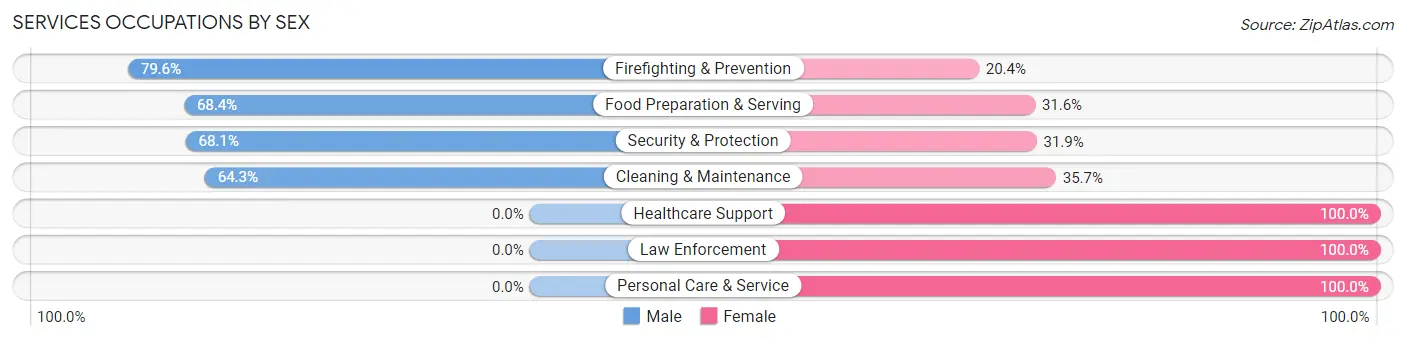
| Occupation | Male | Female |
| Healthcare Support | 0 (0.0%) | 195 (100.0%) |
| Security & Protection | 109 (68.1%) | 51 (31.9%) |
| Firefighting & Prevention | 109 (79.6%) | 28 (20.4%) |
| Law Enforcement | 0 (0.0%) | 23 (100.0%) |
| Food Preparation & Serving | 154 (68.4%) | 71 (31.6%) |
| Cleaning & Maintenance | 209 (64.3%) | 116 (35.7%) |
| Personal Care & Service | 0 (0.0%) | 27 (100.0%) |
| Total (Category) | 472 (50.6%) | 460 (49.4%) |
| Total (Overall) | 2,788 (61.1%) | 1,778 (38.9%) |
Sales and Office Occupations
The most common Sales and Office occupations in Muscoy are Office & Administration (658 | 14.4%), and Sales & Related (508 | 11.1%).

Sales and Office Occupations by Sex
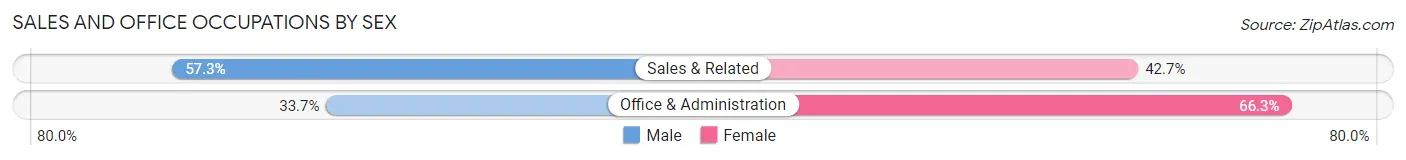
| Occupation | Male | Female |
| Sales & Related | 291 (57.3%) | 217 (42.7%) |
| Office & Administration | 222 (33.7%) | 436 (66.3%) |
| Total (Category) | 513 (44.0%) | 653 (56.0%) |
| Total (Overall) | 2,788 (61.1%) | 1,778 (38.9%) |
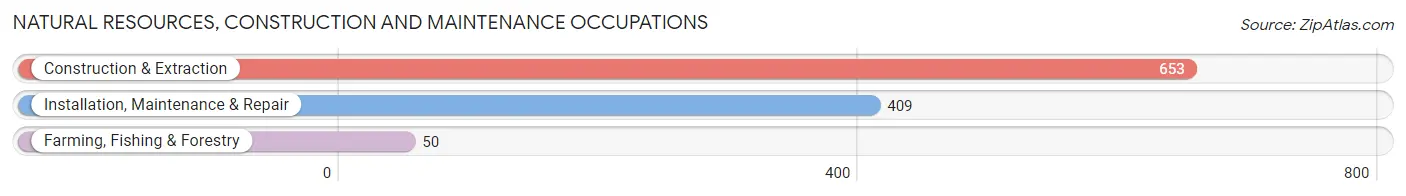
Natural Resources, Construction and Maintenance Occupations
The most common Natural Resources, Construction and Maintenance occupations in Muscoy are Construction & Extraction (653 | 14.3%), Installation, Maintenance & Repair (409 | 9.0%), and Farming, Fishing & Forestry (50 | 1.1%).
Natural Resources, Construction and Maintenance Occupations by Sex
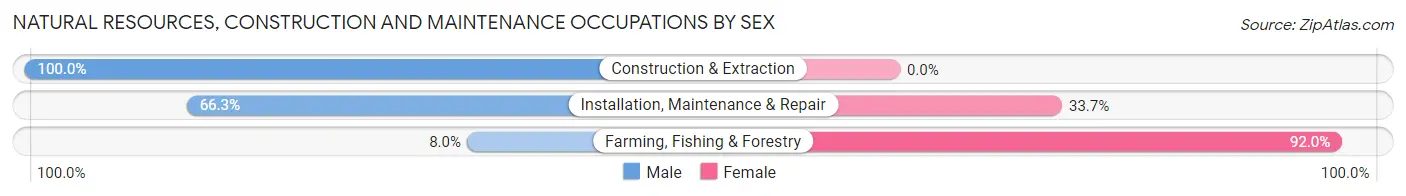
| Occupation | Male | Female |
| Farming, Fishing & Forestry | 4 (8.0%) | 46 (92.0%) |
| Construction & Extraction | 653 (100.0%) | 0 (0.0%) |
| Installation, Maintenance & Repair | 271 (66.3%) | 138 (33.7%) |
| Total (Category) | 928 (83.5%) | 184 (16.6%) |
| Total (Overall) | 2,788 (61.1%) | 1,778 (38.9%) |
Production, Transportation and Moving Occupations
The most common Production, Transportation and Moving occupations in Muscoy are Production (397 | 8.7%), Material Moving (298 | 6.5%), and Transportation (199 | 4.4%).
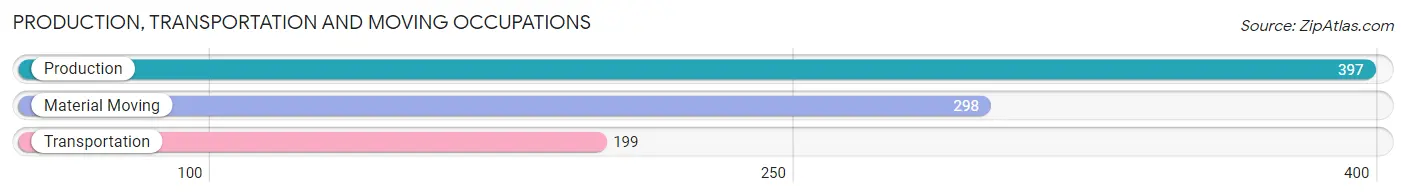
Production, Transportation and Moving Occupations by Sex
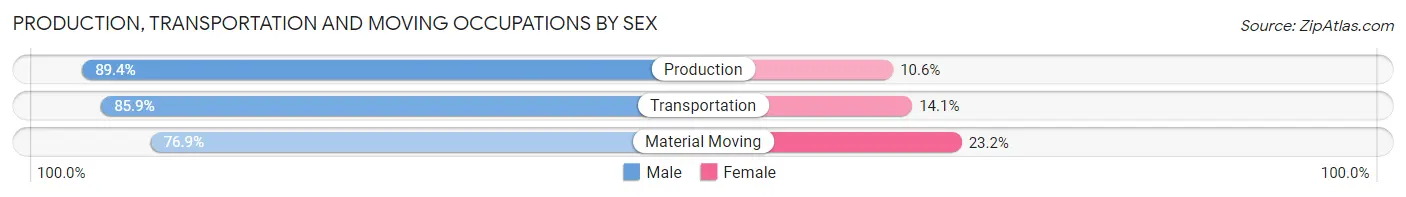
| Occupation | Male | Female |
| Production | 355 (89.4%) | 42 (10.6%) |
| Transportation | 171 (85.9%) | 28 (14.1%) |
| Material Moving | 229 (76.8%) | 69 (23.2%) |
| Total (Category) | 755 (84.5%) | 139 (15.5%) |
| Total (Overall) | 2,788 (61.1%) | 1,778 (38.9%) |
Employment Industries by Sex in Muscoy
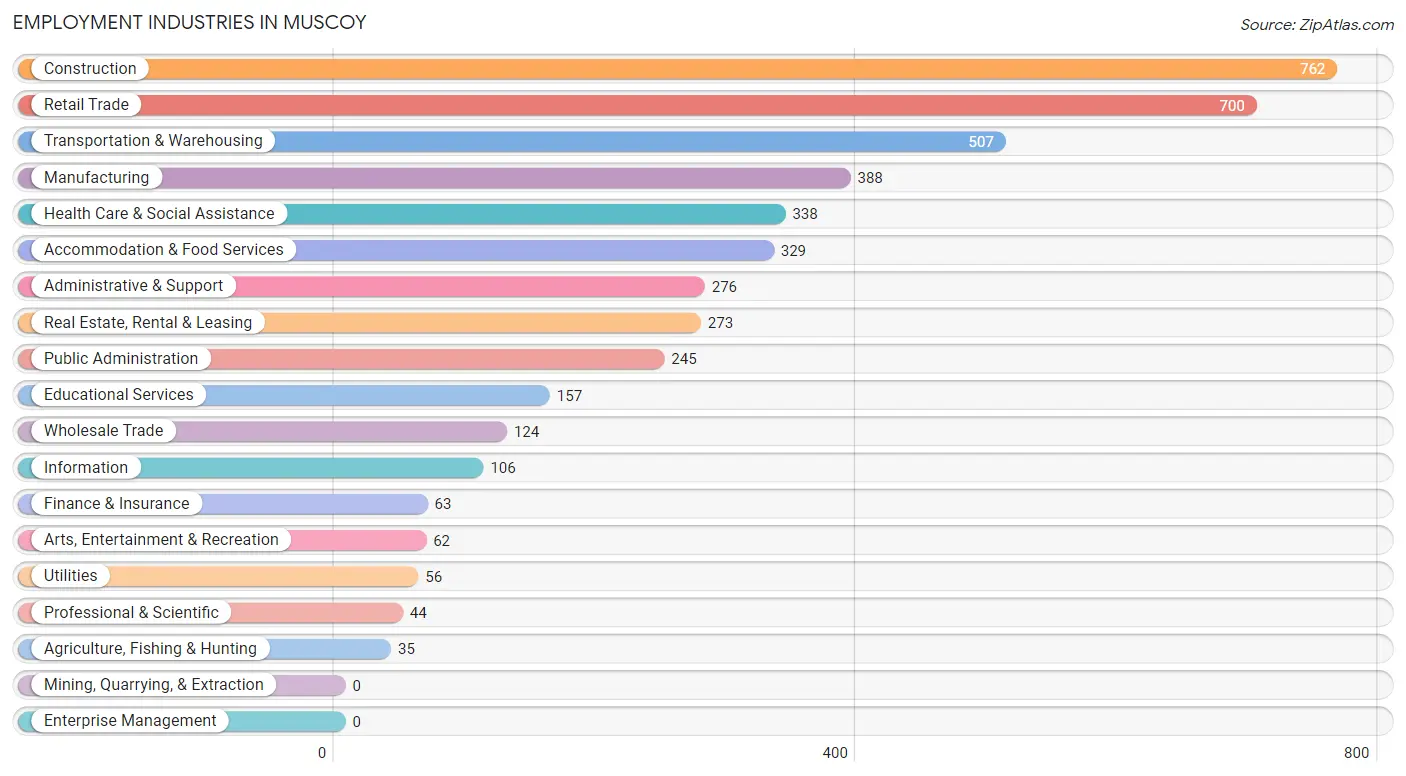
Employment Industries in Muscoy
The major employment industries in Muscoy include Construction (762 | 16.7%), Retail Trade (700 | 15.3%), Transportation & Warehousing (507 | 11.1%), Manufacturing (388 | 8.5%), and Health Care & Social Assistance (338 | 7.4%).
Employment Industries by Sex in Muscoy
The Muscoy industries that see more men than women are Construction (100.0%), Utilities (100.0%), and Arts, Entertainment & Recreation (100.0%), whereas the industries that tend to have a higher number of women are Information (100.0%), Educational Services (100.0%), and Health Care & Social Assistance (98.8%).
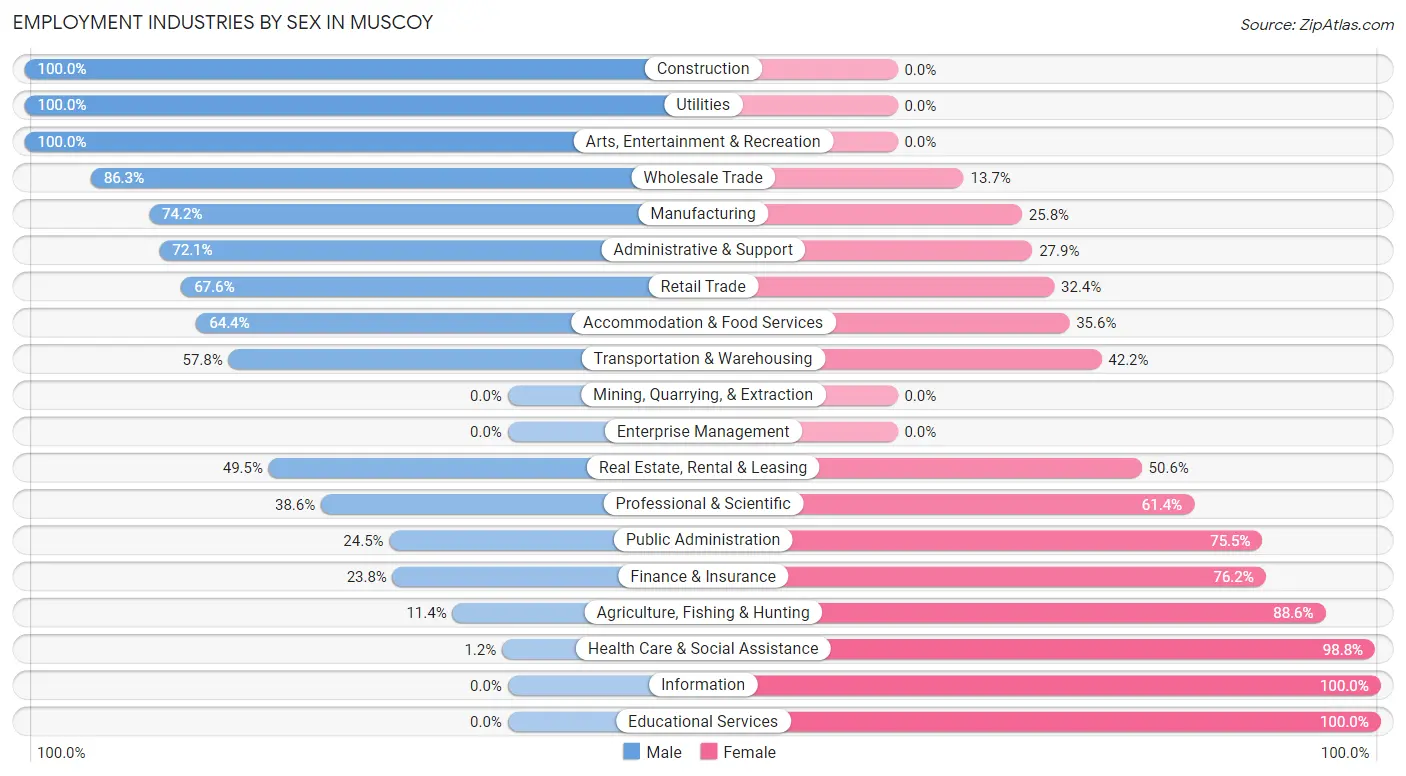
| Industry | Male | Female |
| Agriculture, Fishing & Hunting | 4 (11.4%) | 31 (88.6%) |
| Mining, Quarrying, & Extraction | 0 (0.0%) | 0 (0.0%) |
| Construction | 762 (100.0%) | 0 (0.0%) |
| Manufacturing | 288 (74.2%) | 100 (25.8%) |
| Wholesale Trade | 107 (86.3%) | 17 (13.7%) |
| Retail Trade | 473 (67.6%) | 227 (32.4%) |
| Transportation & Warehousing | 293 (57.8%) | 214 (42.2%) |
| Utilities | 56 (100.0%) | 0 (0.0%) |
| Information | 0 (0.0%) | 106 (100.0%) |
| Finance & Insurance | 15 (23.8%) | 48 (76.2%) |
| Real Estate, Rental & Leasing | 135 (49.4%) | 138 (50.5%) |
| Professional & Scientific | 17 (38.6%) | 27 (61.4%) |
| Enterprise Management | 0 (0.0%) | 0 (0.0%) |
| Administrative & Support | 199 (72.1%) | 77 (27.9%) |
| Educational Services | 0 (0.0%) | 157 (100.0%) |
| Health Care & Social Assistance | 4 (1.2%) | 334 (98.8%) |
| Arts, Entertainment & Recreation | 62 (100.0%) | 0 (0.0%) |
| Accommodation & Food Services | 212 (64.4%) | 117 (35.6%) |
| Public Administration | 60 (24.5%) | 185 (75.5%) |
| Total | 2,788 (61.1%) | 1,778 (38.9%) |
Education in Muscoy
School Enrollment in Muscoy
The most common levels of schooling among the 3,213 students in Muscoy are middle school (832 | 25.9%), high school (778 | 24.2%), and elementary school (626 | 19.5%).
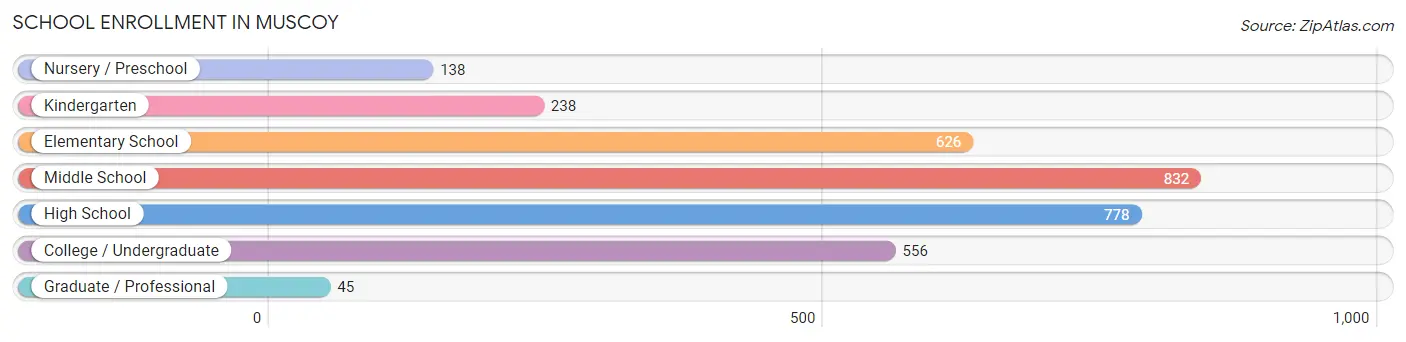
| School Level | # Students | % Students |
| Nursery / Preschool | 138 | 4.3% |
| Kindergarten | 238 | 7.4% |
| Elementary School | 626 | 19.5% |
| Middle School | 832 | 25.9% |
| High School | 778 | 24.2% |
| College / Undergraduate | 556 | 17.3% |
| Graduate / Professional | 45 | 1.4% |
| Total | 3,213 | 100.0% |
School Enrollment by Age by Funding Source in Muscoy
Out of a total of 3,213 students who are enrolled in schools in Muscoy, 125 (3.9%) attend a private institution, while the remaining 3,088 (96.1%) are enrolled in public schools. The age group of 35 years and over has the highest likelihood of being enrolled in private schools, with 12 (20.7% in the age bracket) enrolled. Conversely, the age group of 3 to 4 year olds has the lowest likelihood of being enrolled in a private school, with 94 (100.0% in the age bracket) attending a public institution.
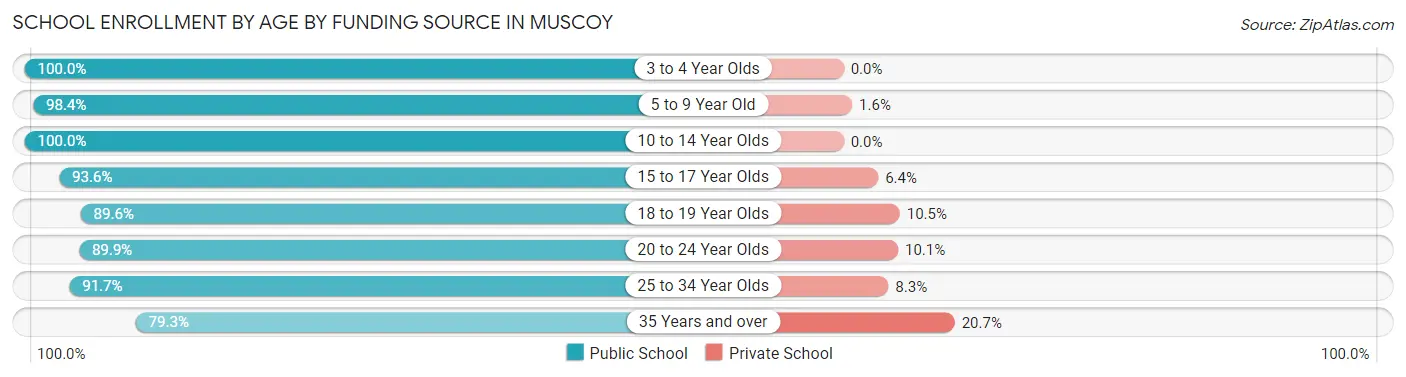
| Age Bracket | Public School | Private School |
| 3 to 4 Year Olds | 94 (100.0%) | 0 (0.0%) |
| 5 to 9 Year Old | 873 (98.4%) | 14 (1.6%) |
| 10 to 14 Year Olds | 998 (100.0%) | 0 (0.0%) |
| 15 to 17 Year Olds | 451 (93.6%) | 31 (6.4%) |
| 18 to 19 Year Olds | 240 (89.5%) | 28 (10.4%) |
| 20 to 24 Year Olds | 275 (89.9%) | 31 (10.1%) |
| 25 to 34 Year Olds | 110 (91.7%) | 10 (8.3%) |
| 35 Years and over | 46 (79.3%) | 12 (20.7%) |
| Total | 3,088 (96.1%) | 125 (3.9%) |
Educational Attainment by Field of Study in Muscoy
Business (146 | 33.8%), arts & humanities (83 | 19.2%), liberal arts & history (70 | 16.2%), literature & languages (62 | 14.3%), and social sciences (25 | 5.8%) are the most common fields of study among 432 individuals in Muscoy who have obtained a bachelor's degree or higher.
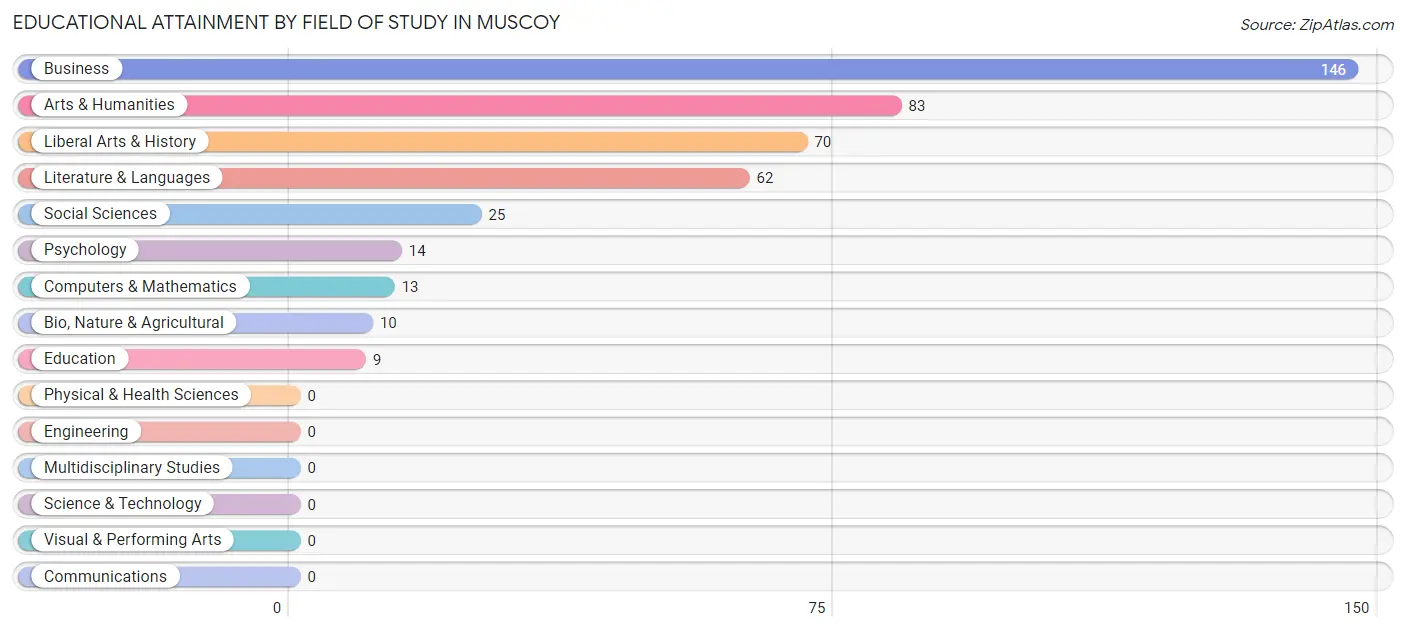
| Field of Study | # Graduates | % Graduates |
| Computers & Mathematics | 13 | 3.0% |
| Bio, Nature & Agricultural | 10 | 2.3% |
| Physical & Health Sciences | 0 | 0.0% |
| Psychology | 14 | 3.2% |
| Social Sciences | 25 | 5.8% |
| Engineering | 0 | 0.0% |
| Multidisciplinary Studies | 0 | 0.0% |
| Science & Technology | 0 | 0.0% |
| Business | 146 | 33.8% |
| Education | 9 | 2.1% |
| Literature & Languages | 62 | 14.3% |
| Liberal Arts & History | 70 | 16.2% |
| Visual & Performing Arts | 0 | 0.0% |
| Communications | 0 | 0.0% |
| Arts & Humanities | 83 | 19.2% |
| Total | 432 | 100.0% |
Transportation & Commute in Muscoy
Vehicle Availability by Sex in Muscoy
The most prevalent vehicle ownership categories in Muscoy are males with 4 vehicles (868, accounting for 32.7%) and females with 4 vehicles (516, making up 51.1%).
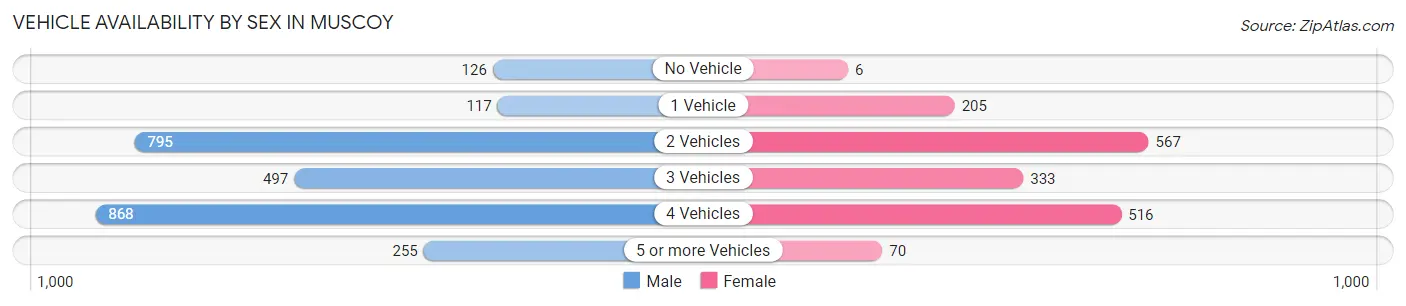
| Vehicles Available | Male | Female |
| No Vehicle | 126 (4.7%) | 6 (0.4%) |
| 1 Vehicle | 117 (4.4%) | 205 (12.1%) |
| 2 Vehicles | 795 (29.9%) | 567 (33.4%) |
| 3 Vehicles | 497 (18.7%) | 333 (19.6%) |
| 4 Vehicles | 868 (32.7%) | 516 (30.4%) |
| 5 or more Vehicles | 255 (9.6%) | 70 (4.1%) |
| Total | 2,658 (100.0%) | 1,697 (100.0%) |
Commute Time in Muscoy
The most frequently occuring commute durations in Muscoy are 20 to 24 minutes (1,107 commuters, 25.9%), 30 to 34 minutes (836 commuters, 19.5%), and 15 to 19 minutes (718 commuters, 16.8%).
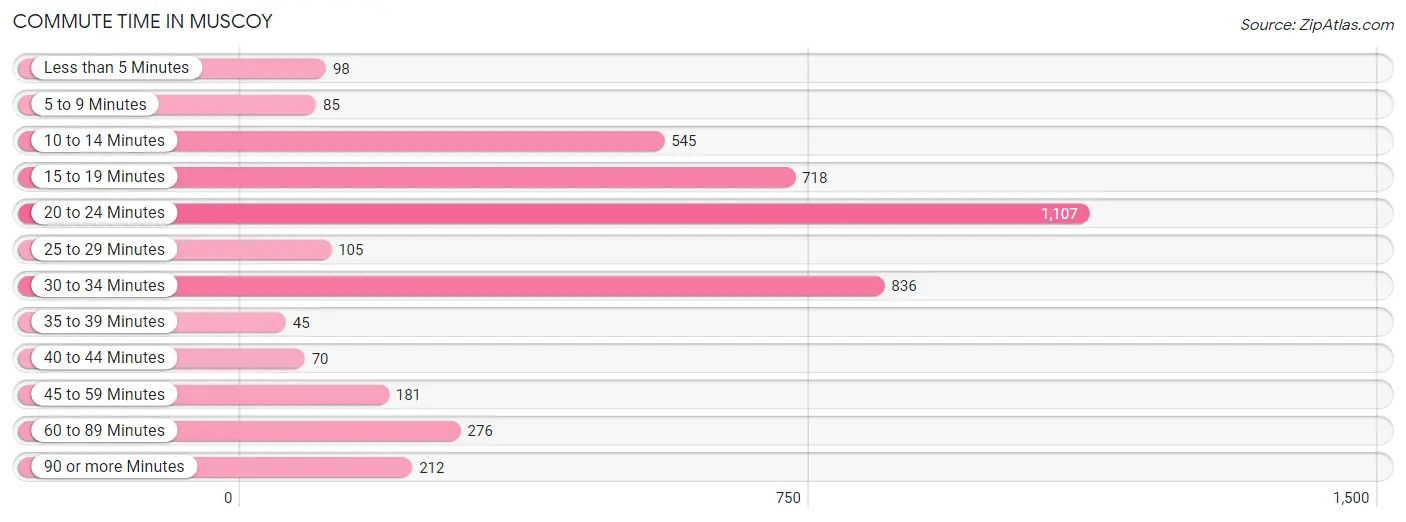
| Commute Time | # Commuters | % Commuters |
| Less than 5 Minutes | 98 | 2.3% |
| 5 to 9 Minutes | 85 | 2.0% |
| 10 to 14 Minutes | 545 | 12.7% |
| 15 to 19 Minutes | 718 | 16.8% |
| 20 to 24 Minutes | 1,107 | 25.9% |
| 25 to 29 Minutes | 105 | 2.5% |
| 30 to 34 Minutes | 836 | 19.5% |
| 35 to 39 Minutes | 45 | 1.1% |
| 40 to 44 Minutes | 70 | 1.6% |
| 45 to 59 Minutes | 181 | 4.2% |
| 60 to 89 Minutes | 276 | 6.5% |
| 90 or more Minutes | 212 | 5.0% |
Commute Time by Sex in Muscoy
The most common commute times in Muscoy are 20 to 24 minutes (710 commuters, 25.9%) for males and 20 to 24 minutes (397 commuters, 25.8%) for females.
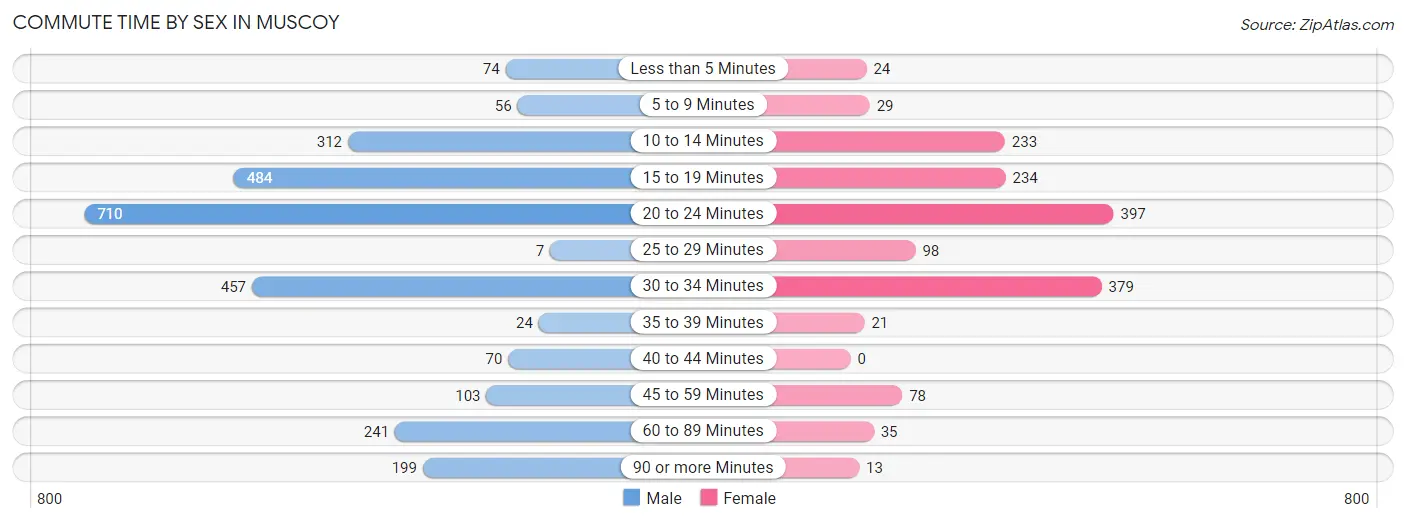
| Commute Time | Male | Female |
| Less than 5 Minutes | 74 (2.7%) | 24 (1.6%) |
| 5 to 9 Minutes | 56 (2.1%) | 29 (1.9%) |
| 10 to 14 Minutes | 312 (11.4%) | 233 (15.1%) |
| 15 to 19 Minutes | 484 (17.7%) | 234 (15.2%) |
| 20 to 24 Minutes | 710 (25.9%) | 397 (25.8%) |
| 25 to 29 Minutes | 7 (0.3%) | 98 (6.4%) |
| 30 to 34 Minutes | 457 (16.7%) | 379 (24.6%) |
| 35 to 39 Minutes | 24 (0.9%) | 21 (1.4%) |
| 40 to 44 Minutes | 70 (2.6%) | 0 (0.0%) |
| 45 to 59 Minutes | 103 (3.8%) | 78 (5.1%) |
| 60 to 89 Minutes | 241 (8.8%) | 35 (2.3%) |
| 90 or more Minutes | 199 (7.3%) | 13 (0.8%) |
Time of Departure to Work by Sex in Muscoy
The most frequent times of departure to work in Muscoy are 8:00 AM to 8:29 AM (541, 19.8%) for males and 7:30 AM to 7:59 AM (286, 18.6%) for females.
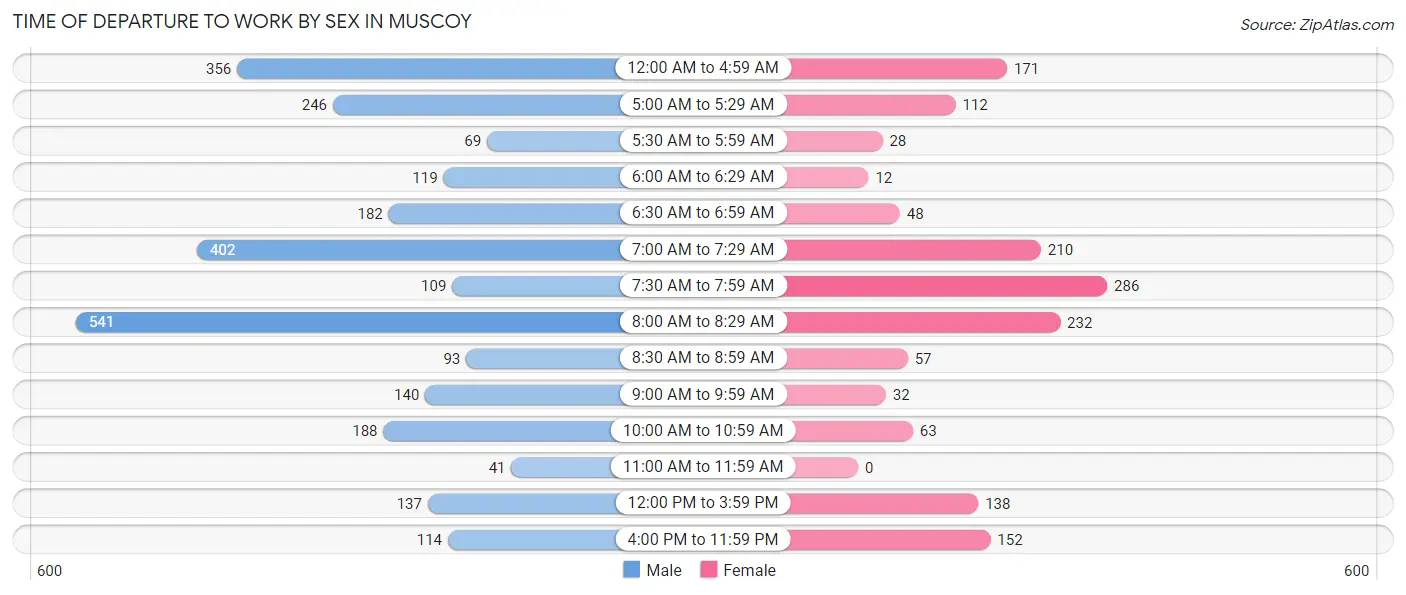
| Time of Departure | Male | Female |
| 12:00 AM to 4:59 AM | 356 (13.0%) | 171 (11.1%) |
| 5:00 AM to 5:29 AM | 246 (9.0%) | 112 (7.3%) |
| 5:30 AM to 5:59 AM | 69 (2.5%) | 28 (1.8%) |
| 6:00 AM to 6:29 AM | 119 (4.3%) | 12 (0.8%) |
| 6:30 AM to 6:59 AM | 182 (6.7%) | 48 (3.1%) |
| 7:00 AM to 7:29 AM | 402 (14.7%) | 210 (13.6%) |
| 7:30 AM to 7:59 AM | 109 (4.0%) | 286 (18.6%) |
| 8:00 AM to 8:29 AM | 541 (19.8%) | 232 (15.1%) |
| 8:30 AM to 8:59 AM | 93 (3.4%) | 57 (3.7%) |
| 9:00 AM to 9:59 AM | 140 (5.1%) | 32 (2.1%) |
| 10:00 AM to 10:59 AM | 188 (6.9%) | 63 (4.1%) |
| 11:00 AM to 11:59 AM | 41 (1.5%) | 0 (0.0%) |
| 12:00 PM to 3:59 PM | 137 (5.0%) | 138 (9.0%) |
| 4:00 PM to 11:59 PM | 114 (4.2%) | 152 (9.9%) |
| Total | 2,737 (100.0%) | 1,541 (100.0%) |
Housing Occupancy in Muscoy
Occupancy by Ownership in Muscoy
Of the total 2,528 dwellings in Muscoy, owner-occupied units account for 1,308 (51.7%), while renter-occupied units make up 1,220 (48.3%).
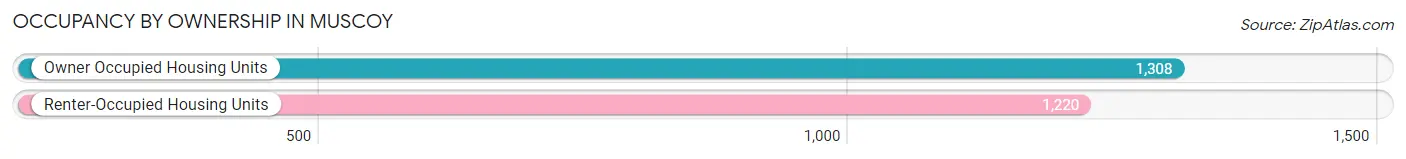
| Occupancy | # Housing Units | % Housing Units |
| Owner Occupied Housing Units | 1,308 | 51.7% |
| Renter-Occupied Housing Units | 1,220 | 48.3% |
| Total Occupied Housing Units | 2,528 | 100.0% |
Occupancy by Household Size in Muscoy
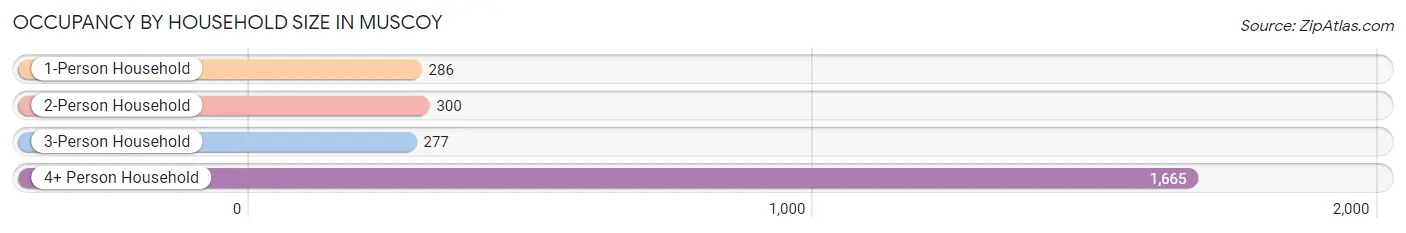
| Household Size | # Housing Units | % Housing Units |
| 1-Person Household | 286 | 11.3% |
| 2-Person Household | 300 | 11.9% |
| 3-Person Household | 277 | 11.0% |
| 4+ Person Household | 1,665 | 65.9% |
| Total Housing Units | 2,528 | 100.0% |
Occupancy by Ownership by Household Size in Muscoy
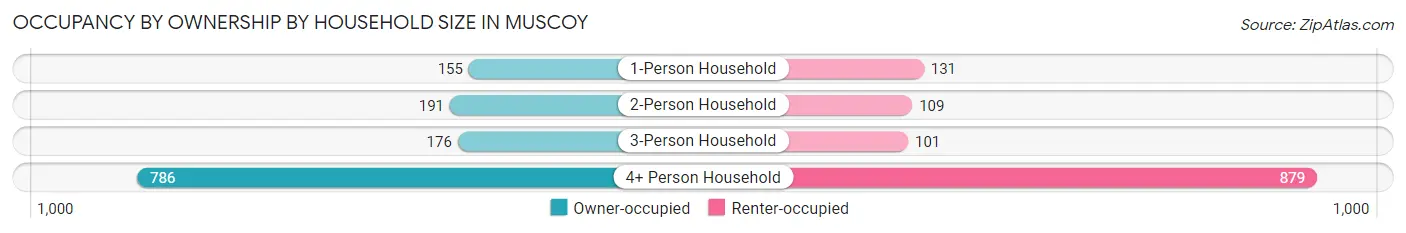
| Household Size | Owner-occupied | Renter-occupied |
| 1-Person Household | 155 (54.2%) | 131 (45.8%) |
| 2-Person Household | 191 (63.7%) | 109 (36.3%) |
| 3-Person Household | 176 (63.5%) | 101 (36.5%) |
| 4+ Person Household | 786 (47.2%) | 879 (52.8%) |
| Total Housing Units | 1,308 (51.7%) | 1,220 (48.3%) |
Occupancy by Educational Attainment in Muscoy
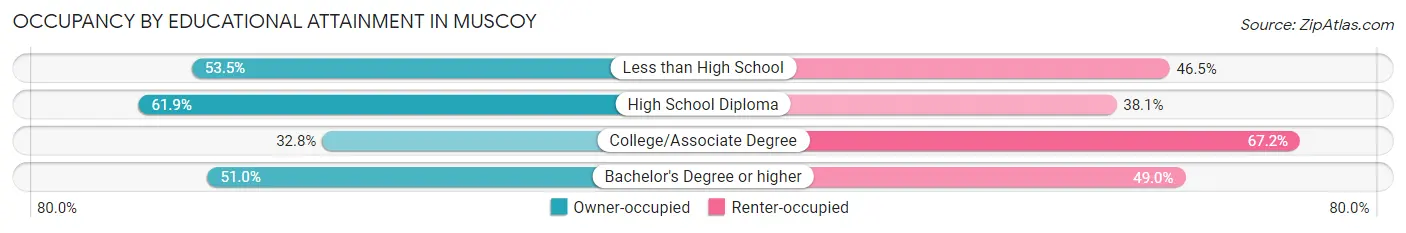
| Household Size | Owner-occupied | Renter-occupied |
| Less than High School | 641 (53.5%) | 558 (46.5%) |
| High School Diploma | 452 (61.9%) | 278 (38.1%) |
| College/Associate Degree | 163 (32.8%) | 334 (67.2%) |
| Bachelor's Degree or higher | 52 (51.0%) | 50 (49.0%) |
Occupancy by Age of Householder in Muscoy
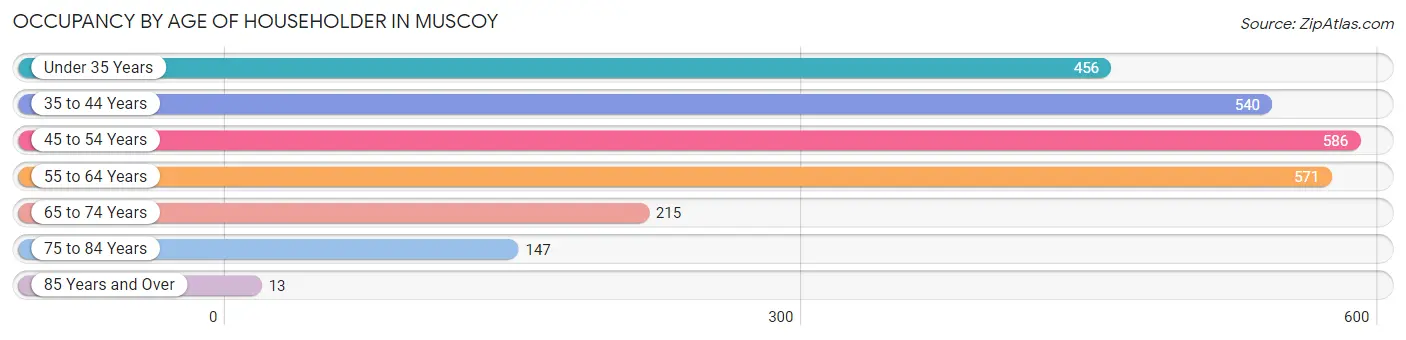
| Age Bracket | # Households | % Households |
| Under 35 Years | 456 | 18.0% |
| 35 to 44 Years | 540 | 21.4% |
| 45 to 54 Years | 586 | 23.2% |
| 55 to 64 Years | 571 | 22.6% |
| 65 to 74 Years | 215 | 8.5% |
| 75 to 84 Years | 147 | 5.8% |
| 85 Years and Over | 13 | 0.5% |
| Total | 2,528 | 100.0% |
Housing Finances in Muscoy
Median Income by Occupancy in Muscoy
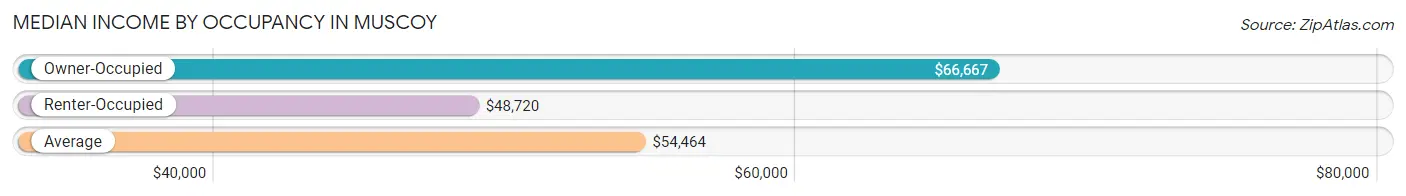
| Occupancy Type | # Households | Median Income |
| Owner-Occupied | 1,308 (51.7%) | $66,667 |
| Renter-Occupied | 1,220 (48.3%) | $48,720 |
| Average | 2,528 (100.0%) | $54,464 |
Occupancy by Householder Income Bracket in Muscoy
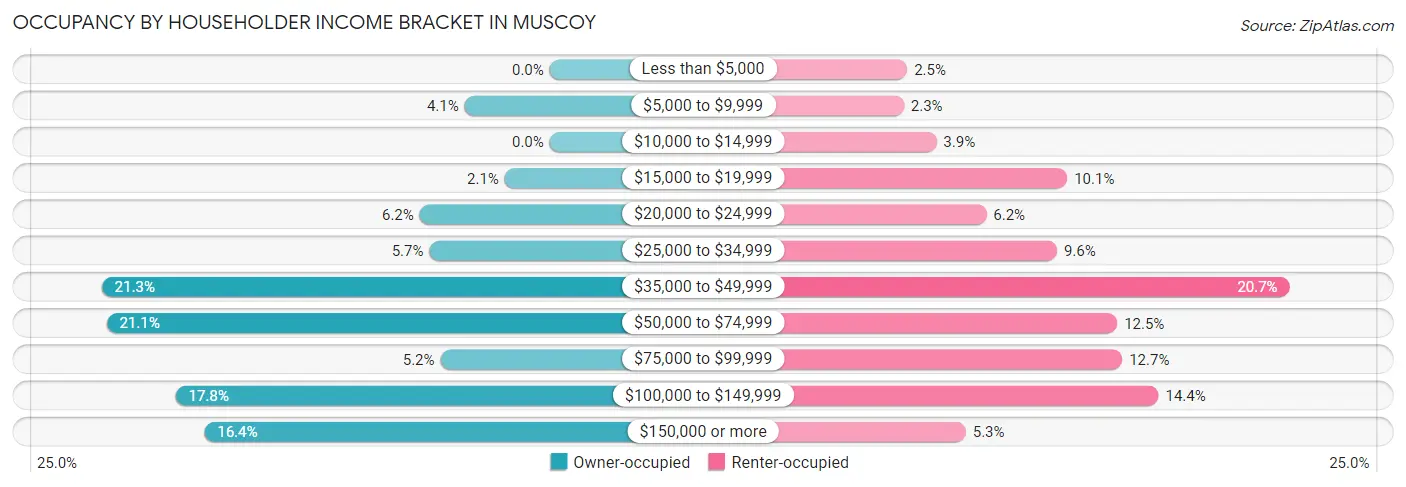
| Income Bracket | Owner-occupied | Renter-occupied |
| Less than $5,000 | 0 (0.0%) | 30 (2.5%) |
| $5,000 to $9,999 | 53 (4.1%) | 28 (2.3%) |
| $10,000 to $14,999 | 0 (0.0%) | 47 (3.8%) |
| $15,000 to $19,999 | 28 (2.1%) | 123 (10.1%) |
| $20,000 to $24,999 | 81 (6.2%) | 76 (6.2%) |
| $25,000 to $34,999 | 75 (5.7%) | 117 (9.6%) |
| $35,000 to $49,999 | 279 (21.3%) | 252 (20.7%) |
| $50,000 to $74,999 | 276 (21.1%) | 152 (12.5%) |
| $75,000 to $99,999 | 68 (5.2%) | 155 (12.7%) |
| $100,000 to $149,999 | 233 (17.8%) | 176 (14.4%) |
| $150,000 or more | 215 (16.4%) | 64 (5.2%) |
| Total | 1,308 (100.0%) | 1,220 (100.0%) |
Monthly Housing Cost Tiers in Muscoy
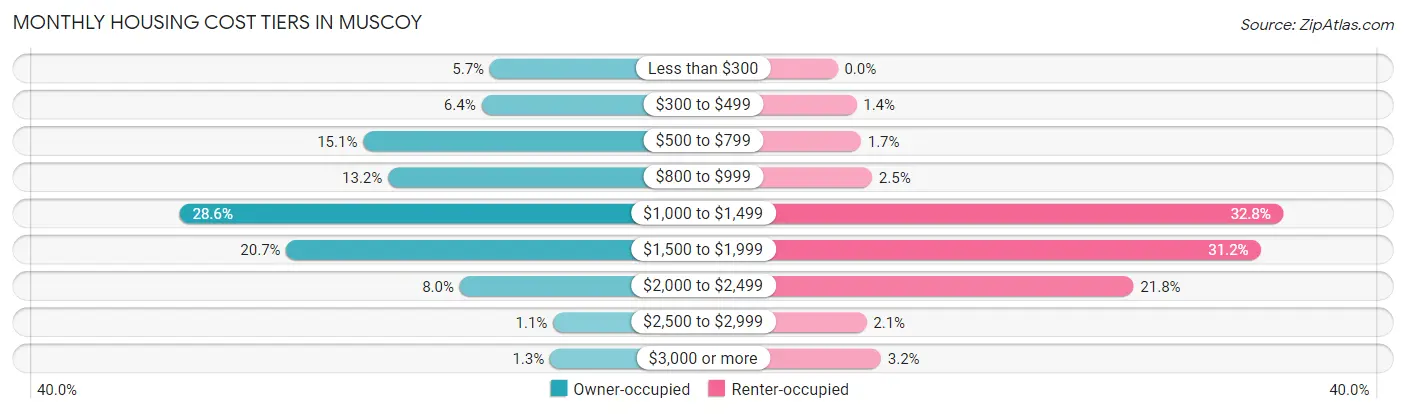
| Monthly Cost | Owner-occupied | Renter-occupied |
| Less than $300 | 75 (5.7%) | 0 (0.0%) |
| $300 to $499 | 83 (6.4%) | 17 (1.4%) |
| $500 to $799 | 197 (15.1%) | 21 (1.7%) |
| $800 to $999 | 173 (13.2%) | 31 (2.5%) |
| $1,000 to $1,499 | 374 (28.6%) | 400 (32.8%) |
| $1,500 to $1,999 | 271 (20.7%) | 380 (31.1%) |
| $2,000 to $2,499 | 104 (8.0%) | 266 (21.8%) |
| $2,500 to $2,999 | 14 (1.1%) | 26 (2.1%) |
| $3,000 or more | 17 (1.3%) | 39 (3.2%) |
| Total | 1,308 (100.0%) | 1,220 (100.0%) |
Physical Housing Characteristics in Muscoy
Housing Structures in Muscoy
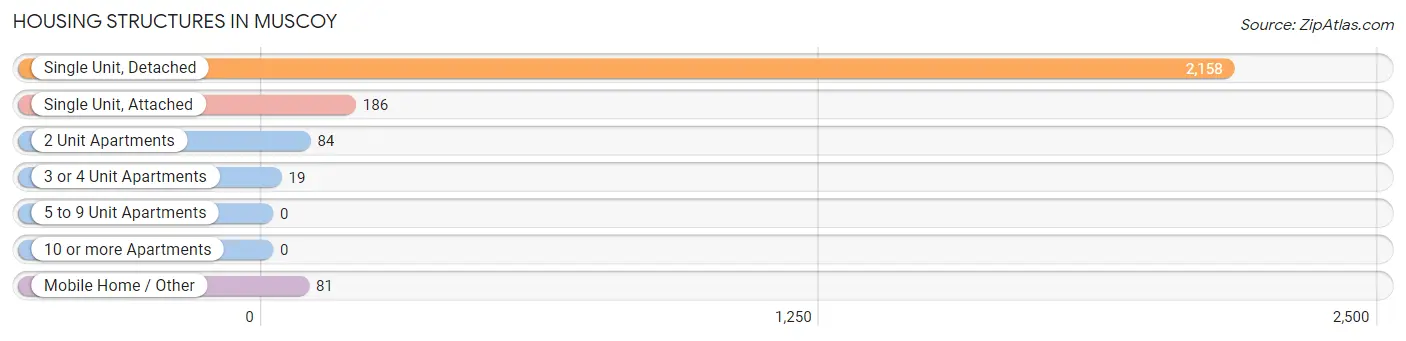
| Structure Type | # Housing Units | % Housing Units |
| Single Unit, Detached | 2,158 | 85.4% |
| Single Unit, Attached | 186 | 7.4% |
| 2 Unit Apartments | 84 | 3.3% |
| 3 or 4 Unit Apartments | 19 | 0.7% |
| 5 to 9 Unit Apartments | 0 | 0.0% |
| 10 or more Apartments | 0 | 0.0% |
| Mobile Home / Other | 81 | 3.2% |
| Total | 2,528 | 100.0% |
Housing Structures by Occupancy in Muscoy
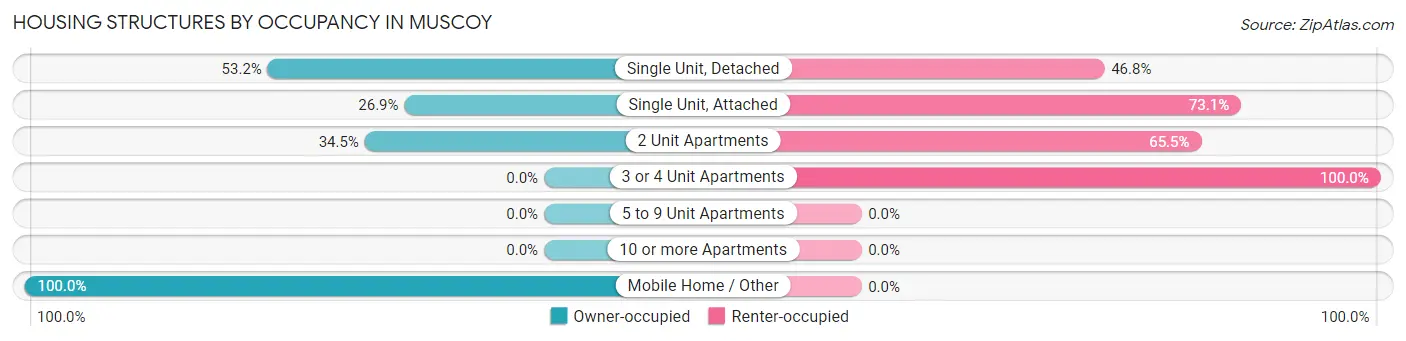
| Structure Type | Owner-occupied | Renter-occupied |
| Single Unit, Detached | 1,148 (53.2%) | 1,010 (46.8%) |
| Single Unit, Attached | 50 (26.9%) | 136 (73.1%) |
| 2 Unit Apartments | 29 (34.5%) | 55 (65.5%) |
| 3 or 4 Unit Apartments | 0 (0.0%) | 19 (100.0%) |
| 5 to 9 Unit Apartments | 0 (0.0%) | 0 (0.0%) |
| 10 or more Apartments | 0 (0.0%) | 0 (0.0%) |
| Mobile Home / Other | 81 (100.0%) | 0 (0.0%) |
| Total | 1,308 (51.7%) | 1,220 (48.3%) |
Housing Structures by Number of Rooms in Muscoy
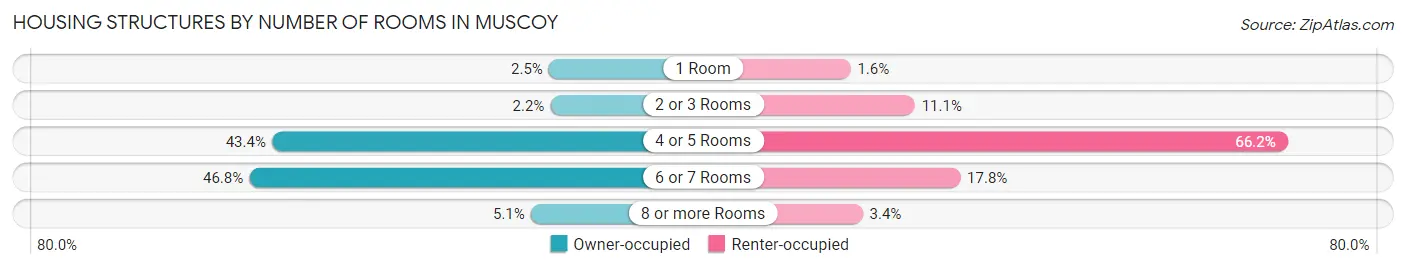
| Number of Rooms | Owner-occupied | Renter-occupied |
| 1 Room | 32 (2.5%) | 19 (1.6%) |
| 2 or 3 Rooms | 29 (2.2%) | 135 (11.1%) |
| 4 or 5 Rooms | 568 (43.4%) | 808 (66.2%) |
| 6 or 7 Rooms | 612 (46.8%) | 217 (17.8%) |
| 8 or more Rooms | 67 (5.1%) | 41 (3.4%) |
| Total | 1,308 (100.0%) | 1,220 (100.0%) |
Housing Structure by Heating Type in Muscoy
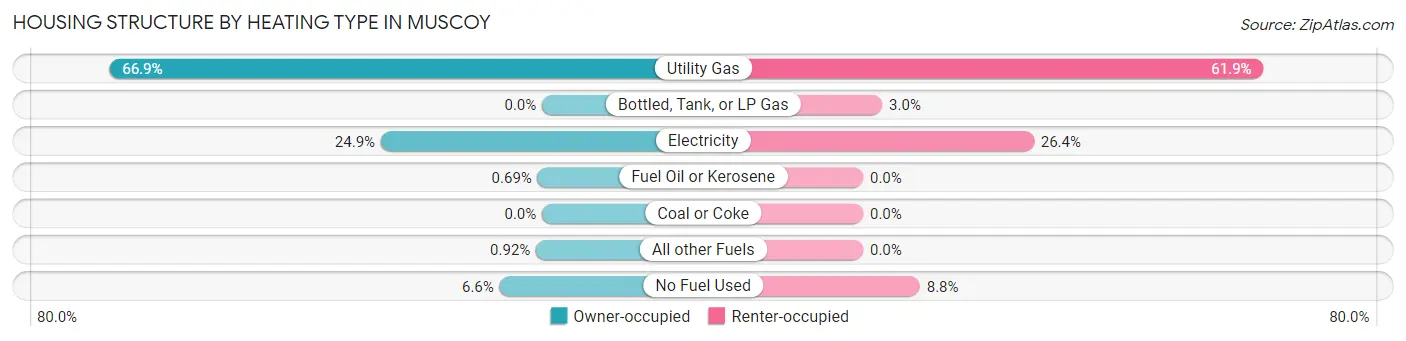
| Heating Type | Owner-occupied | Renter-occupied |
| Utility Gas | 875 (66.9%) | 755 (61.9%) |
| Bottled, Tank, or LP Gas | 0 (0.0%) | 36 (2.9%) |
| Electricity | 326 (24.9%) | 322 (26.4%) |
| Fuel Oil or Kerosene | 9 (0.7%) | 0 (0.0%) |
| Coal or Coke | 0 (0.0%) | 0 (0.0%) |
| All other Fuels | 12 (0.9%) | 0 (0.0%) |
| No Fuel Used | 86 (6.6%) | 107 (8.8%) |
| Total | 1,308 (100.0%) | 1,220 (100.0%) |
Household Vehicle Usage in Muscoy
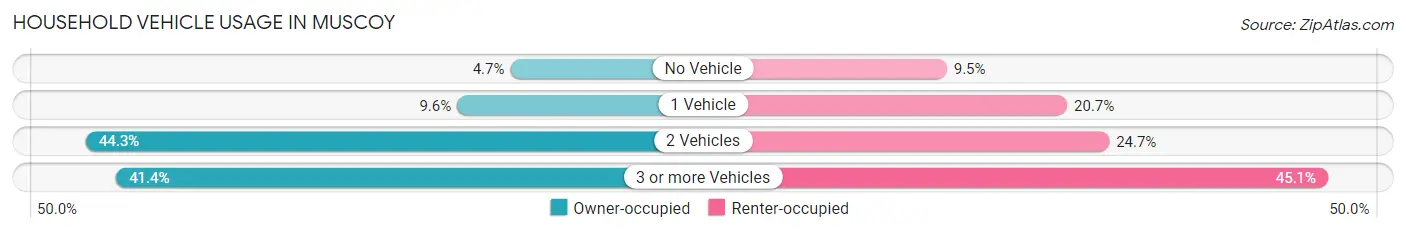
| Vehicles per Household | Owner-occupied | Renter-occupied |
| No Vehicle | 61 (4.7%) | 116 (9.5%) |
| 1 Vehicle | 126 (9.6%) | 253 (20.7%) |
| 2 Vehicles | 579 (44.3%) | 301 (24.7%) |
| 3 or more Vehicles | 542 (41.4%) | 550 (45.1%) |
| Total | 1,308 (100.0%) | 1,220 (100.0%) |
Real Estate & Mortgages in Muscoy
Real Estate and Mortgage Overview in Muscoy
| Characteristic | Without Mortgage | With Mortgage |
| Housing Units | 359 | 949 |
| Median Property Value | $347,500 | $339,300 |
| Median Household Income | $42,277 | $191 |
| Monthly Housing Costs | $520 | $17 |
| Real Estate Taxes | $1,458 | $0 |
Property Value by Mortgage Status in Muscoy
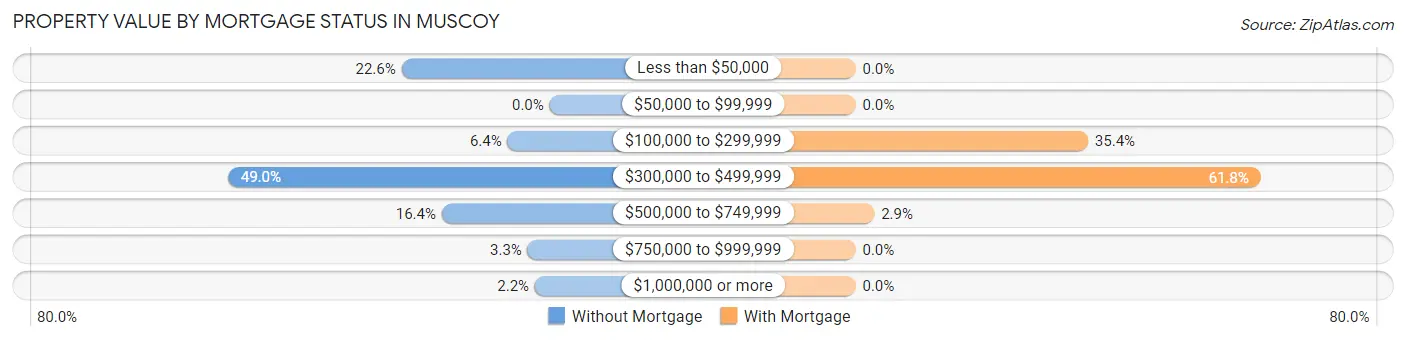
| Property Value | Without Mortgage | With Mortgage |
| Less than $50,000 | 81 (22.6%) | 0 (0.0%) |
| $50,000 to $99,999 | 0 (0.0%) | 0 (0.0%) |
| $100,000 to $299,999 | 23 (6.4%) | 336 (35.4%) |
| $300,000 to $499,999 | 176 (49.0%) | 586 (61.8%) |
| $500,000 to $749,999 | 59 (16.4%) | 27 (2.9%) |
| $750,000 to $999,999 | 12 (3.3%) | 0 (0.0%) |
| $1,000,000 or more | 8 (2.2%) | 0 (0.0%) |
| Total | 359 (100.0%) | 949 (100.0%) |
Household Income by Mortgage Status in Muscoy
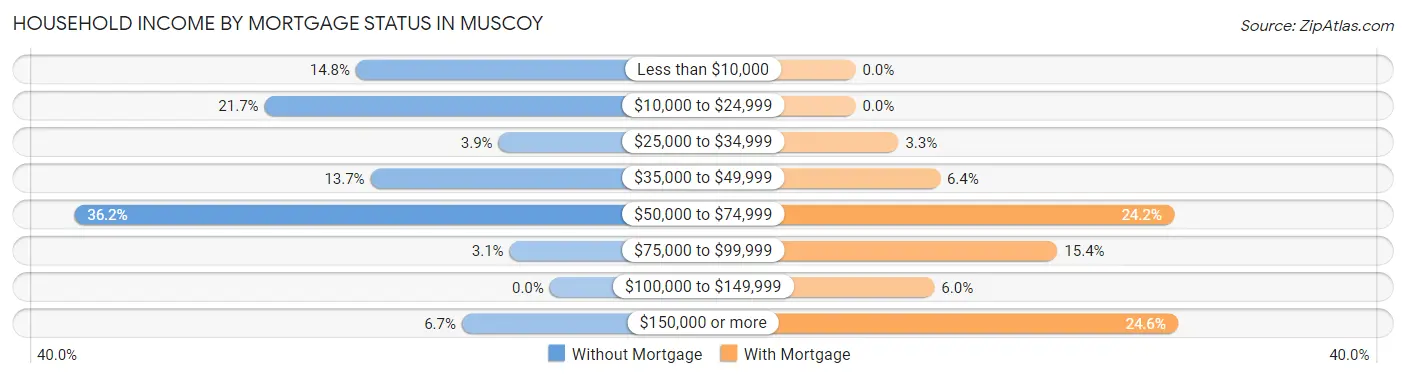
| Household Income | Without Mortgage | With Mortgage |
| Less than $10,000 | 53 (14.8%) | 0 (0.0%) |
| $10,000 to $24,999 | 78 (21.7%) | 0 (0.0%) |
| $25,000 to $34,999 | 14 (3.9%) | 31 (3.3%) |
| $35,000 to $49,999 | 49 (13.7%) | 61 (6.4%) |
| $50,000 to $74,999 | 130 (36.2%) | 230 (24.2%) |
| $75,000 to $99,999 | 11 (3.1%) | 146 (15.4%) |
| $100,000 to $149,999 | 0 (0.0%) | 57 (6.0%) |
| $150,000 or more | 24 (6.7%) | 233 (24.5%) |
| Total | 359 (100.0%) | 949 (100.0%) |
Property Value to Household Income Ratio in Muscoy
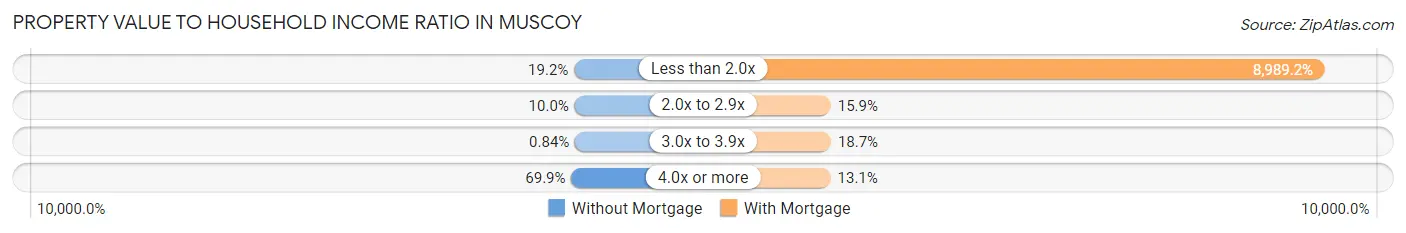
| Value-to-Income Ratio | Without Mortgage | With Mortgage |
| Less than 2.0x | 69 (19.2%) | 85,307 (8,989.1%) |
| 2.0x to 2.9x | 36 (10.0%) | 151 (15.9%) |
| 3.0x to 3.9x | 3 (0.8%) | 177 (18.6%) |
| 4.0x or more | 251 (69.9%) | 124 (13.1%) |
| Total | 359 (100.0%) | 949 (100.0%) |
Real Estate Taxes by Mortgage Status in Muscoy
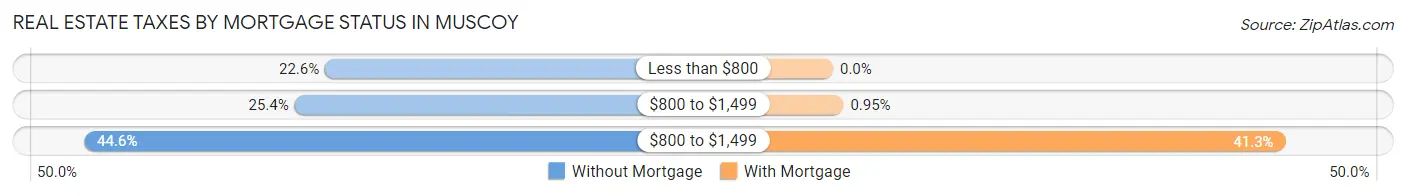
| Property Taxes | Without Mortgage | With Mortgage |
| Less than $800 | 81 (22.6%) | 0 (0.0%) |
| $800 to $1,499 | 91 (25.4%) | 9 (0.9%) |
| $800 to $1,499 | 160 (44.6%) | 392 (41.3%) |
| Total | 359 (100.0%) | 949 (100.0%) |
Health & Disability in Muscoy
Health Insurance Coverage by Age in Muscoy
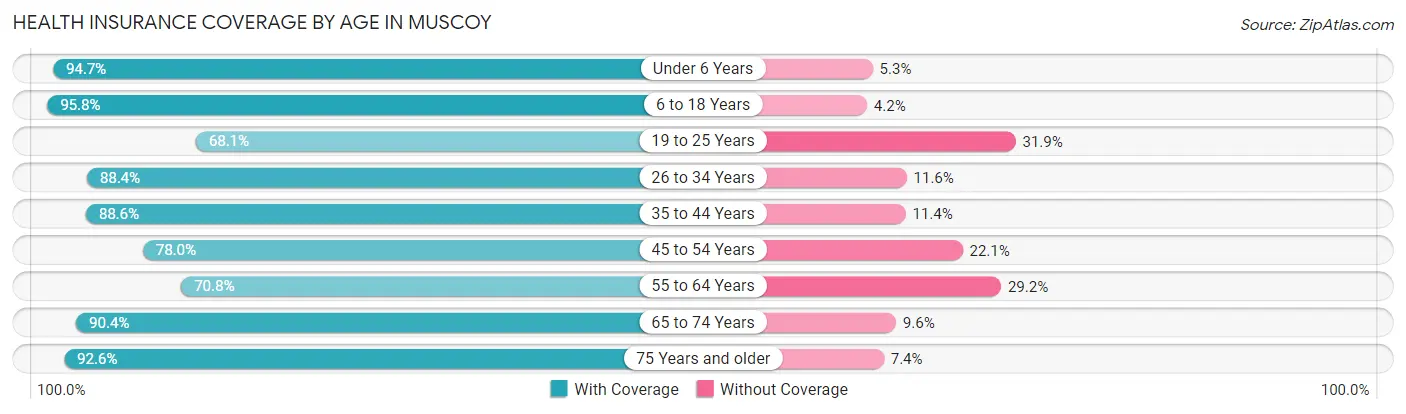
| Age Bracket | With Coverage | Without Coverage |
| Under 6 Years | 1,129 (94.7%) | 63 (5.3%) |
| 6 to 18 Years | 2,363 (95.8%) | 104 (4.2%) |
| 19 to 25 Years | 1,008 (68.1%) | 473 (31.9%) |
| 26 to 34 Years | 1,392 (88.4%) | 183 (11.6%) |
| 35 to 44 Years | 1,327 (88.6%) | 171 (11.4%) |
| 45 to 54 Years | 1,135 (77.9%) | 321 (22.1%) |
| 55 to 64 Years | 705 (70.8%) | 291 (29.2%) |
| 65 to 74 Years | 714 (90.4%) | 76 (9.6%) |
| 75 Years and older | 302 (92.6%) | 24 (7.4%) |
| Total | 10,075 (85.5%) | 1,706 (14.5%) |
Health Insurance Coverage by Citizenship Status in Muscoy
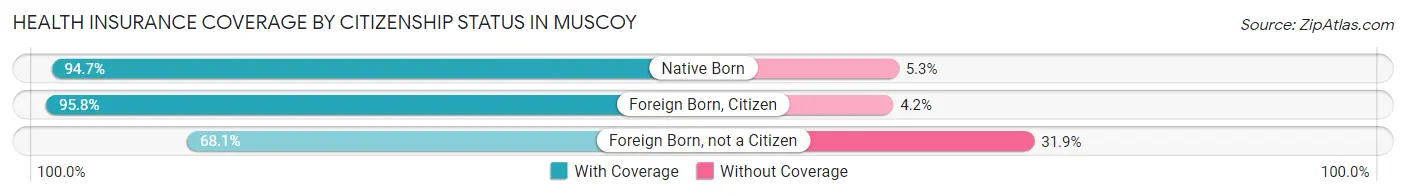
| Citizenship Status | With Coverage | Without Coverage |
| Native Born | 1,129 (94.7%) | 63 (5.3%) |
| Foreign Born, Citizen | 2,363 (95.8%) | 104 (4.2%) |
| Foreign Born, not a Citizen | 1,008 (68.1%) | 473 (31.9%) |
Health Insurance Coverage by Household Income in Muscoy
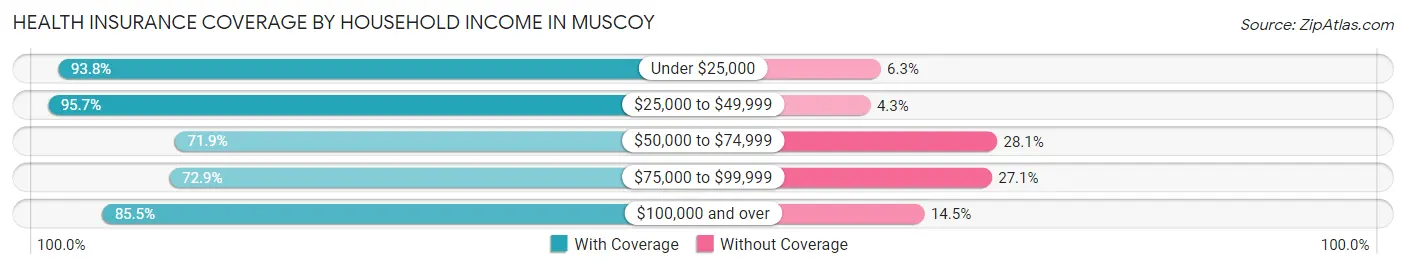
| Household Income | With Coverage | Without Coverage |
| Under $25,000 | 1,231 (93.8%) | 82 (6.2%) |
| $25,000 to $49,999 | 2,626 (95.7%) | 119 (4.3%) |
| $50,000 to $74,999 | 1,254 (71.9%) | 489 (28.1%) |
| $75,000 to $99,999 | 943 (72.9%) | 350 (27.1%) |
| $100,000 and over | 3,632 (85.5%) | 614 (14.5%) |
Public vs Private Health Insurance Coverage by Age in Muscoy
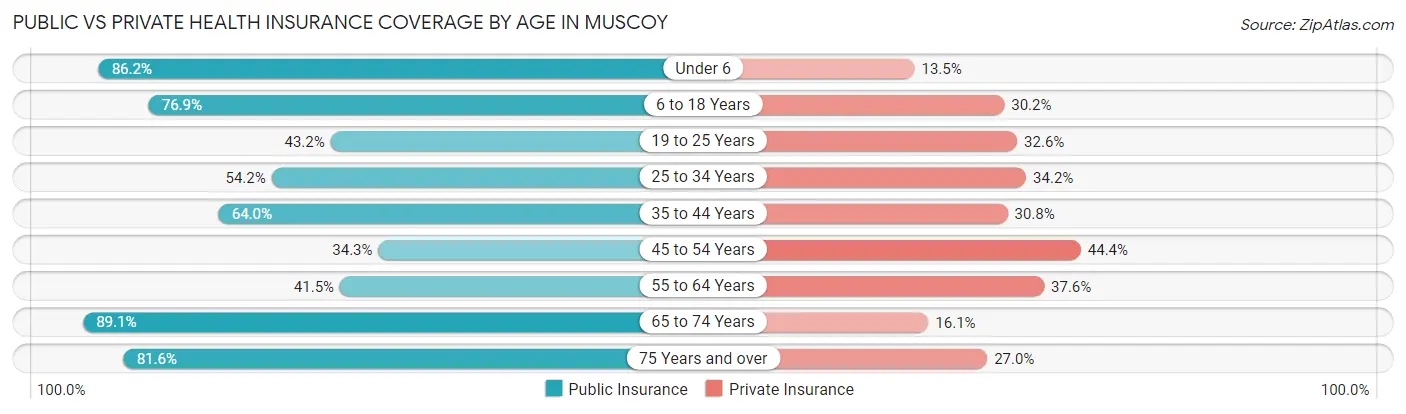
| Age Bracket | Public Insurance | Private Insurance |
| Under 6 | 1,028 (86.2%) | 161 (13.5%) |
| 6 to 18 Years | 1,898 (76.9%) | 744 (30.2%) |
| 19 to 25 Years | 640 (43.2%) | 482 (32.6%) |
| 25 to 34 Years | 853 (54.2%) | 539 (34.2%) |
| 35 to 44 Years | 958 (63.9%) | 461 (30.8%) |
| 45 to 54 Years | 500 (34.3%) | 646 (44.4%) |
| 55 to 64 Years | 413 (41.5%) | 374 (37.6%) |
| 65 to 74 Years | 704 (89.1%) | 127 (16.1%) |
| 75 Years and over | 266 (81.6%) | 88 (27.0%) |
| Total | 7,260 (61.6%) | 3,622 (30.7%) |
Disability Status by Sex by Age in Muscoy
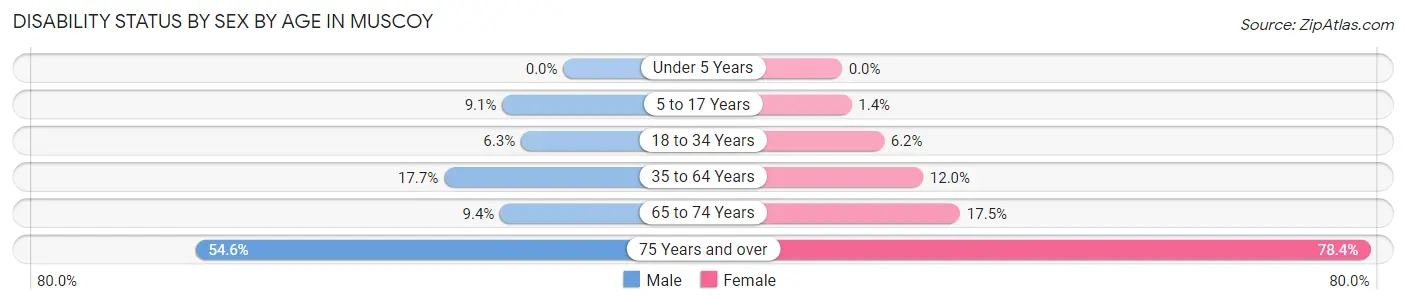
| Age Bracket | Male | Female |
| Under 5 Years | 0 (0.0%) | 0 (0.0%) |
| 5 to 17 Years | 126 (9.1%) | 17 (1.4%) |
| 18 to 34 Years | 104 (6.3%) | 99 (6.2%) |
| 35 to 64 Years | 404 (17.7%) | 201 (12.0%) |
| 65 to 74 Years | 42 (9.4%) | 60 (17.5%) |
| 75 Years and over | 59 (54.6%) | 171 (78.4%) |
Disability Class by Sex by Age in Muscoy
Disability Class: Hearing Difficulty
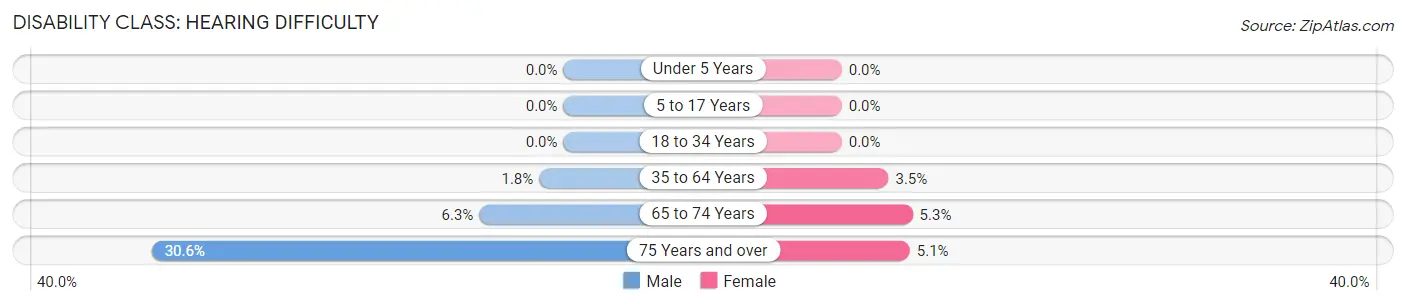
| Age Bracket | Male | Female |
| Under 5 Years | 0 (0.0%) | 0 (0.0%) |
| 5 to 17 Years | 0 (0.0%) | 0 (0.0%) |
| 18 to 34 Years | 0 (0.0%) | 0 (0.0%) |
| 35 to 64 Years | 41 (1.8%) | 58 (3.5%) |
| 65 to 74 Years | 28 (6.2%) | 18 (5.3%) |
| 75 Years and over | 33 (30.6%) | 11 (5.1%) |
Disability Class: Vision Difficulty
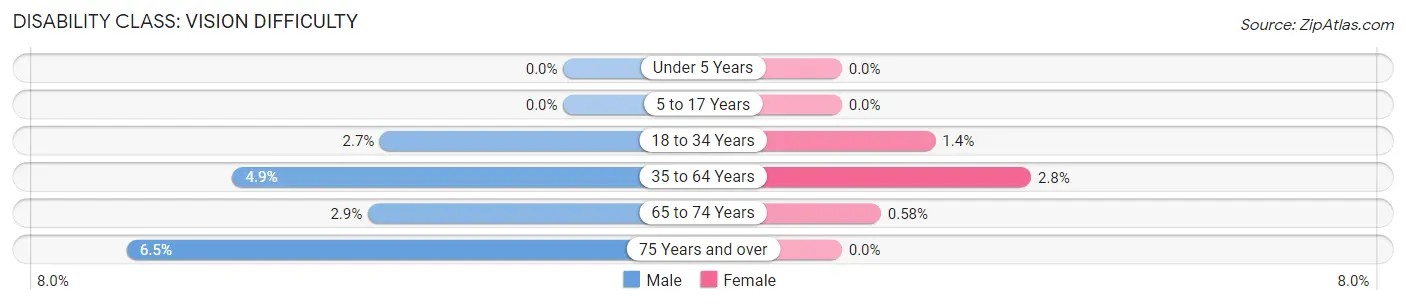
| Age Bracket | Male | Female |
| Under 5 Years | 0 (0.0%) | 0 (0.0%) |
| 5 to 17 Years | 0 (0.0%) | 0 (0.0%) |
| 18 to 34 Years | 45 (2.7%) | 22 (1.4%) |
| 35 to 64 Years | 112 (4.9%) | 47 (2.8%) |
| 65 to 74 Years | 13 (2.9%) | 2 (0.6%) |
| 75 Years and over | 7 (6.5%) | 0 (0.0%) |
Disability Class: Cognitive Difficulty
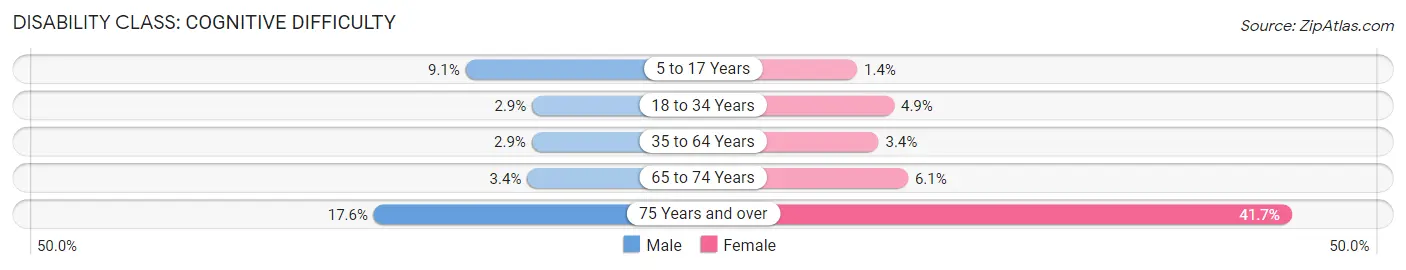
| Age Bracket | Male | Female |
| 5 to 17 Years | 126 (9.1%) | 17 (1.4%) |
| 18 to 34 Years | 48 (2.9%) | 77 (4.9%) |
| 35 to 64 Years | 67 (2.9%) | 57 (3.4%) |
| 65 to 74 Years | 15 (3.4%) | 21 (6.1%) |
| 75 Years and over | 19 (17.6%) | 91 (41.7%) |
Disability Class: Ambulatory Difficulty
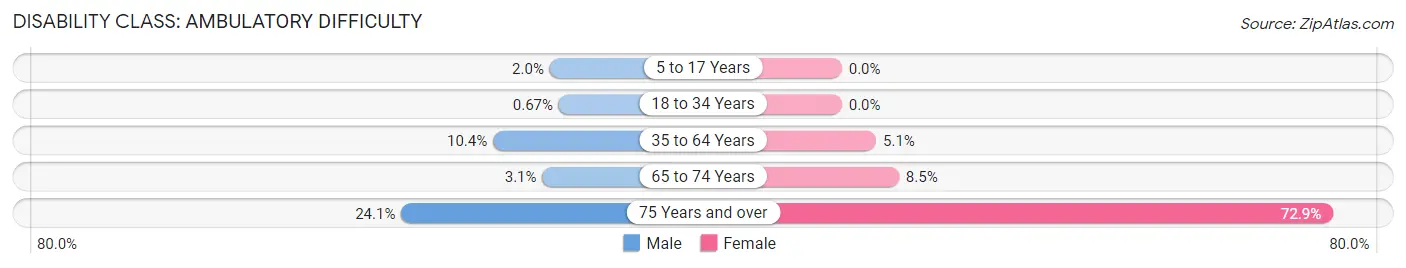
| Age Bracket | Male | Female |
| 5 to 17 Years | 28 (2.0%) | 0 (0.0%) |
| 18 to 34 Years | 11 (0.7%) | 0 (0.0%) |
| 35 to 64 Years | 238 (10.4%) | 85 (5.1%) |
| 65 to 74 Years | 14 (3.1%) | 29 (8.5%) |
| 75 Years and over | 26 (24.1%) | 159 (72.9%) |
Disability Class: Self-Care Difficulty
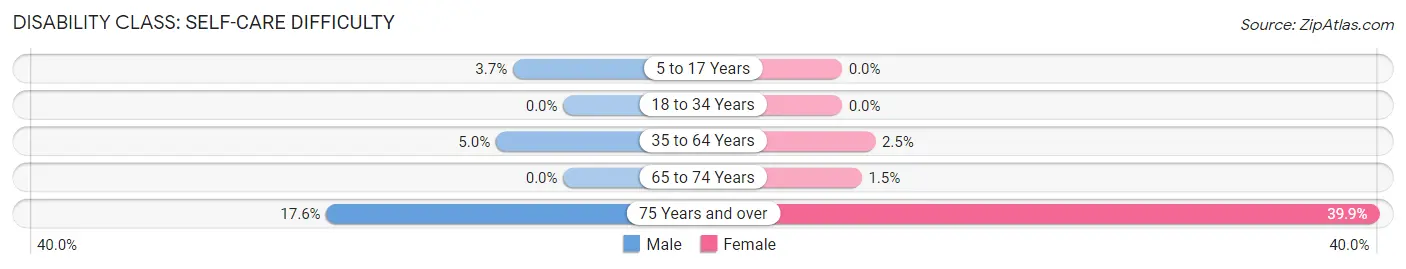
| Age Bracket | Male | Female |
| 5 to 17 Years | 52 (3.7%) | 0 (0.0%) |
| 18 to 34 Years | 0 (0.0%) | 0 (0.0%) |
| 35 to 64 Years | 114 (5.0%) | 41 (2.5%) |
| 65 to 74 Years | 0 (0.0%) | 5 (1.5%) |
| 75 Years and over | 19 (17.6%) | 87 (39.9%) |
Technology Access in Muscoy
Computing Device Access in Muscoy
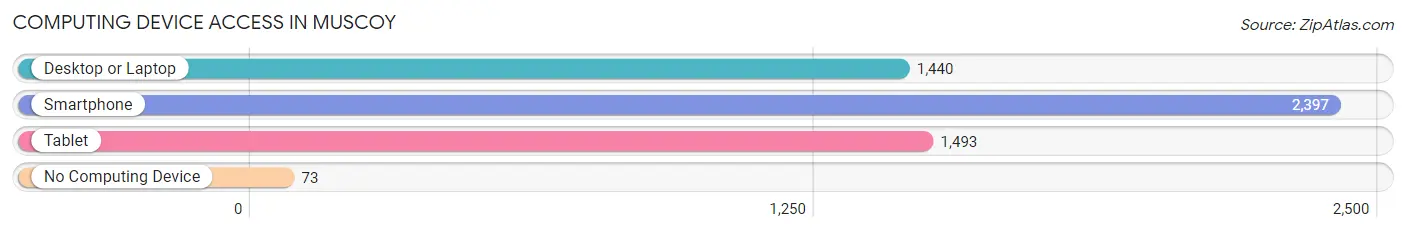
| Device Type | # Households | % Households |
| Desktop or Laptop | 1,440 | 57.0% |
| Smartphone | 2,397 | 94.8% |
| Tablet | 1,493 | 59.1% |
| No Computing Device | 73 | 2.9% |
| Total | 2,528 | 100.0% |
Internet Access in Muscoy
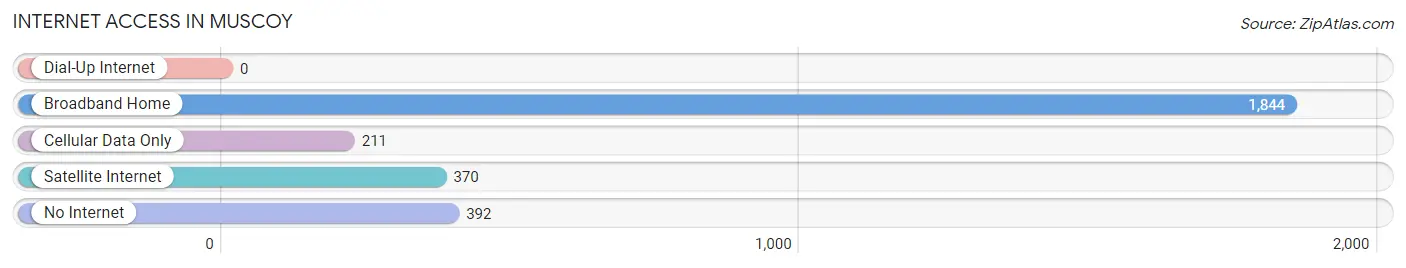
| Internet Type | # Households | % Households |
| Dial-Up Internet | 0 | 0.0% |
| Broadband Home | 1,844 | 72.9% |
| Cellular Data Only | 211 | 8.4% |
| Satellite Internet | 370 | 14.6% |
| No Internet | 392 | 15.5% |
| Total | 2,528 | 100.0% |
Muscoy Summary
Muscoy is a small unincorporated community located in San Bernardino County, California. It is situated in the San Bernardino Valley, approximately 10 miles west of downtown San Bernardino. The population of Muscoy was estimated to be 8,919 in 2019.
History
Muscoy was originally inhabited by the Serrano Indians, who were the original inhabitants of the San Bernardino Valley. The Serrano Indians were a peaceful tribe who lived in the area for thousands of years before the arrival of the Spanish in the late 1700s. The Spanish established a mission in the area in 1810, and the area was later settled by Mexican ranchers.
In the late 1800s, the area was purchased by the Muscoy Land and Water Company, which developed the area into a farming community. The company built a railroad line to connect the community to San Bernardino, and the area became known as Muscoy.
Geography
Muscoy is located in the San Bernardino Valley, approximately 10 miles west of downtown San Bernardino. The area is bordered by the Santa Ana River to the north, the San Bernardino Mountains to the east, and the San Gabriel Mountains to the west. The area is mostly flat, with an elevation of 1,000 feet.
The climate in Muscoy is semi-arid, with hot summers and mild winters. The average annual temperature is 68°F, and the average annual precipitation is 8.5 inches.
Economy
The economy of Muscoy is largely based on agriculture. The area is home to several farms, which produce a variety of crops, including citrus, avocados, and tomatoes. The area is also home to several nurseries, which produce a variety of plants and flowers.
In addition to agriculture, Muscoy is home to several small businesses, including restaurants, auto repair shops, and convenience stores. The area is also home to several manufacturing companies, which produce a variety of products, including furniture, clothing, and electronics.
Demographics
As of 2019, the population of Muscoy was estimated to be 8,919. The population is largely Hispanic, with approximately 75% of the population identifying as Hispanic or Latino. The median household income in Muscoy is $45,000, and the median home value is $250,000.
The majority of the population is employed in the agricultural industry, with approximately 25% of the population employed in the manufacturing industry. The unemployment rate in Muscoy is 6.2%, which is slightly higher than the national average of 5.2%.
Conclusion
Muscoy is a small unincorporated community located in San Bernardino County, California. It is situated in the San Bernardino Valley, approximately 10 miles west of downtown San Bernardino. The population of Muscoy was estimated to be 8,919 in 2019. The economy of Muscoy is largely based on agriculture, and the population is largely Hispanic. The median household income in Muscoy is $45,000, and the median home value is $250,000. The unemployment rate in Muscoy is 6.2%, which is slightly higher than the national average of 5.2%.
Common Questions
What is Per Capita Income in Muscoy?
Per Capita income in Muscoy is $19,130.
What is the Median Family Income in Muscoy?
Median Family Income in Muscoy is $51,280.
What is the Median Household income in Muscoy?
Median Household Income in Muscoy is $54,464.
What is Income or Wage Gap in Muscoy?
Income or Wage Gap in Muscoy is 28.8%.
Women in Muscoy earn 71.2 cents for every dollar earned by a man.
What is Family Income Deficit in Muscoy?
Family Income Deficit in Muscoy is $12,815.
Families that are below poverty line in Muscoy earn $12,815 less on average than the poverty threshold level.
What is Inequality or Gini Index in Muscoy?
Inequality or Gini Index in Muscoy is 0.45.
What is the Total Population of Muscoy?
Total Population of Muscoy is 11,802.
What is the Total Male Population of Muscoy?
Total Male Population of Muscoy is 6,388.
What is the Total Female Population of Muscoy?
Total Female Population of Muscoy is 5,414.
What is the Ratio of Males per 100 Females in Muscoy?
There are 117.99 Males per 100 Females in Muscoy.
What is the Ratio of Females per 100 Males in Muscoy?
There are 84.75 Females per 100 Males in Muscoy.
What is the Median Population Age in Muscoy?
Median Population Age in Muscoy is 29.7 Years.
What is the Average Family Size in Muscoy
Average Family Size in Muscoy is 4.6 People.
What is the Average Household Size in Muscoy
Average Household Size in Muscoy is 4.5 People.
How Large is the Labor Force in Muscoy?
There are 5,010 People in the Labor Forcein in Muscoy.
What is the Percentage of People in the Labor Force in Muscoy?
57.8% of People are in the Labor Force in Muscoy.
What is the Unemployment Rate in Muscoy?
Unemployment Rate in Muscoy is 8.4%.