Cities with the Fewest Births per 1,000 Women Over the Age of 35 in California
RELATED REPORTS & OPTIONS
Lowest Birth Rate | Women 35+
California
Compare Cities
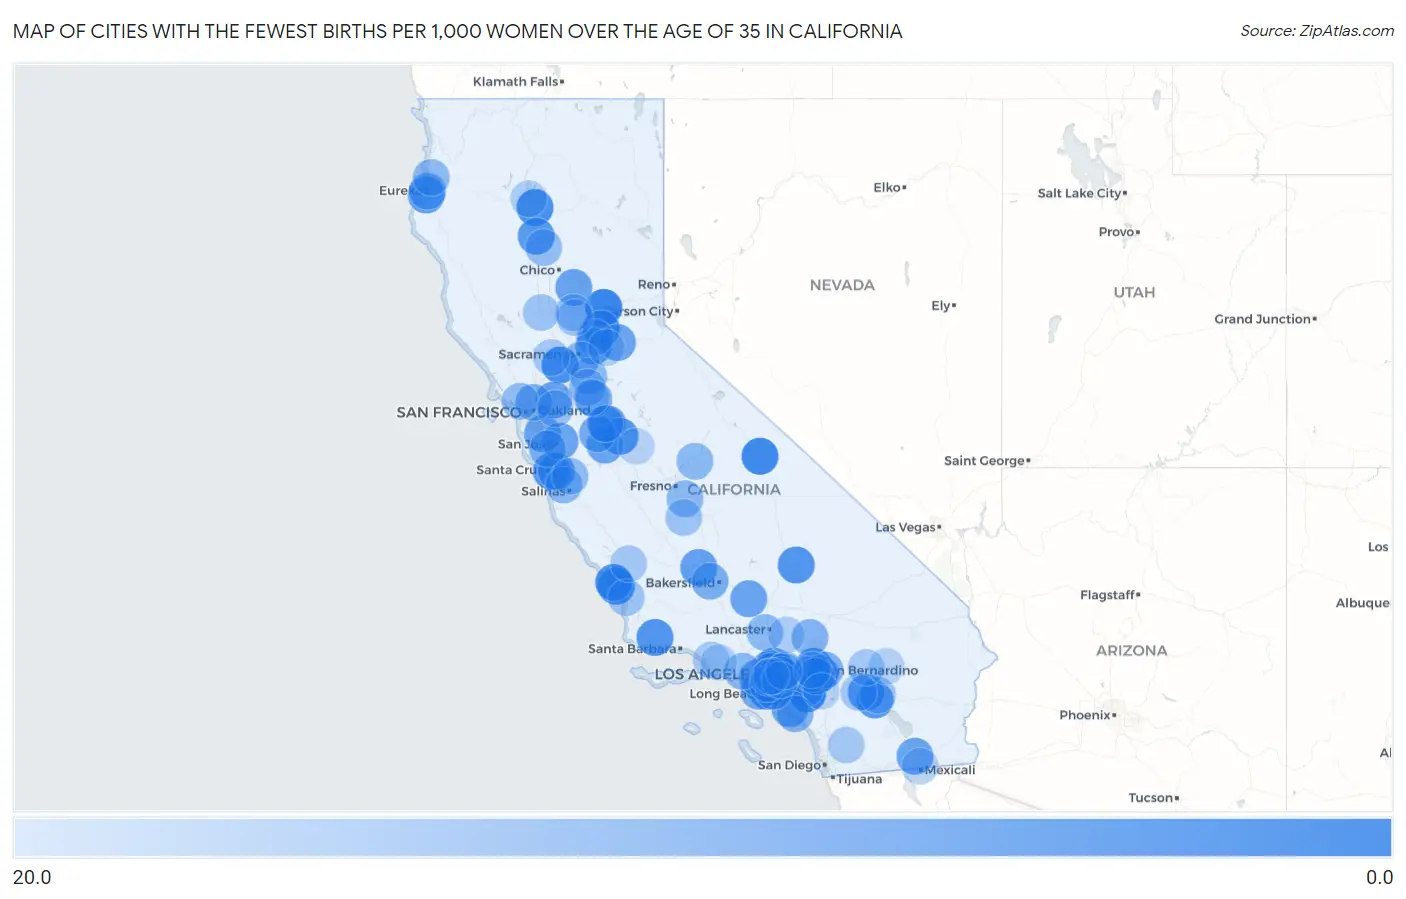
Map of Cities with the Fewest Births per 1,000 Women Over the Age of 35 in California
20.0
0.0
Cities with the Fewest Births per 1,000 Women Over the Age of 35 in California
| City | Births / 1,000 Women | vs State | vs National | |
| 1. | Grass Valley | 4.0 | 37.0(-33.0)#1 | 32.0(-28.0)#98 |
| 2. | Temescal Valley | 5.0 | 37.0(-32.0)#2 | 32.0(-27.0)#125 |
| 3. | Loma Linda | 5.0 | 37.0(-32.0)#3 | 32.0(-27.0)#128 |
| 4. | Big Pine | 5.0 | 37.0(-32.0)#4 | 32.0(-27.0)#169 |
| 5. | Dixon | 6.0 | 37.0(-31.0)#5 | 32.0(-26.0)#189 |
| 6. | South San Jose Hills | 6.0 | 37.0(-31.0)#6 | 32.0(-26.0)#191 |
| 7. | Los Osos | 6.0 | 37.0(-31.0)#7 | 32.0(-26.0)#200 |
| 8. | North Auburn | 6.0 | 37.0(-31.0)#8 | 32.0(-26.0)#203 |
| 9. | Signal Hill | 6.0 | 37.0(-31.0)#9 | 32.0(-26.0)#212 |
| 10. | Morro Bay | 6.0 | 37.0(-31.0)#10 | 32.0(-26.0)#217 |
| 11. | Bystrom | 6.0 | 37.0(-31.0)#11 | 32.0(-26.0)#234 |
| 12. | Palo Cedro | 6.0 | 37.0(-31.0)#12 | 32.0(-26.0)#235 |
| 13. | Ridgecrest | 7.0 | 37.0(-30.0)#13 | 32.0(-25.0)#252 |
| 14. | San Marino | 7.0 | 37.0(-30.0)#14 | 32.0(-25.0)#277 |
| 15. | Delhi | 7.0 | 37.0(-30.0)#15 | 32.0(-25.0)#290 |
| 16. | Solvang | 7.0 | 37.0(-30.0)#16 | 32.0(-25.0)#304 |
| 17. | North El Monte | 7.0 | 37.0(-30.0)#17 | 32.0(-25.0)#311 |
| 18. | La Quinta | 8.0 | 37.0(-29.0)#18 | 32.0(-24.0)#338 |
| 19. | Rancho Mirage | 8.0 | 37.0(-29.0)#19 | 32.0(-24.0)#367 |
| 20. | La Palma | 8.0 | 37.0(-29.0)#20 | 32.0(-24.0)#373 |
| 21. | Red Bluff | 8.0 | 37.0(-29.0)#21 | 32.0(-24.0)#374 |
| 22. | Muscoy | 8.0 | 37.0(-29.0)#22 | 32.0(-24.0)#380 |
| 23. | Pleasure Point | 8.0 | 37.0(-29.0)#23 | 32.0(-24.0)#401 |
| 24. | El Cerrito | 8.0 | 37.0(-29.0)#24 | 32.0(-24.0)#402 |
| 25. | Orangevale | 9.0 | 37.0(-28.0)#25 | 32.0(-23.0)#431 |
| 26. | Wasco | 9.0 | 37.0(-28.0)#26 | 32.0(-23.0)#434 |
| 27. | West Rancho Dominguez | 9.0 | 37.0(-28.0)#27 | 32.0(-23.0)#438 |
| 28. | Sierra Madre | 9.0 | 37.0(-28.0)#28 | 32.0(-23.0)#468 |
| 29. | Rio Del Mar | 9.0 | 37.0(-28.0)#29 | 32.0(-23.0)#482 |
| 30. | Pine Hills | 9.0 | 37.0(-28.0)#30 | 32.0(-23.0)#506 |
| 31. | East Palo Alto | 10.0 | 37.0(-27.0)#31 | 32.0(-22.0)#529 |
| 32. | Laguna Beach | 10.0 | 37.0(-27.0)#32 | 32.0(-22.0)#542 |
| 33. | Imperial | 10.0 | 37.0(-27.0)#33 | 32.0(-22.0)#547 |
| 34. | Oroville | 10.0 | 37.0(-27.0)#34 | 32.0(-22.0)#548 |
| 35. | Newman | 10.0 | 37.0(-27.0)#35 | 32.0(-22.0)#575 |
| 36. | Alum Rock | 10.0 | 37.0(-27.0)#36 | 32.0(-22.0)#578 |
| 37. | Clayton | 10.0 | 37.0(-27.0)#37 | 32.0(-22.0)#583 |
| 38. | Placerville | 10.0 | 37.0(-27.0)#38 | 32.0(-22.0)#588 |
| 39. | Golden Hills | 10.0 | 37.0(-27.0)#39 | 32.0(-22.0)#594 |
| 40. | Patterson | 11.0 | 37.0(-26.0)#40 | 32.0(-21.0)#672 |
| 41. | Bloomington | 11.0 | 37.0(-26.0)#41 | 32.0(-21.0)#674 |
| 42. | Lomita | 11.0 | 37.0(-26.0)#42 | 32.0(-21.0)#676 |
| 43. | View Park Windsor Hills | 11.0 | 37.0(-26.0)#43 | 32.0(-21.0)#699 |
| 44. | Garden Acres | 11.0 | 37.0(-26.0)#44 | 32.0(-21.0)#714 |
| 45. | Saratoga | 12.0 | 37.0(-25.0)#45 | 32.0(-20.0)#809 |
| 46. | Eureka | 12.0 | 37.0(-25.0)#46 | 32.0(-20.0)#812 |
| 47. | Rosedale | 12.0 | 37.0(-25.0)#47 | 32.0(-20.0)#834 |
| 48. | Kensington | 12.0 | 37.0(-25.0)#48 | 32.0(-20.0)#880 |
| 49. | Highland | 13.0 | 37.0(-24.0)#49 | 32.0(-19.0)#921 |
| 50. | San Gabriel | 13.0 | 37.0(-24.0)#50 | 32.0(-19.0)#926 |
| 51. | Adelanto | 13.0 | 37.0(-24.0)#51 | 32.0(-19.0)#927 |
| 52. | Dana Point | 13.0 | 37.0(-24.0)#52 | 32.0(-19.0)#929 |
| 53. | El Sobrante Cdp Riverside County | 13.0 | 37.0(-24.0)#53 | 32.0(-19.0)#970 |
| 54. | Los Alamitos | 13.0 | 37.0(-24.0)#54 | 32.0(-19.0)#973 |
| 55. | Charter Oak | 13.0 | 37.0(-24.0)#55 | 32.0(-19.0)#986 |
| 56. | Loomis | 13.0 | 37.0(-24.0)#56 | 32.0(-19.0)#997 |
| 57. | Rose Hills | 13.0 | 37.0(-24.0)#57 | 32.0(-19.0)#1,015 |
| 58. | Galt | 14.0 | 37.0(-23.0)#58 | 32.0(-18.0)#1,068 |
| 59. | Selma | 14.0 | 37.0(-23.0)#59 | 32.0(-18.0)#1,069 |
| 60. | Valinda | 14.0 | 37.0(-23.0)#60 | 32.0(-18.0)#1,075 |
| 61. | Mckinleyville | 14.0 | 37.0(-23.0)#61 | 32.0(-18.0)#1,087 |
| 62. | Parkway | 14.0 | 37.0(-23.0)#62 | 32.0(-18.0)#1,089 |
| 63. | Quartz Hill | 14.0 | 37.0(-23.0)#63 | 32.0(-18.0)#1,109 |
| 64. | Topanga | 14.0 | 37.0(-23.0)#64 | 32.0(-18.0)#1,116 |
| 65. | Castroville | 14.0 | 37.0(-23.0)#65 | 32.0(-18.0)#1,129 |
| 66. | West Modesto | 14.0 | 37.0(-23.0)#66 | 32.0(-18.0)#1,136 |
| 67. | Auberry | 14.0 | 37.0(-23.0)#67 | 32.0(-18.0)#1,146 |
| 68. | Lodi | 15.0 | 37.0(-22.0)#68 | 32.0(-17.0)#1,189 |
| 69. | Paramount | 15.0 | 37.0(-22.0)#69 | 32.0(-17.0)#1,191 |
| 70. | Marysville | 15.0 | 37.0(-22.0)#70 | 32.0(-17.0)#1,227 |
| 71. | Commerce | 15.0 | 37.0(-22.0)#71 | 32.0(-17.0)#1,229 |
| 72. | Corte Madera | 15.0 | 37.0(-22.0)#72 | 32.0(-17.0)#1,236 |
| 73. | Highgrove | 15.0 | 37.0(-22.0)#73 | 32.0(-17.0)#1,248 |
| 74. | La Habra Heights | 15.0 | 37.0(-22.0)#74 | 32.0(-17.0)#1,261 |
| 75. | Aromas | 15.0 | 37.0(-22.0)#75 | 32.0(-17.0)#1,280 |
| 76. | Los Molinos | 15.0 | 37.0(-22.0)#76 | 32.0(-17.0)#1,291 |
| 77. | Indio | 16.0 | 37.0(-21.0)#77 | 32.0(-16.0)#1,315 |
| 78. | Olivehurst | 16.0 | 37.0(-21.0)#78 | 32.0(-16.0)#1,349 |
| 79. | Blackhawk | 16.0 | 37.0(-21.0)#79 | 32.0(-16.0)#1,366 |
| 80. | Pismo Beach | 16.0 | 37.0(-21.0)#80 | 32.0(-16.0)#1,381 |
| 81. | Williams | 16.0 | 37.0(-21.0)#81 | 32.0(-16.0)#1,403 |
| 82. | Home Garden | 16.0 | 37.0(-21.0)#82 | 32.0(-16.0)#1,444 |
| 83. | Rialto | 17.0 | 37.0(-20.0)#83 | 32.0(-15.0)#1,464 |
| 84. | Palm Springs | 17.0 | 37.0(-20.0)#84 | 32.0(-15.0)#1,476 |
| 85. | El Paso De Robles Paso Robles | 17.0 | 37.0(-20.0)#85 | 32.0(-15.0)#1,483 |
| 86. | Yucca Valley | 17.0 | 37.0(-20.0)#86 | 32.0(-15.0)#1,498 |
| 87. | San Diego Country Estates | 17.0 | 37.0(-20.0)#87 | 32.0(-15.0)#1,528 |
| 88. | Winters | 17.0 | 37.0(-20.0)#88 | 32.0(-15.0)#1,549 |
| 89. | El Rio | 17.0 | 37.0(-20.0)#89 | 32.0(-15.0)#1,554 |
| 90. | Covina | 18.0 | 37.0(-19.0)#90 | 32.0(-14.0)#1,645 |
| 91. | Calexico | 18.0 | 37.0(-19.0)#91 | 32.0(-14.0)#1,651 |
| 92. | Cameron Park | 18.0 | 37.0(-19.0)#92 | 32.0(-14.0)#1,675 |
| 93. | Lake Los Angeles | 18.0 | 37.0(-19.0)#93 | 32.0(-14.0)#1,687 |
| 94. | Shasta Lake | 18.0 | 37.0(-19.0)#94 | 32.0(-14.0)#1,699 |
| 95. | August | 18.0 | 37.0(-19.0)#95 | 32.0(-14.0)#1,709 |
| 96. | Merced | 19.0 | 37.0(-18.0)#96 | 32.0(-13.0)#1,803 |
| 97. | Perris | 19.0 | 37.0(-18.0)#97 | 32.0(-13.0)#1,805 |
| 98. | Camarillo | 19.0 | 37.0(-18.0)#98 | 32.0(-13.0)#1,809 |
| 99. | Montebello | 19.0 | 37.0(-18.0)#99 | 32.0(-13.0)#1,814 |
| 100. | Twentynine Palms | 19.0 | 37.0(-18.0)#100 | 32.0(-13.0)#1,836 |
Common Questions
What are the Top 10 Cities with the Fewest Births per 1,000 Women Over the Age of 35 in California?
Top 10 Cities with the Fewest Births per 1,000 Women Over the Age of 35 in California are:
#1
4.0
#2
5.0
#3
5.0
#4
5.0
#5
6.0
#6
6.0
#7
6.0
#8
6.0
#9
6.0
#10
6.0
What city has the Fewest Births per 1,000 Women Over the Age of 35 in California?
Grass Valley has the Fewest Births per 1,000 Women Over the Age of 35 in California with 4.0.
What is the Number of Births per 1,000 Women Over the Age of 35 in the State of California?
Number of Births per 1,000 Women Over the Age of 35 in California is 37.0.
What is the Number of Births per 1,000 Women Over the Age of 35 in the United States?
Number of Births per 1,000 Women Over the Age of 35 in the United States is 32.0.