Illinois Map & Demographics
Illinois Map
Illinois Overview
Dec 3, 1818
INCORPORATED
57,916
TOTAL AREA [ SQ MI ]
55,518
LAND AREA [ SQ MI ]
2,398
WATER AREA [ SQ MI ]
600
ELEVATION AVG [ FT ]
1,235
ELEVATION HIGH [ FT ]
279
ELEVATION LOW [ FT ]
229.8
POP DENSITY [ PPL / SQ MI ]
$43,198
PER CAPITA INCOME
$99,215
AVG FAMILY INCOME
$78,433
AVG HOUSEHOLD INCOME
29.6%
WAGE / INCOME GAP [ % ]
70.4¢/ $1
WAGE / INCOME GAP [ $ ]
$11,242
FAMILY INCOME DEFICIT
0.48
INEQUALITY / GINI INDEX
60629
LARGEST ZIP CODE
Chicago
LARGEST CITY
Cook County
LARGEST COUNTY
12,757,634
TOTAL POPULATION
6,313,019
MALE POPULATION
6,444,615
FEMALE POPULATION
97.96
MALES / 100 FEMALES
102.08
FEMALES / 100 MALES
38.7
MEDIAN AGE
3.2
AVG FAMILY SIZE
2.5
AVG HOUSEHOLD SIZE
6,698,657
LABOR FORCE [ PEOPLE ]
65.2%
PERCENT IN LABOR FORCE
6.0%
UNEMPLOYMENT RATE
Income in Illinois
Income Overview in Illinois
Per Capita Income in Illinois is $43,198, while median incomes of families and households are $99,215 and $78,433 respectively.
| Characteristic | Number | Measure |
| Per Capita Income | 12,757,634 | $43,198 |
| Median Family Income | 3,134,103 | $99,215 |
| Mean Family Income | 3,134,103 | $130,956 |
| Median Household Income | 4,968,761 | $78,433 |
| Mean Household Income | 4,968,761 | $108,873 |
| Income Deficit | 3,134,103 | $11,242 |
| Wage / Income Gap (%) | 12,757,634 | 29.57% |
| Wage / Income Gap ($) | 12,757,634 | 70.43¢ per $1 |
| Gini / Inequality Index | 12,757,634 | 0.48 |
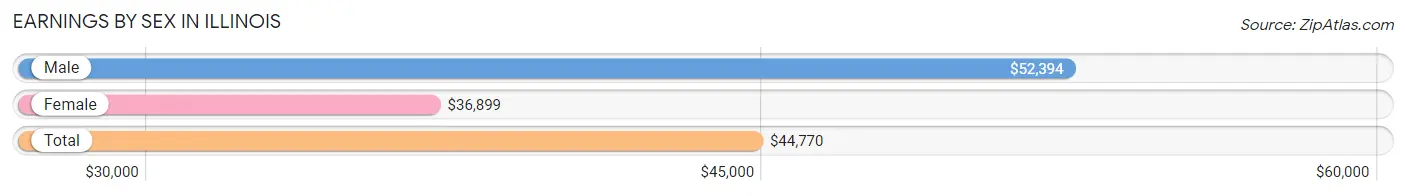
Earnings by Sex in Illinois
Average Earnings in Illinois are $44,770, $52,394 for men and $36,899 for women, a difference of 29.6%.
| Sex | Number | Average Earnings |
| Male | 3,623,635 (52.5%) | $52,394 |
| Female | 3,278,111 (47.5%) | $36,899 |
| Total | 6,901,746 (100.0%) | $44,770 |
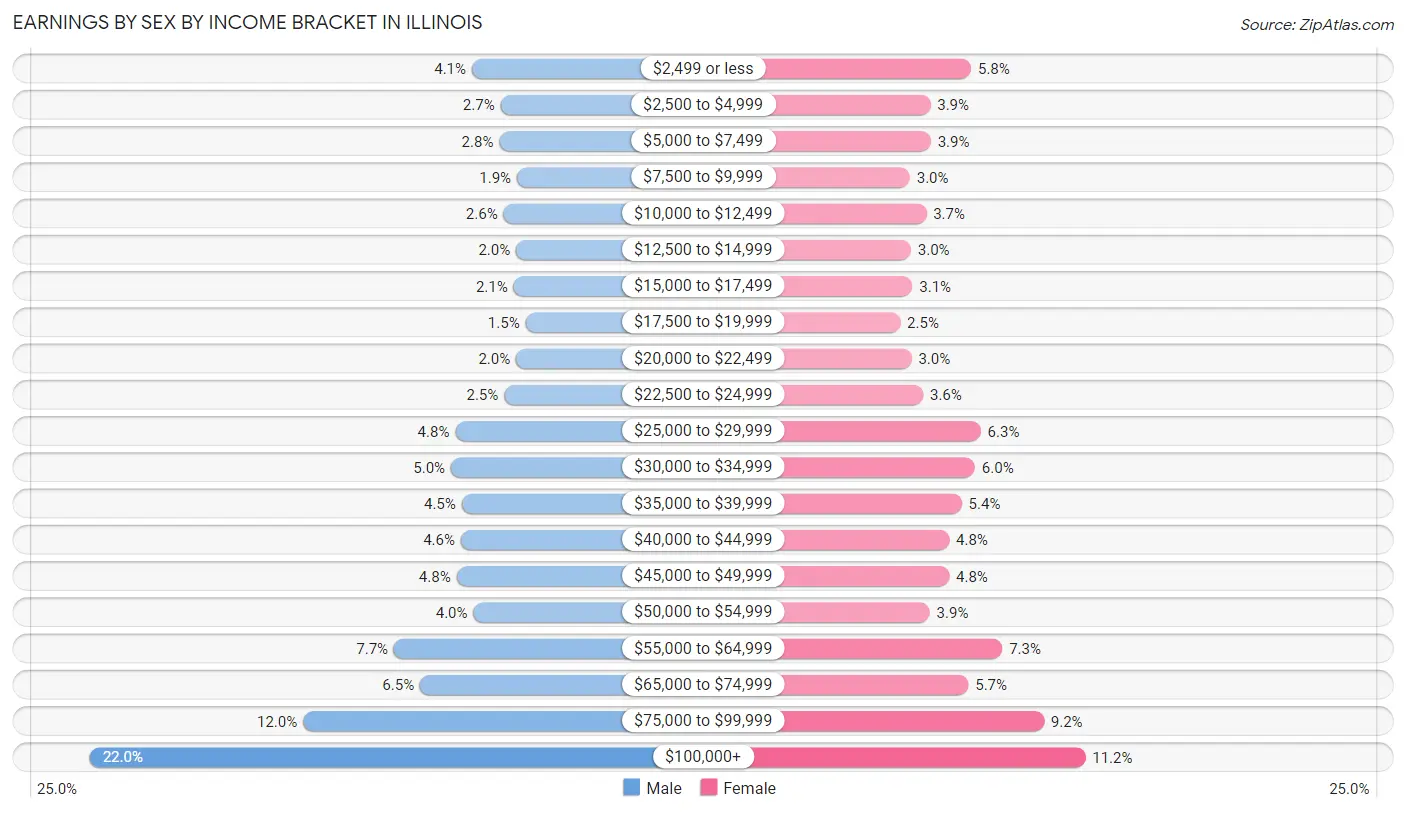
Earnings by Sex by Income Bracket in Illinois
The most common earnings brackets in Illinois are $100,000+ for men (795,547 | 22.0%) and $100,000+ for women (366,216 | 11.2%).
| Income | Male | Female |
| $2,499 or less | 146,928 (4.1%) | 190,842 (5.8%) |
| $2,500 to $4,999 | 98,267 (2.7%) | 128,310 (3.9%) |
| $5,000 to $7,499 | 100,528 (2.8%) | 128,741 (3.9%) |
| $7,500 to $9,999 | 70,358 (1.9%) | 96,814 (2.9%) |
| $10,000 to $12,499 | 93,148 (2.6%) | 121,884 (3.7%) |
| $12,500 to $14,999 | 71,791 (2.0%) | 98,263 (3.0%) |
| $15,000 to $17,499 | 76,039 (2.1%) | 100,746 (3.1%) |
| $17,500 to $19,999 | 55,915 (1.5%) | 82,014 (2.5%) |
| $20,000 to $22,499 | 71,645 (2.0%) | 99,453 (3.0%) |
| $22,500 to $24,999 | 91,887 (2.5%) | 117,152 (3.6%) |
| $25,000 to $29,999 | 175,192 (4.8%) | 205,496 (6.3%) |
| $30,000 to $34,999 | 182,119 (5.0%) | 196,753 (6.0%) |
| $35,000 to $39,999 | 164,272 (4.5%) | 176,518 (5.4%) |
| $40,000 to $44,999 | 165,469 (4.6%) | 156,961 (4.8%) |
| $45,000 to $49,999 | 172,938 (4.8%) | 157,181 (4.8%) |
| $50,000 to $54,999 | 144,364 (4.0%) | 127,084 (3.9%) |
| $55,000 to $64,999 | 278,888 (7.7%) | 238,725 (7.3%) |
| $65,000 to $74,999 | 234,845 (6.5%) | 186,418 (5.7%) |
| $75,000 to $99,999 | 433,495 (12.0%) | 302,540 (9.2%) |
| $100,000+ | 795,547 (22.0%) | 366,216 (11.2%) |
| Total | 3,623,635 (100.0%) | 3,278,111 (100.0%) |
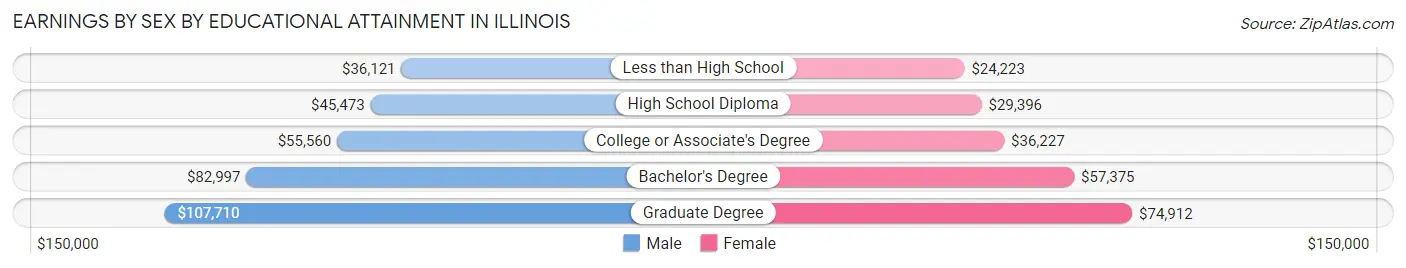
Earnings by Sex by Educational Attainment in Illinois
Average earnings in Illinois are $59,878 for men and $43,092 for women, a difference of 28.0%. Men with an educational attainment of graduate degree enjoy the highest average annual earnings of $107,710, while those with less than high school education earn the least with $36,121. Women with an educational attainment of graduate degree earn the most with the average annual earnings of $74,912, while those with less than high school education have the smallest earnings of $24,223.
| Educational Attainment | Male Income | Female Income |
| Less than High School | $36,121 | $24,223 |
| High School Diploma | $45,473 | $29,396 |
| College or Associate's Degree | $55,560 | $36,227 |
| Bachelor's Degree | $82,997 | $57,375 |
| Graduate Degree | $107,710 | $74,912 |
| Total | $59,878 | $43,092 |
Family Income in Illinois
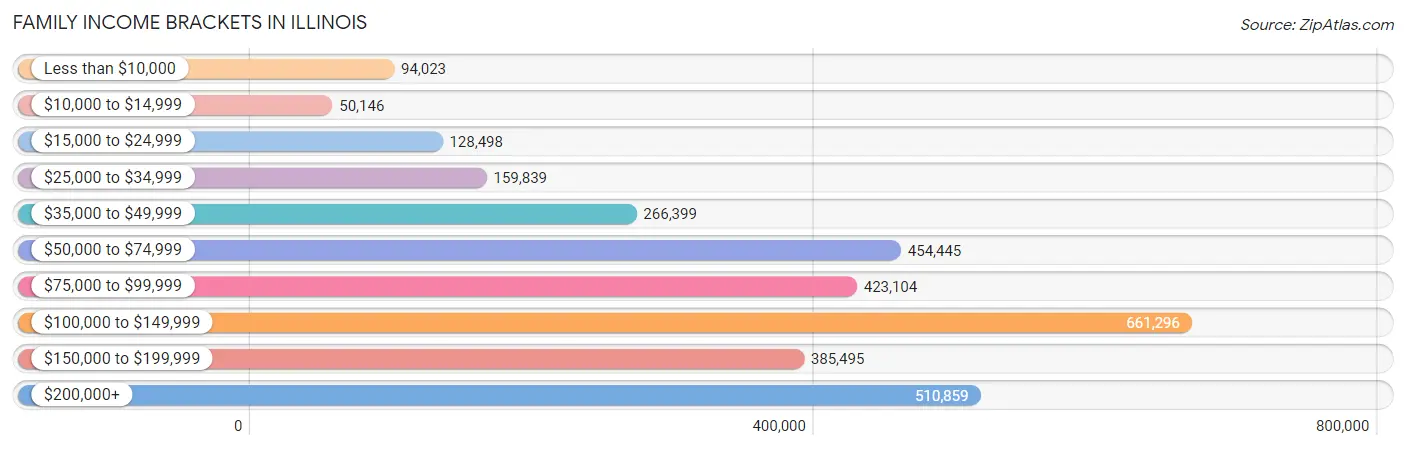
Family Income Brackets in Illinois
According to the Illinois family income data, there are 661,296 families falling into the $100,000 to $149,999 income range, which is the most common income bracket and makes up 21.1% of all families. Conversely, the $10,000 to $14,999 income bracket is the least frequent group with only 50,146 families (1.6%) belonging to this category.
| Income Bracket | # Families | % Families |
| Less than $10,000 | 94,023 | 3.0% |
| $10,000 to $14,999 | 50,146 | 1.6% |
| $15,000 to $24,999 | 128,498 | 4.1% |
| $25,000 to $34,999 | 159,839 | 5.1% |
| $35,000 to $49,999 | 266,399 | 8.5% |
| $50,000 to $74,999 | 454,445 | 14.5% |
| $75,000 to $99,999 | 423,104 | 13.5% |
| $100,000 to $149,999 | 661,296 | 21.1% |
| $150,000 to $199,999 | 385,495 | 12.3% |
| $200,000+ | 510,859 | 16.3% |
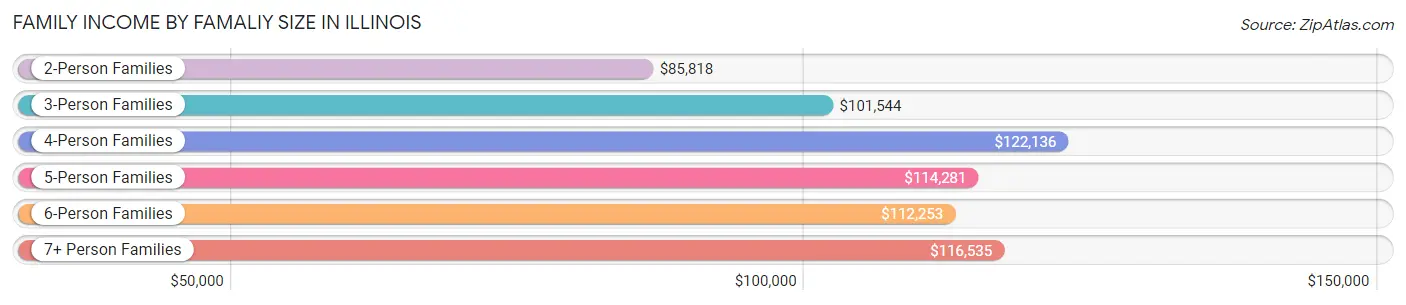
Family Income by Famaliy Size in Illinois
4-person families (592,698 | 18.9%) account for the highest median family income in Illinois with $122,136 per family, while 2-person families (1,424,483 | 45.5%) have the highest median income of $42,909 per family member.
| Income Bracket | # Families | Median Income |
| 2-Person Families | 1,424,483 (45.5%) | $85,818 |
| 3-Person Families | 698,733 (22.3%) | $101,544 |
| 4-Person Families | 592,698 (18.9%) | $122,136 |
| 5-Person Families | 272,128 (8.7%) | $114,281 |
| 6-Person Families | 93,884 (3.0%) | $112,253 |
| 7+ Person Families | 52,177 (1.7%) | $116,535 |
| Total | 3,134,103 (100.0%) | $99,215 |
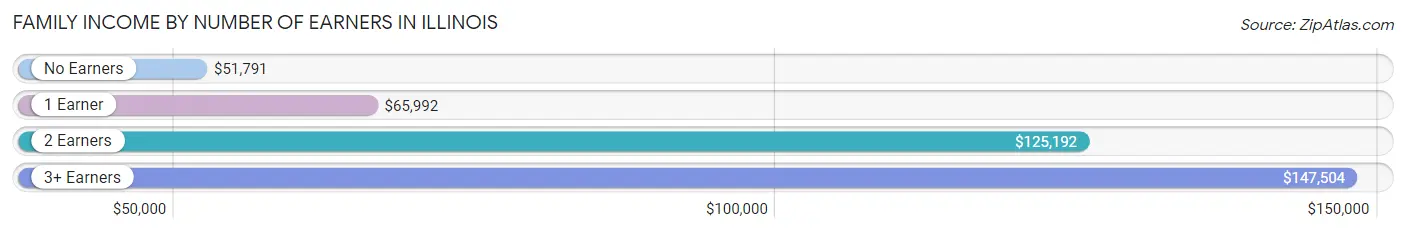
Family Income by Number of Earners in Illinois
The median family income in Illinois is $99,215, with families comprising 3+ earners (419,328) having the highest median family income of $147,504, while families with no earners (421,382) have the lowest median family income of $51,791, accounting for 13.4% and 13.5% of families, respectively.
| Number of Earners | # Families | Median Income |
| No Earners | 421,382 (13.5%) | $51,791 |
| 1 Earner | 961,778 (30.7%) | $65,992 |
| 2 Earners | 1,331,615 (42.5%) | $125,192 |
| 3+ Earners | 419,328 (13.4%) | $147,504 |
| Total | 3,134,103 (100.0%) | $99,215 |
Household Income in Illinois
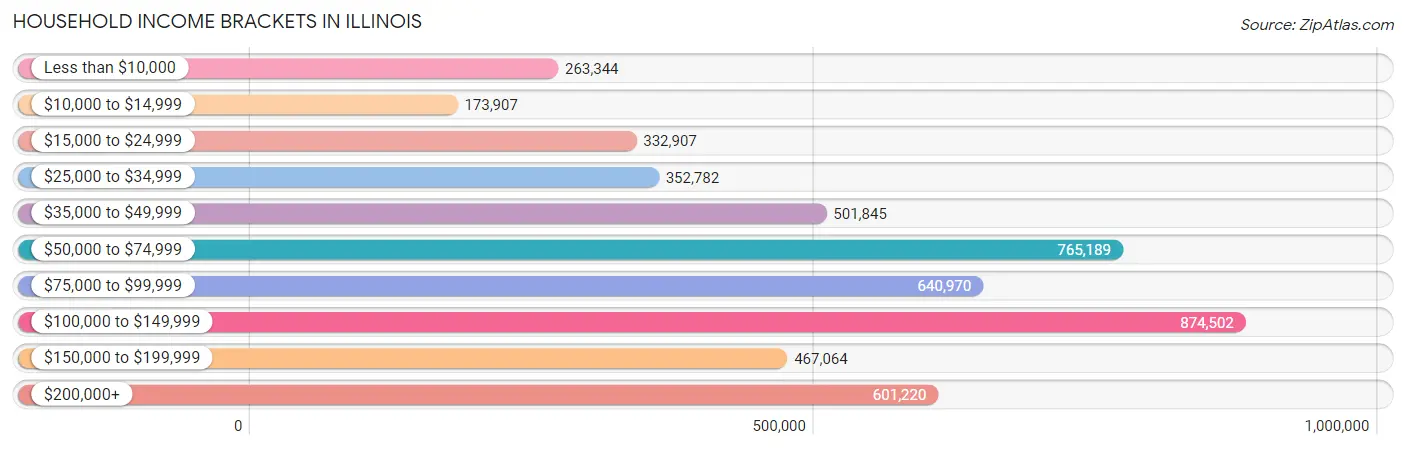
Household Income Brackets in Illinois
With 874,502 households falling in the category, the $100,000 to $149,999 income range is the most frequent in Illinois, accounting for 17.6% of all households. In contrast, only 173,907 households (3.5%) fall into the $10,000 to $14,999 income bracket, making it the least populous group.
| Income Bracket | # Households | % Households |
| Less than $10,000 | 263,344 | 5.3% |
| $10,000 to $14,999 | 173,907 | 3.5% |
| $15,000 to $24,999 | 332,907 | 6.7% |
| $25,000 to $34,999 | 352,782 | 7.1% |
| $35,000 to $49,999 | 501,845 | 10.1% |
| $50,000 to $74,999 | 765,189 | 15.4% |
| $75,000 to $99,999 | 640,970 | 12.9% |
| $100,000 to $149,999 | 874,502 | 17.6% |
| $150,000 to $199,999 | 467,064 | 9.4% |
| $200,000+ | 601,220 | 12.1% |
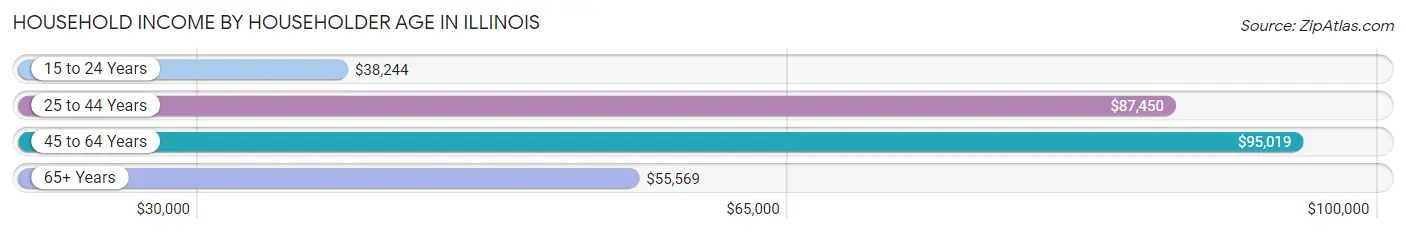
Household Income by Householder Age in Illinois
The median household income in Illinois is $78,433, with the highest median household income of $95,019 found in the 45 to 64 years age bracket for the primary householder. A total of 1,836,793 households (37.0%) fall into this category. Meanwhile, the 15 to 24 years age bracket for the primary householder has the lowest median household income of $38,244, with 178,413 households (3.6%) in this group.
| Income Bracket | # Households | Median Income |
| 15 to 24 Years | 178,413 (3.6%) | $38,244 |
| 25 to 44 Years | 1,645,571 (33.1%) | $87,450 |
| 45 to 64 Years | 1,836,793 (37.0%) | $95,019 |
| 65+ Years | 1,307,984 (26.3%) | $55,569 |
| Total | 4,968,761 (100.0%) | $78,433 |
Poverty in Illinois
Income Below Poverty by Sex and Age in Illinois
With 10.6% poverty level for males and 12.9% for females among the residents of Illinois, 5 year old males and 18 to 24 year old females are the most vulnerable to poverty, with 12,643 males (17.1%) and 109,420 females (20.3%) in their respective age groups living below the poverty level.
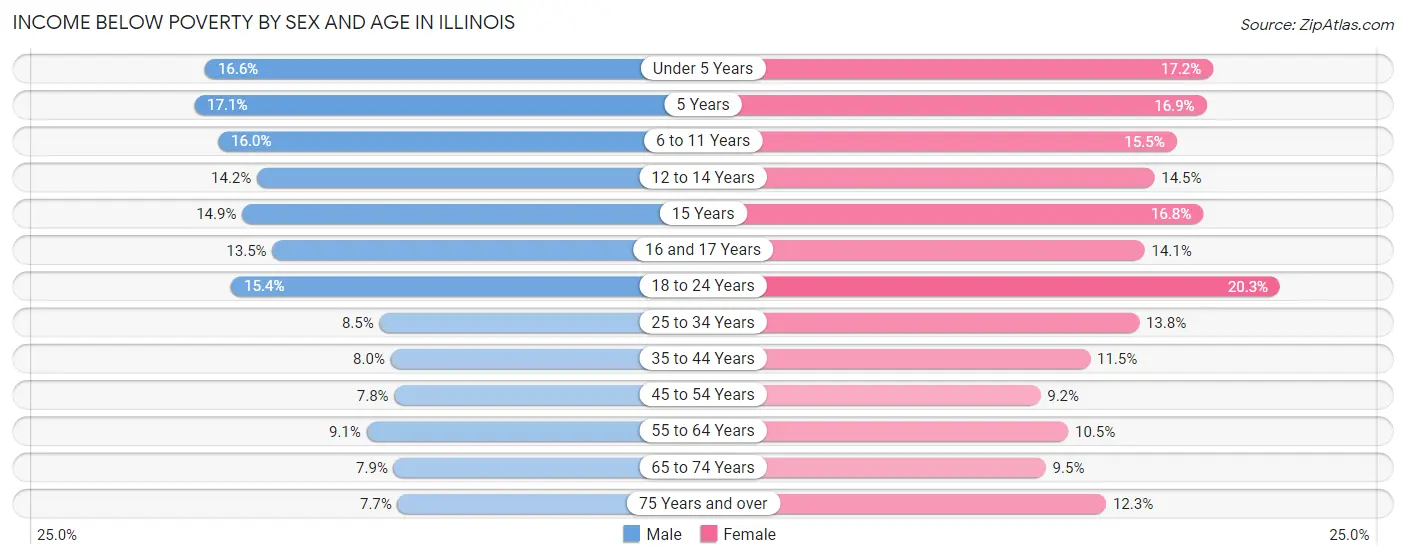
| Age Bracket | Male | Female |
| Under 5 Years | 60,163 (16.6%) | 59,685 (17.2%) |
| 5 Years | 12,643 (17.1%) | 12,193 (16.9%) |
| 6 to 11 Years | 76,123 (16.0%) | 70,178 (15.5%) |
| 12 to 14 Years | 35,893 (14.2%) | 34,895 (14.5%) |
| 15 Years | 12,929 (14.9%) | 14,075 (16.8%) |
| 16 and 17 Years | 23,184 (13.5%) | 22,945 (14.1%) |
| 18 to 24 Years | 85,515 (15.4%) | 109,420 (20.3%) |
| 25 to 34 Years | 73,092 (8.5%) | 117,578 (13.8%) |
| 35 to 44 Years | 66,455 (8.0%) | 95,071 (11.5%) |
| 45 to 54 Years | 62,298 (7.8%) | 73,484 (9.2%) |
| 55 to 64 Years | 73,448 (9.1%) | 87,910 (10.5%) |
| 65 to 74 Years | 44,142 (7.9%) | 59,948 (9.5%) |
| 75 Years and over | 25,272 (7.7%) | 59,354 (12.3%) |
| Total | 651,157 (10.6%) | 816,736 (12.9%) |
Income Above Poverty by Sex and Age in Illinois
According to the poverty statistics in Illinois, males aged 75 years and over and females aged 45 to 54 years are the age groups that are most secure financially, with 92.3% of males and 90.8% of females in these age groups living above the poverty line.
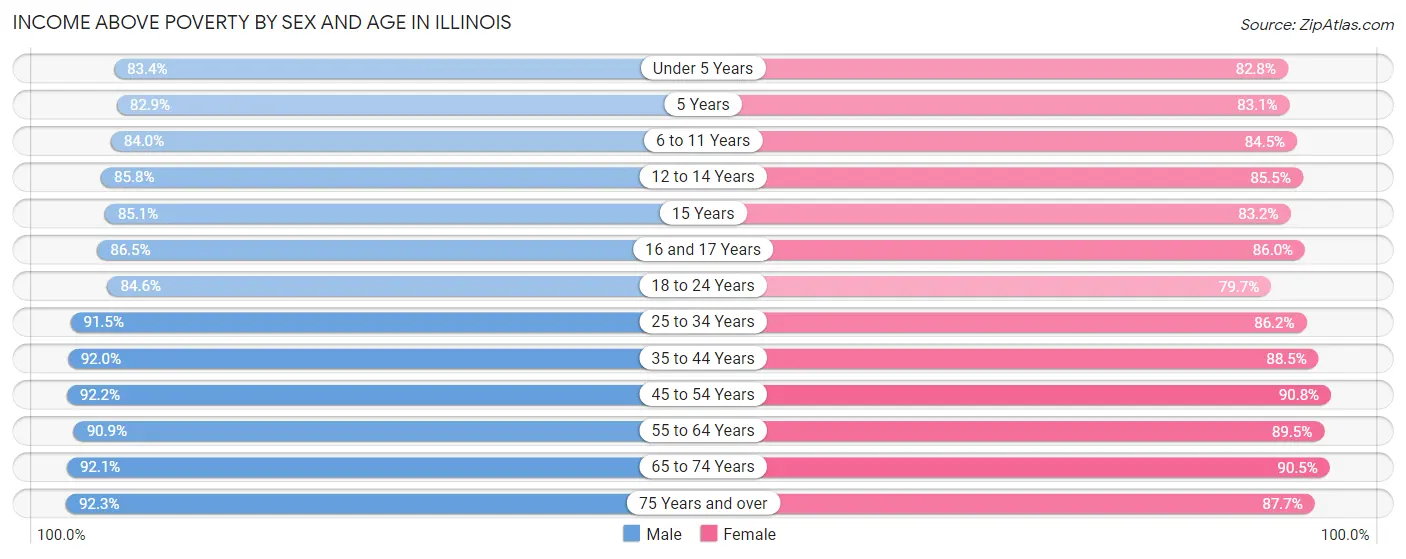
| Age Bracket | Male | Female |
| Under 5 Years | 301,660 (83.4%) | 286,714 (82.8%) |
| 5 Years | 61,148 (82.9%) | 59,855 (83.1%) |
| 6 to 11 Years | 399,143 (84.0%) | 381,715 (84.5%) |
| 12 to 14 Years | 216,703 (85.8%) | 205,818 (85.5%) |
| 15 Years | 73,854 (85.1%) | 69,892 (83.2%) |
| 16 and 17 Years | 148,560 (86.5%) | 140,308 (86.0%) |
| 18 to 24 Years | 468,905 (84.6%) | 428,680 (79.7%) |
| 25 to 34 Years | 783,994 (91.5%) | 734,854 (86.2%) |
| 35 to 44 Years | 763,264 (92.0%) | 729,967 (88.5%) |
| 45 to 54 Years | 732,737 (92.2%) | 724,661 (90.8%) |
| 55 to 64 Years | 730,587 (90.9%) | 748,943 (89.5%) |
| 65 to 74 Years | 516,781 (92.1%) | 573,678 (90.5%) |
| 75 Years and over | 303,530 (92.3%) | 424,820 (87.7%) |
| Total | 5,500,866 (89.4%) | 5,509,905 (87.1%) |
Income Below Poverty Among Married-Couple Families in Illinois
The poverty statistics for married-couple families in Illinois show that 3.8% or 86,579 of the total 2,301,882 families live below the poverty line. Families with 5 or more children have the highest poverty rate of 19.0%, comprising of 2,358 families. On the other hand, families with no children have the lowest poverty rate of 2.9%, which includes 38,852 families.
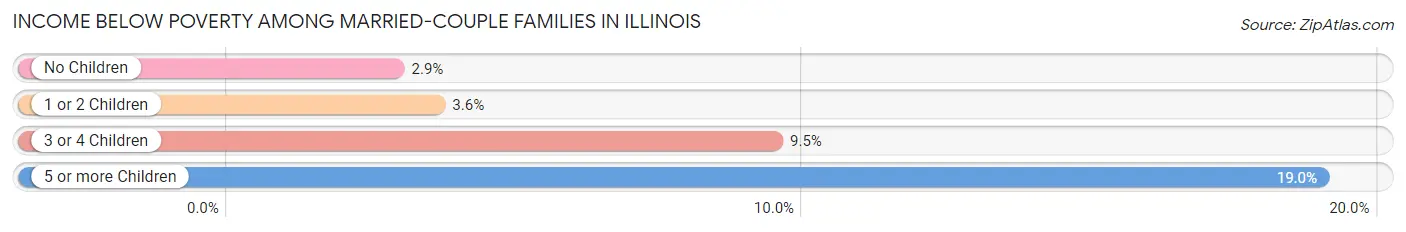
| Children | Above Poverty | Below Poverty |
| No Children | 1,301,487 (97.1%) | 38,852 (2.9%) |
| 1 or 2 Children | 732,871 (96.4%) | 27,455 (3.6%) |
| 3 or 4 Children | 170,884 (90.5%) | 17,914 (9.5%) |
| 5 or more Children | 10,061 (81.0%) | 2,358 (19.0%) |
| Total | 2,215,303 (96.2%) | 86,579 (3.8%) |
Income Below Poverty Among Single-Parent Households in Illinois
According to the poverty data in Illinois, 12.2% or 28,794 single-father households and 23.6% or 140,706 single-mother households are living below the poverty line. Among single-father households, those with 5 or more children have the highest poverty rate, with 534 households (35.3%) experiencing poverty. Likewise, among single-mother households, those with 5 or more children have the highest poverty rate, with 4,798 households (67.4%) falling below the poverty line.
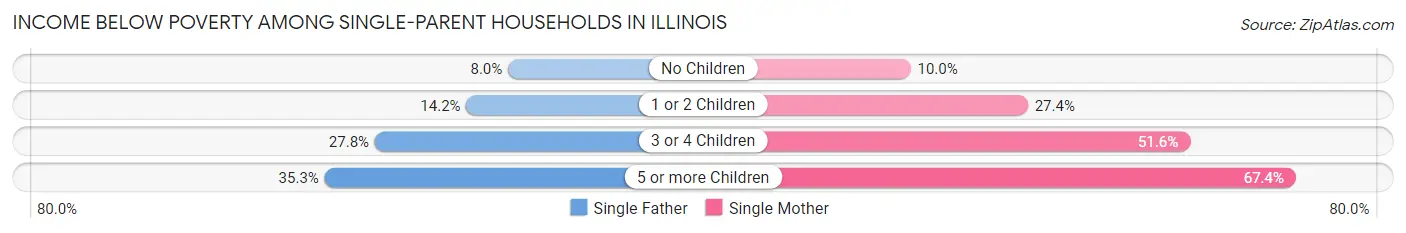
| Children | Single Father | Single Mother |
| No Children | 9,247 (8.0%) | 23,208 (10.0%) |
| 1 or 2 Children | 14,433 (14.2%) | 80,551 (27.4%) |
| 3 or 4 Children | 4,580 (27.8%) | 32,149 (51.6%) |
| 5 or more Children | 534 (35.3%) | 4,798 (67.4%) |
| Total | 28,794 (12.2%) | 140,706 (23.6%) |
Income Below Poverty Among Married-Couple vs Single-Parent Households in Illinois
The poverty data for Illinois shows that 86,579 of the married-couple family households (3.8%) and 169,500 of the single-parent households (20.4%) are living below the poverty level. Within the married-couple family households, those with 5 or more children have the highest poverty rate, with 2,358 households (19.0%) falling below the poverty line. Among the single-parent households, those with 5 or more children have the highest poverty rate, with 5,332 household (61.8%) living below poverty.
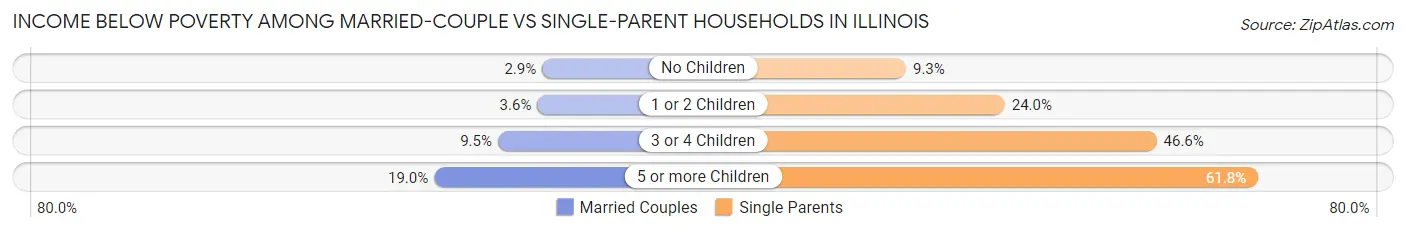
| Children | Married-Couple Families | Single-Parent Households |
| No Children | 38,852 (2.9%) | 32,455 (9.3%) |
| 1 or 2 Children | 27,455 (3.6%) | 94,984 (24.0%) |
| 3 or 4 Children | 17,914 (9.5%) | 36,729 (46.6%) |
| 5 or more Children | 2,358 (19.0%) | 5,332 (61.8%) |
| Total | 86,579 (3.8%) | 169,500 (20.4%) |
Largest Zip Codes by Population in Illinois
The largest zip codes in Illinois by population are 60629 (108,997), 60618 (92,235), 60632 (86,372), 60647 (85,685), and 60639 (85,248).
1.60629
108,997 (0.85%)
2.60618
92,235 (0.72%)
3.60632
86,372 (0.68%)
4.60647
85,685 (0.67%)
5.60639
85,248 (0.67%)
6.60804
84,189 (0.66%)
7.60617
83,188 (0.65%)
8.60608
82,749 (0.65%)
9.60625
80,296 (0.63%)
10.60623
76,611 (0.60%)
11.60634
75,873 (0.59%)
12.60614
71,701 (0.56%)
13.60085
71,465 (0.56%)
14.60657
71,192 (0.56%)
15.60641
68,968 (0.54%)
16.60620
68,330 (0.54%)
17.60640
67,317 (0.53%)
18.60651
65,229 (0.51%)
19.60402
64,659 (0.51%)
20.60609
63,241 (0.50%)
21.60073
62,071 (0.49%)
22.60016
61,988 (0.49%)
23.60628
61,419 (0.48%)
24.60619
60,443 (0.47%)
25.60505
59,466 (0.47%)
26.60638
57,799 (0.45%)
27.60453
57,665 (0.45%)
28.60056
56,651 (0.44%)
29.60630
55,295 (0.43%)
30.60622
53,944 (0.42%)
Largest Cities by Population in Illinois
The largest cities in Illinois by population are Chicago (2,721,914), Aurora (181,405), Joliet (150,221), Naperville (149,089), and Rockford (148,173).
1.Chicago
2,721,914 (21.34%)
2.Aurora
181,405 (1.42%)
3.Joliet
150,221 (1.18%)
149,089 (1.17%)
5.Rockford
148,173 (1.16%)
114,214 (0.90%)
7.Elgin
114,190 (0.90%)
8.Peoria
113,054 (0.89%)
9.Waukegan
89,435 (0.70%)
10.Champaign
88,628 (0.69%)
11.Cicero
84,189 (0.66%)
12.Bloomington
78,788 (0.62%)
13.Schaumburg
77,571 (0.61%)
14.Evanston
77,181 (0.60%)
76,794 (0.60%)
16.Bolingbrook
73,755 (0.58%)
17.Decatur
70,975 (0.56%)
18.Palatine
67,223 (0.53%)
19.Skokie
67,076 (0.53%)
20.Des Plaines
60,087 (0.47%)
21.Orland Park
58,345 (0.46%)
22.Oak Lawn
57,665 (0.45%)
23.Berwyn
56,556 (0.44%)
56,191 (0.44%)
25.Tinley Park
55,571 (0.44%)
26.Oak Park
53,834 (0.42%)
27.Wheaton
53,673 (0.42%)
28.Normal
52,920 (0.41%)
51,744 (0.41%)
49,996 (0.39%)
Largest Counties by Population in Illinois
The largest counties in Illinois by population are Cook County (5,225,367), DuPage County (930,559), Lake County (713,159), Will County (696,774), and Kane County (517,254).
5,225,367 (40.96%)
930,559 (7.29%)
713,159 (5.59%)
696,774 (5.46%)
517,254 (4.05%)
311,133 (2.44%)
284,591 (2.23%)
265,512 (2.08%)
256,791 (2.01%)
206,525 (1.62%)
196,122 (1.54%)
181,186 (1.42%)
171,284 (1.34%)
143,819 (1.13%)
132,795 (1.04%)
131,276 (1.03%)
109,495 (0.86%)
107,421 (0.84%)
19.Macon County
103,542 (0.81%)
100,686 (0.79%)
74,113 (0.58%)
67,120 (0.53%)
23.Adams County
65,583 (0.51%)
55,569 (0.44%)
25.Boone County
53,459 (0.42%)
53,176 (0.42%)
52,624 (0.41%)
28.Ogle County
51,672 (0.41%)
29.Knox County
49,751 (0.39%)
30.Henry County
49,157 (0.39%)
Race in Illinois
The most populous races in Illinois are White / Caucasian (8,388,659 | 65.7%), Hispanic or Latino (2,275,704 | 17.8%), and Black / African American (1,774,605 | 13.9%).
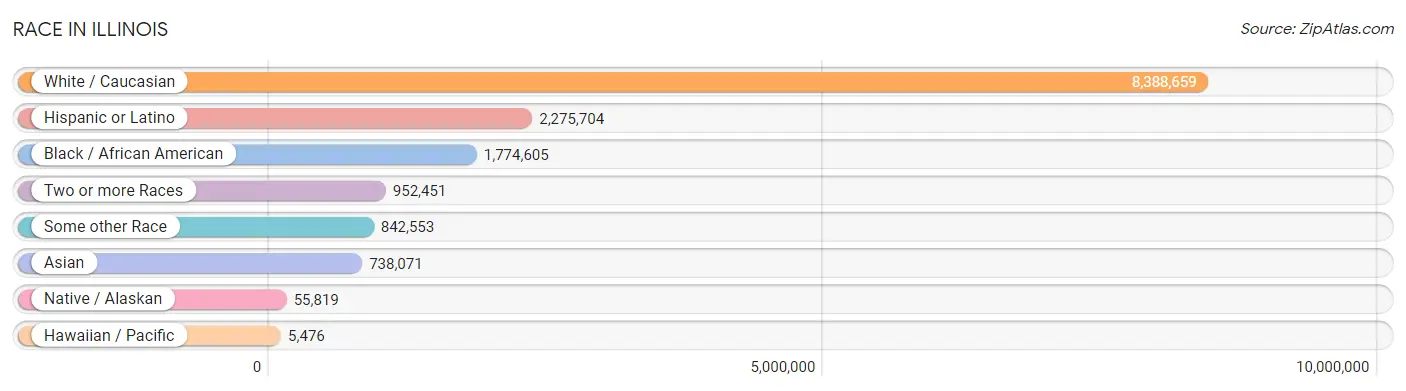
| Race | # Population | % Population |
| Asian | 738,071 | 5.8% |
| Black / African American | 1,774,605 | 13.9% |
| Hawaiian / Pacific | 5,476 | 0.0% |
| Hispanic or Latino | 2,275,704 | 17.8% |
| Native / Alaskan | 55,819 | 0.4% |
| White / Caucasian | 8,388,659 | 65.7% |
| Two or more Races | 952,451 | 7.5% |
| Some other Race | 842,553 | 6.6% |
| Total | 12,757,634 | 100.0% |
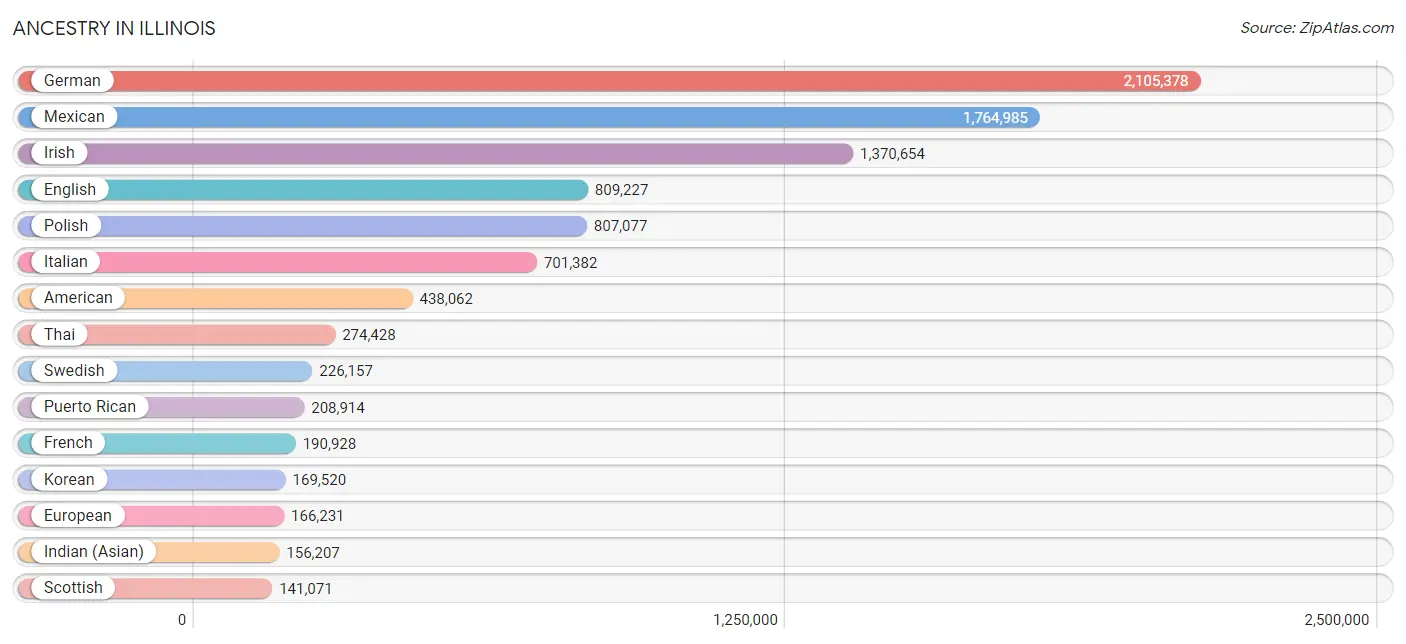
Ancestry in Illinois
The most populous ancestries reported in Illinois are German (2,105,378 | 16.5%), Mexican (1,764,985 | 13.8%), Irish (1,370,654 | 10.7%), English (809,227 | 6.3%), and Polish (807,077 | 6.3%), together accounting for 53.7% of all Illinois residents.
| Ancestry | # Population | % Population |
| Afghan | 1,601 | 0.0% |
| African | 71,530 | 0.6% |
| Alaska Native | 188 | 0.0% |
| Alaskan Athabascan | 111 | 0.0% |
| Albanian | 14,400 | 0.1% |
| Aleut | 57 | 0.0% |
| Alsatian | 422 | 0.0% |
| American | 438,062 | 3.4% |
| Apache | 2,501 | 0.0% |
| Arab | 96,334 | 0.8% |
| Arapaho | 51 | 0.0% |
| Argentinean | 6,273 | 0.1% |
| Armenian | 9,346 | 0.1% |
| Assyrian / Chaldean / Syriac | 14,802 | 0.1% |
| Australian | 3,110 | 0.0% |
| Austrian | 32,983 | 0.3% |
| Bahamian | 435 | 0.0% |
| Bangladeshi | 767 | 0.0% |
| Barbadian | 710 | 0.0% |
| Basque | 508 | 0.0% |
| Belgian | 24,612 | 0.2% |
| Belizean | 7,132 | 0.1% |
| Bermudan | 185 | 0.0% |
| Bhutanese | 35,296 | 0.3% |
| Blackfeet | 4,521 | 0.0% |
| Bolivian | 3,252 | 0.0% |
| Brazilian | 7,030 | 0.1% |
| British | 46,808 | 0.4% |
| British West Indian | 682 | 0.0% |
| Bulgarian | 17,106 | 0.1% |
| Burmese | 73,081 | 0.6% |
| Cajun | 421 | 0.0% |
| Cambodian | 6,404 | 0.1% |
| Canadian | 12,983 | 0.1% |
| Cape Verdean | 281 | 0.0% |
| Carpatho Rusyn | 159 | 0.0% |
| Celtic | 762 | 0.0% |
| Central American | 91,612 | 0.7% |
| Central American Indian | 11,725 | 0.1% |
| Cherokee | 25,384 | 0.2% |
| Cheyenne | 255 | 0.0% |
| Chickasaw | 452 | 0.0% |
| Chilean | 4,390 | 0.0% |
| Chinese | 95 | 0.0% |
| Chippewa | 2,873 | 0.0% |
| Choctaw | 3,144 | 0.0% |
| Colombian | 28,537 | 0.2% |
| Colville | 2 | 0.0% |
| Comanche | 620 | 0.0% |
| Costa Rican | 2,785 | 0.0% |
| Cree | 236 | 0.0% |
| Creek | 886 | 0.0% |
| Croatian | 37,361 | 0.3% |
| Crow | 180 | 0.0% |
| Cuban | 28,595 | 0.2% |
| Cypriot | 294 | 0.0% |
| Czech | 89,038 | 0.7% |
| Czechoslovakian | 13,447 | 0.1% |
| Danish | 40,238 | 0.3% |
| Delaware | 154 | 0.0% |
| Dominican | 9,311 | 0.1% |
| Dutch | 132,602 | 1.0% |
| Dutch West Indian | 189 | 0.0% |
| Eastern European | 42,088 | 0.3% |
| Ecuadorian | 32,118 | 0.3% |
| Egyptian | 8,530 | 0.1% |
| English | 809,227 | 6.3% |
| Estonian | 1,053 | 0.0% |
| Ethiopian | 7,374 | 0.1% |
| European | 166,231 | 1.3% |
| Fijian | 114 | 0.0% |
| Filipino | 7,530 | 0.1% |
| Finnish | 14,662 | 0.1% |
| French | 190,928 | 1.5% |
| French American Indian | 381 | 0.0% |
| French Canadian | 29,823 | 0.2% |
| German | 2,105,378 | 16.5% |
| German Russian | 440 | 0.0% |
| Ghanaian | 6,552 | 0.1% |
| Greek | 86,493 | 0.7% |
| Guamanian / Chamorro | 1,556 | 0.0% |
| Guatemalan | 43,359 | 0.3% |
| Guyanese | 1,464 | 0.0% |
| Haitian | 10,223 | 0.1% |
| Hmong | 82 | 0.0% |
| Honduran | 17,241 | 0.1% |
| Hopi | 64 | 0.0% |
| Houma | 30 | 0.0% |
| Hungarian | 41,469 | 0.3% |
| Icelander | 820 | 0.0% |
| Indian (Asian) | 156,207 | 1.2% |
| Indonesian | 7,613 | 0.1% |
| Inupiat | 407 | 0.0% |
| Iranian | 11,241 | 0.1% |
| Iraqi | 7,689 | 0.1% |
| Irish | 1,370,654 | 10.7% |
| Iroquois | 1,502 | 0.0% |
| Israeli | 3,799 | 0.0% |
| Italian | 701,382 | 5.5% |
| Jamaican | 15,157 | 0.1% |
| Japanese | 5,545 | 0.0% |
| Jordanian | 10,181 | 0.1% |
| Kenyan | 1,475 | 0.0% |
| Kiowa | 134 | 0.0% |
| Korean | 169,520 | 1.3% |
| Laotian | 2,678 | 0.0% |
| Latvian | 4,912 | 0.0% |
| Lebanese | 12,364 | 0.1% |
| Liberian | 710 | 0.0% |
| Lithuanian | 72,255 | 0.6% |
| Lumbee | 234 | 0.0% |
| Luxembourger | 5,303 | 0.0% |
| Macedonian | 6,790 | 0.1% |
| Malaysian | 6,988 | 0.1% |
| Maltese | 815 | 0.0% |
| Menominee | 576 | 0.0% |
| Mexican | 1,764,985 | 13.8% |
| Mexican American Indian | 37,033 | 0.3% |
| Mongolian | 1,708 | 0.0% |
| Moroccan | 4,941 | 0.0% |
| Native Hawaiian | 6,475 | 0.1% |
| Navajo | 2,424 | 0.0% |
| Nepalese | 32 | 0.0% |
| New Zealander | 406 | 0.0% |
| Nicaraguan | 4,025 | 0.0% |
| Nigerian | 28,390 | 0.2% |
| Northern European | 14,172 | 0.1% |
| Norwegian | 137,403 | 1.1% |
| Okinawan | 407 | 0.0% |
| Osage | 179 | 0.0% |
| Ottawa | 209 | 0.0% |
| Paiute | 172 | 0.0% |
| Pakistani | 13,638 | 0.1% |
| Palestinian | 19,440 | 0.2% |
| Panamanian | 3,537 | 0.0% |
| Paraguayan | 290 | 0.0% |
| Pennsylvania German | 3,317 | 0.0% |
| Peruvian | 13,798 | 0.1% |
| Pima | 95 | 0.0% |
| Polish | 807,077 | 6.3% |
| Portuguese | 11,442 | 0.1% |
| Potawatomi | 623 | 0.0% |
| Pueblo | 237 | 0.0% |
| Puerto Rican | 208,914 | 1.6% |
| Puget Sound Salish | 97 | 0.0% |
| Romanian | 34,093 | 0.3% |
| Russian | 98,986 | 0.8% |
| Salvadoran | 20,235 | 0.2% |
| Samoan | 2,221 | 0.0% |
| Scandinavian | 27,933 | 0.2% |
| Scotch-Irish | 66,377 | 0.5% |
| Scottish | 141,071 | 1.1% |
| Seminole | 182 | 0.0% |
| Senegalese | 768 | 0.0% |
| Serbian | 25,407 | 0.2% |
| Shoshone | 138 | 0.0% |
| Sierra Leonean | 227 | 0.0% |
| Sioux | 2,675 | 0.0% |
| Slavic | 5,193 | 0.0% |
| Slovak | 31,271 | 0.3% |
| Slovene | 12,270 | 0.1% |
| Somali | 1,637 | 0.0% |
| South African | 2,068 | 0.0% |
| South American | 102,476 | 0.8% |
| South American Indian | 1,866 | 0.0% |
| Soviet Union | 188 | 0.0% |
| Spaniard | 19,943 | 0.2% |
| Spanish | 12,704 | 0.1% |
| Spanish American | 379 | 0.0% |
| Spanish American Indian | 77 | 0.0% |
| Sri Lankan | 37,590 | 0.3% |
| Subsaharan African | 134,278 | 1.1% |
| Sudanese | 2,136 | 0.0% |
| Swedish | 226,157 | 1.8% |
| Swiss | 32,645 | 0.3% |
| Syrian | 6,761 | 0.1% |
| Taiwanese | 482 | 0.0% |
| Thai | 274,428 | 2.1% |
| Tlingit-Haida | 63 | 0.0% |
| Tohono O'Odham | 57 | 0.0% |
| Tongan | 322 | 0.0% |
| Trinidadian and Tobagonian | 1,471 | 0.0% |
| Tsimshian | 8 | 0.0% |
| Turkish | 7,638 | 0.1% |
| U.S. Virgin Islander | 175 | 0.0% |
| Ugandan | 573 | 0.0% |
| Ukrainian | 55,040 | 0.4% |
| Uruguayan | 1,057 | 0.0% |
| Ute | 58 | 0.0% |
| Venezuelan | 11,906 | 0.1% |
| Vietnamese | 2,849 | 0.0% |
| Welsh | 45,769 | 0.4% |
| West Indian | 3,326 | 0.0% |
| Yakama | 18 | 0.0% |
| Yaqui | 324 | 0.0% |
| Yugoslavian | 16,898 | 0.1% |
| Yuman | 37 | 0.0% |
| Yup'ik | 29 | 0.0% |
| Zimbabwean | 439 | 0.0% | View All 199 Rows |
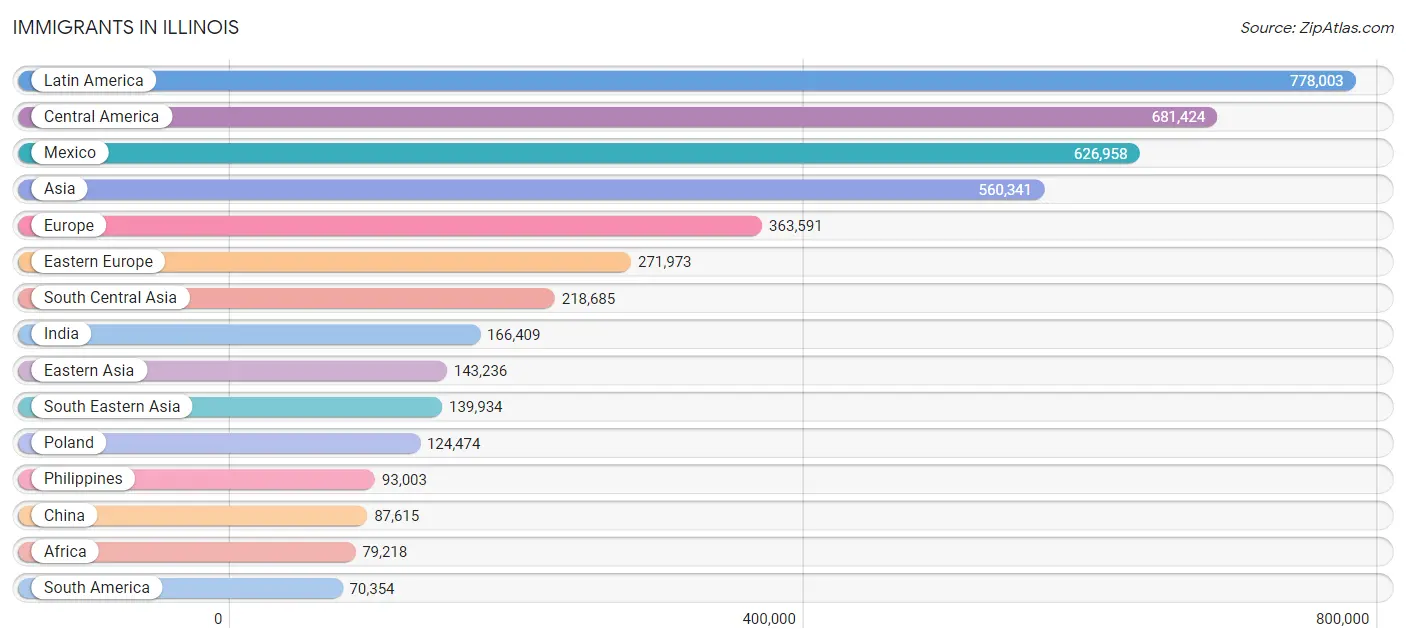
Immigrants in Illinois
The most numerous immigrant groups reported in Illinois came from Latin America (778,003 | 6.1%), Central America (681,424 | 5.3%), Mexico (626,958 | 4.9%), Asia (560,341 | 4.4%), and Europe (363,591 | 2.9%), together accounting for 23.6% of all Illinois residents.
| Immigration Origin | # Population | % Population |
| Afghanistan | 1,312 | 0.0% |
| Africa | 79,218 | 0.6% |
| Albania | 6,488 | 0.1% |
| Argentina | 3,955 | 0.0% |
| Armenia | 734 | 0.0% |
| Asia | 560,341 | 4.4% |
| Australia | 2,458 | 0.0% |
| Austria | 2,376 | 0.0% |
| Azores | 27 | 0.0% |
| Bahamas | 334 | 0.0% |
| Bangladesh | 2,731 | 0.0% |
| Barbados | 422 | 0.0% |
| Belarus | 6,186 | 0.1% |
| Belgium | 775 | 0.0% |
| Belize | 4,639 | 0.0% |
| Bolivia | 1,913 | 0.0% |
| Bosnia and Herzegovina | 10,776 | 0.1% |
| Brazil | 8,778 | 0.1% |
| Bulgaria | 14,165 | 0.1% |
| Cabo Verde | 12 | 0.0% |
| Cambodia | 3,065 | 0.0% |
| Cameroon | 1,856 | 0.0% |
| Canada | 19,306 | 0.2% |
| Caribbean | 26,225 | 0.2% |
| Central America | 681,424 | 5.3% |
| Chile | 2,291 | 0.0% |
| China | 87,615 | 0.7% |
| Colombia | 16,553 | 0.1% |
| Congo | 1,142 | 0.0% |
| Costa Rica | 1,305 | 0.0% |
| Croatia | 3,977 | 0.0% |
| Cuba | 7,171 | 0.1% |
| Czechoslovakia | 4,741 | 0.0% |
| Denmark | 676 | 0.0% |
| Dominica | 66 | 0.0% |
| Dominican Republic | 3,867 | 0.0% |
| Eastern Africa | 14,488 | 0.1% |
| Eastern Asia | 143,236 | 1.1% |
| Eastern Europe | 271,973 | 2.1% |
| Ecuador | 16,844 | 0.1% |
| Egypt | 5,762 | 0.1% |
| El Salvador | 11,009 | 0.1% |
| England | 8,551 | 0.1% |
| Eritrea | 735 | 0.0% |
| Ethiopia | 4,775 | 0.0% |
| Europe | 363,591 | 2.9% |
| Fiji | 267 | 0.0% |
| France | 5,895 | 0.1% |
| Germany | 18,753 | 0.2% |
| Ghana | 7,043 | 0.1% |
| Greece | 10,720 | 0.1% |
| Grenada | 91 | 0.0% |
| Guatemala | 22,793 | 0.2% |
| Guyana | 1,178 | 0.0% |
| Haiti | 4,533 | 0.0% |
| Honduras | 10,762 | 0.1% |
| Hong Kong | 5,016 | 0.0% |
| Hungary | 1,432 | 0.0% |
| India | 166,409 | 1.3% |
| Indonesia | 1,780 | 0.0% |
| Iran | 6,922 | 0.1% |
| Iraq | 13,214 | 0.1% |
| Ireland | 6,611 | 0.1% |
| Israel | 4,177 | 0.0% |
| Italy | 15,679 | 0.1% |
| Jamaica | 8,168 | 0.1% |
| Japan | 10,943 | 0.1% |
| Jordan | 8,827 | 0.1% |
| Kazakhstan | 2,070 | 0.0% |
| Kenya | 2,357 | 0.0% |
| Korea | 40,393 | 0.3% |
| Kuwait | 1,630 | 0.0% |
| Laos | 3,512 | 0.0% |
| Latin America | 778,003 | 6.1% |
| Latvia | 1,568 | 0.0% |
| Lebanon | 3,080 | 0.0% |
| Liberia | 615 | 0.0% |
| Lithuania | 10,249 | 0.1% |
| Malaysia | 3,256 | 0.0% |
| Mexico | 626,958 | 4.9% |
| Micronesia | 187 | 0.0% |
| Middle Africa | 7,830 | 0.1% |
| Moldova | 4,938 | 0.0% |
| Morocco | 3,781 | 0.0% |
| Nepal | 3,231 | 0.0% |
| Netherlands | 2,017 | 0.0% |
| Nicaragua | 1,954 | 0.0% |
| Nigeria | 21,186 | 0.2% |
| North Macedonia | 4,211 | 0.0% |
| Northern Africa | 14,035 | 0.1% |
| Northern Europe | 29,158 | 0.2% |
| Norway | 679 | 0.0% |
| Oceania | 4,079 | 0.0% |
| Pakistan | 29,519 | 0.2% |
| Panama | 1,902 | 0.0% |
| Peru | 8,161 | 0.1% |
| Philippines | 93,003 | 0.7% |
| Poland | 124,474 | 1.0% |
| Portugal | 541 | 0.0% |
| Romania | 14,736 | 0.1% |
| Russia | 16,308 | 0.1% |
| Saudi Arabia | 3,363 | 0.0% |
| Scotland | 1,361 | 0.0% |
| Senegal | 893 | 0.0% |
| Serbia | 8,574 | 0.1% |
| Sierra Leone | 335 | 0.0% |
| Singapore | 1,168 | 0.0% |
| Somalia | 982 | 0.0% |
| South Africa | 2,988 | 0.0% |
| South America | 70,354 | 0.5% |
| South Central Asia | 218,685 | 1.7% |
| South Eastern Asia | 139,934 | 1.1% |
| Southern Europe | 29,848 | 0.2% |
| Spain | 2,861 | 0.0% |
| Sri Lanka | 1,403 | 0.0% |
| St. Vincent and the Grenadines | 72 | 0.0% |
| Sudan | 1,047 | 0.0% |
| Sweden | 1,187 | 0.0% |
| Switzerland | 910 | 0.0% |
| Syria | 6,781 | 0.1% |
| Taiwan | 8,235 | 0.1% |
| Thailand | 7,323 | 0.1% |
| Trinidad and Tobago | 1,224 | 0.0% |
| Turkey | 4,823 | 0.0% |
| Uganda | 1,043 | 0.0% |
| Ukraine | 29,316 | 0.2% |
| Uruguay | 589 | 0.0% |
| Uzbekistan | 2,017 | 0.0% |
| Venezuela | 9,688 | 0.1% |
| Vietnam | 22,269 | 0.2% |
| West Indies | 114 | 0.0% |
| Western Africa | 34,412 | 0.3% |
| Western Asia | 51,369 | 0.4% |
| Western Europe | 30,750 | 0.2% |
| Yemen | 1,771 | 0.0% |
| Zaire | 4,414 | 0.0% |
| Zimbabwe | 494 | 0.0% | View All 137 Rows |
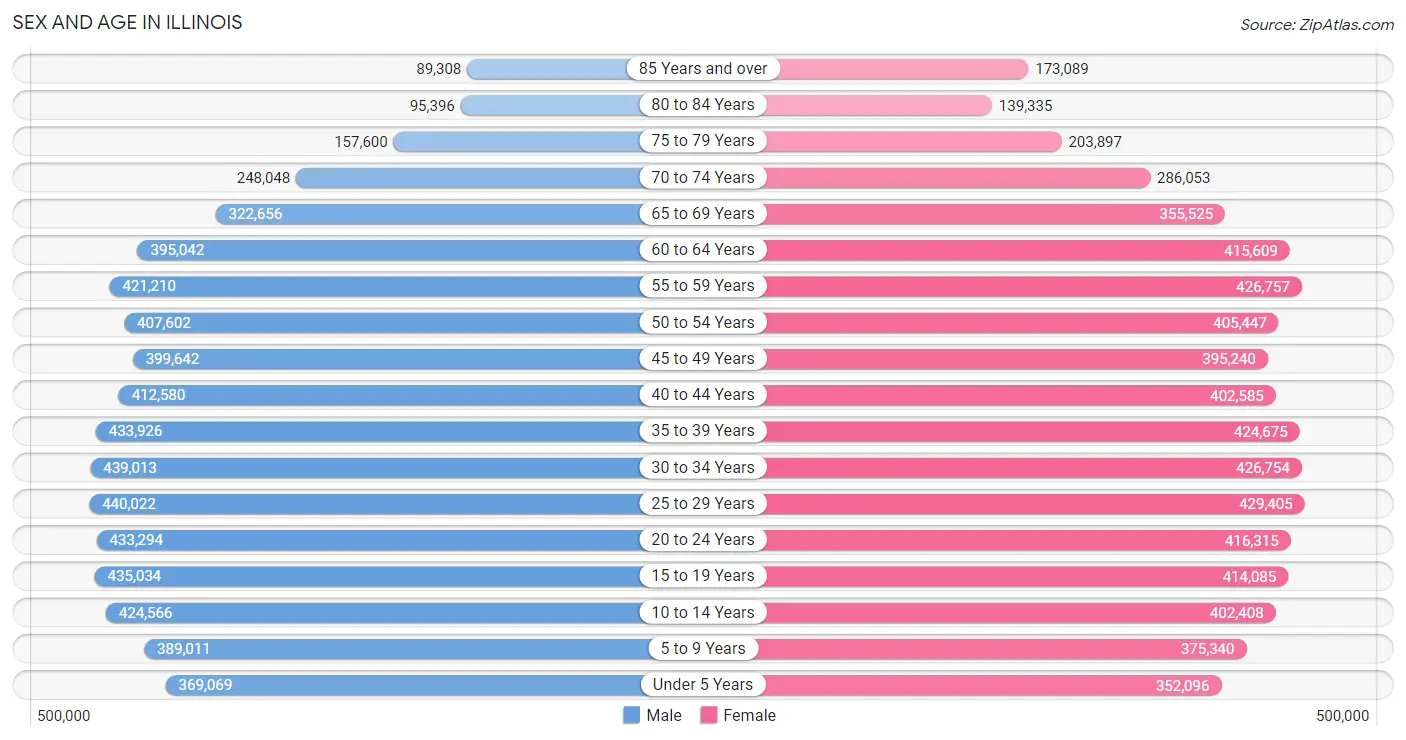
Sex and Age in Illinois
Sex and Age in Illinois
The most populous age groups in Illinois are 25 to 29 Years (440,022 | 7.0%) for men and 25 to 29 Years (429,405 | 6.7%) for women.
| Age Bracket | Male | Female |
| Under 5 Years | 369,069 (5.9%) | 352,096 (5.5%) |
| 5 to 9 Years | 389,011 (6.2%) | 375,340 (5.8%) |
| 10 to 14 Years | 424,566 (6.7%) | 402,408 (6.2%) |
| 15 to 19 Years | 435,034 (6.9%) | 414,085 (6.4%) |
| 20 to 24 Years | 433,294 (6.9%) | 416,315 (6.5%) |
| 25 to 29 Years | 440,022 (7.0%) | 429,405 (6.7%) |
| 30 to 34 Years | 439,013 (7.0%) | 426,754 (6.6%) |
| 35 to 39 Years | 433,926 (6.9%) | 424,675 (6.6%) |
| 40 to 44 Years | 412,580 (6.5%) | 402,585 (6.2%) |
| 45 to 49 Years | 399,642 (6.3%) | 395,240 (6.1%) |
| 50 to 54 Years | 407,602 (6.5%) | 405,447 (6.3%) |
| 55 to 59 Years | 421,210 (6.7%) | 426,757 (6.6%) |
| 60 to 64 Years | 395,042 (6.3%) | 415,609 (6.5%) |
| 65 to 69 Years | 322,656 (5.1%) | 355,525 (5.5%) |
| 70 to 74 Years | 248,048 (3.9%) | 286,053 (4.4%) |
| 75 to 79 Years | 157,600 (2.5%) | 203,897 (3.2%) |
| 80 to 84 Years | 95,396 (1.5%) | 139,335 (2.2%) |
| 85 Years and over | 89,308 (1.4%) | 173,089 (2.7%) |
| Total | 6,313,019 (100.0%) | 6,444,615 (100.0%) |
Families and Households in Illinois
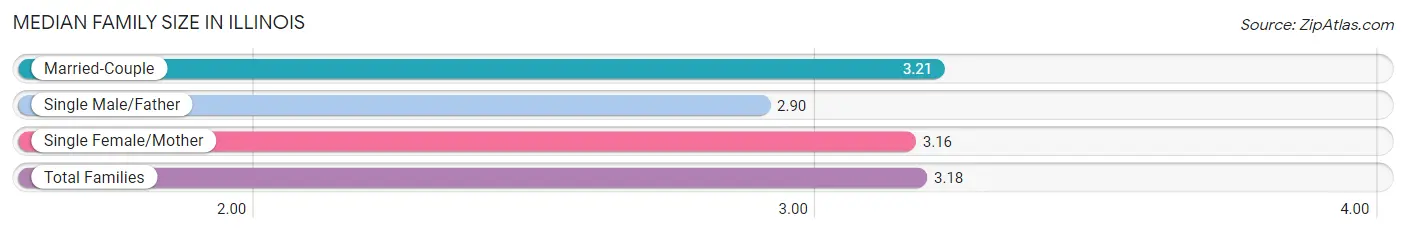
Median Family Size in Illinois
The median family size in Illinois is 3.18 persons per family, with married-couple families (2,301,882 | 73.5%) accounting for the largest median family size of 3.21 persons per family. On the other hand, single male/father families (236,088 | 7.5%) represent the smallest median family size with 2.90 persons per family.
| Family Type | # Families | Family Size |
| Married-Couple | 2,301,882 (73.5%) | 3.21 |
| Single Male/Father | 236,088 (7.5%) | 2.90 |
| Single Female/Mother | 596,133 (19.0%) | 3.16 |
| Total Families | 3,134,103 (100.0%) | 3.18 |
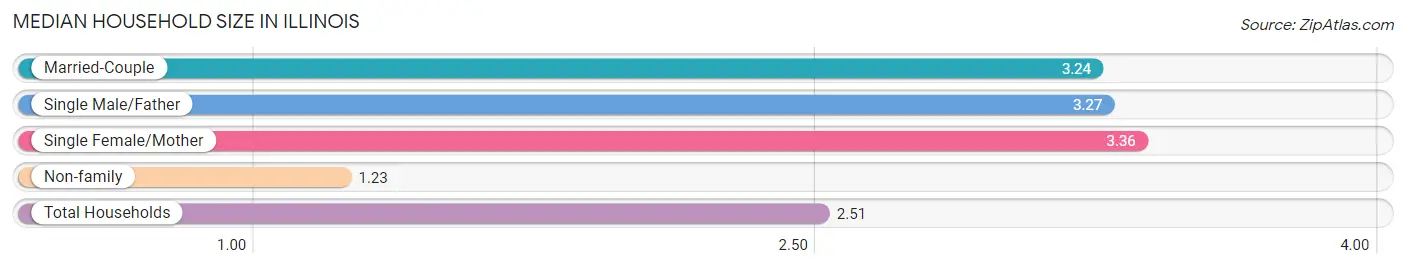
Median Household Size in Illinois
The median household size in Illinois is 2.51 persons per household, with single female/mother households (596,133 | 12.0%) accounting for the largest median household size of 3.36 persons per household. non-family households (1,834,658 | 36.9%) represent the smallest median household size with 1.23 persons per household.
| Household Type | # Households | Household Size |
| Married-Couple | 2,301,882 (46.3%) | 3.24 |
| Single Male/Father | 236,088 (4.8%) | 3.27 |
| Single Female/Mother | 596,133 (12.0%) | 3.36 |
| Non-family | 1,834,658 (36.9%) | 1.23 |
| Total Households | 4,968,761 (100.0%) | 2.51 |
Household Size by Marriage Status in Illinois
Out of a total of 4,968,761 households in Illinois, 3,134,103 (63.1%) are family households, while 1,834,658 (36.9%) are nonfamily households. The most numerous type of family households are 2-person households, comprising 1,339,569, and the most common type of nonfamily households are 1-person households, comprising 1,510,982.
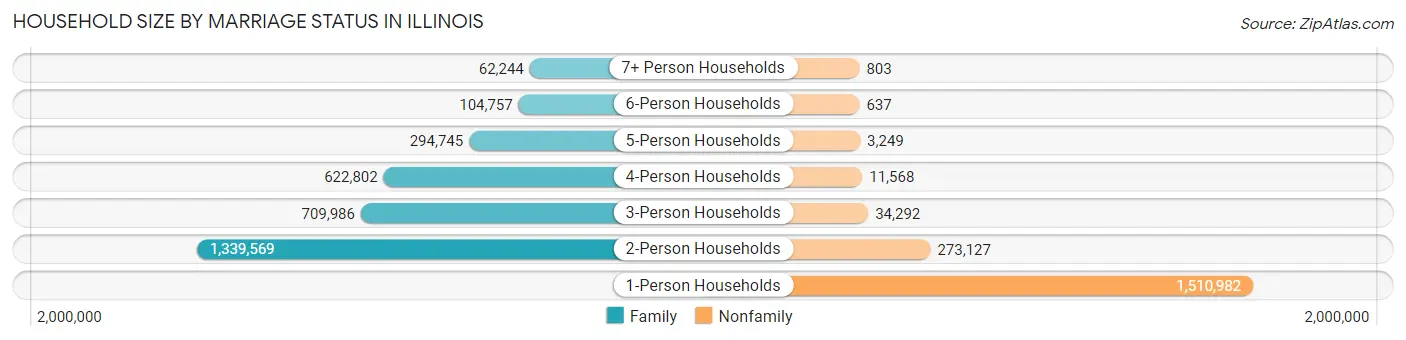
| Household Size | Family Households | Nonfamily Households |
| 1-Person Households | - | 1,510,982 (30.4%) |
| 2-Person Households | 1,339,569 (27.0%) | 273,127 (5.5%) |
| 3-Person Households | 709,986 (14.3%) | 34,292 (0.7%) |
| 4-Person Households | 622,802 (12.5%) | 11,568 (0.2%) |
| 5-Person Households | 294,745 (5.9%) | 3,249 (0.1%) |
| 6-Person Households | 104,757 (2.1%) | 637 (0.0%) |
| 7+ Person Households | 62,244 (1.3%) | 803 (0.0%) |
| Total | 3,134,103 (63.1%) | 1,834,658 (36.9%) |
Female Fertility in Illinois
Fertility by Age in Illinois
Average fertility rate in Illinois is 51.0 births per 1,000 women. Women in the age bracket of 20 to 34 years have the highest fertility rate with 83.0 births per 1,000 women. Women in the age bracket of 20 to 34 years acount for 69.2% of all women with births.
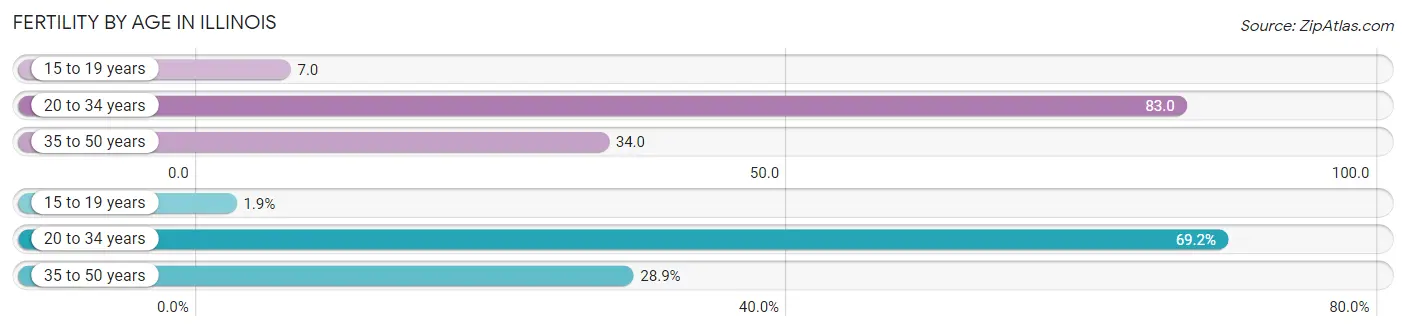
| Age Bracket | Women with Births | Births / 1,000 Women |
| 15 to 19 years | 2,948 (1.9%) | 7.0 |
| 20 to 34 years | 105,760 (69.2%) | 83.0 |
| 35 to 50 years | 44,117 (28.9%) | 34.0 |
| Total | 152,825 (100.0%) | 51.0 |
Fertility by Age by Marriage Status in Illinois
67.8% of women with births (152,825) in Illinois are married. The highest percentage of unmarried women with births falls into 15 to 19 years age bracket with 92.1% of them unmarried at the time of birth, while the lowest percentage of unmarried women with births belong to 35 to 50 years age bracket with 19.2% of them unmarried.
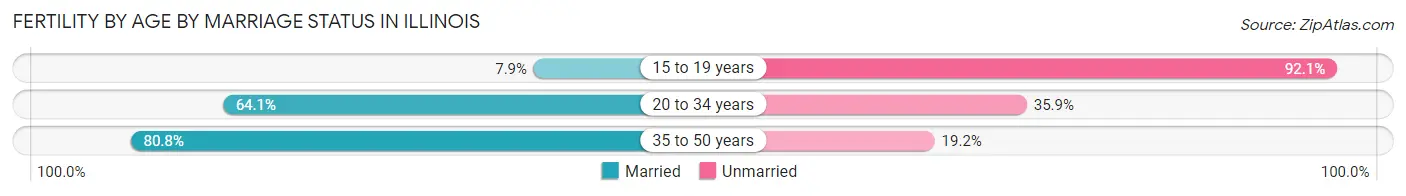
| Age Bracket | Married | Unmarried |
| 15 to 19 years | 233 (7.9%) | 2,715 (92.1%) |
| 20 to 34 years | 67,792 (64.1%) | 37,968 (35.9%) |
| 35 to 50 years | 35,647 (80.8%) | 8,470 (19.2%) |
| Total | 103,615 (67.8%) | 49,210 (32.2%) |
Fertility by Education in Illinois
Average fertility rate in Illinois is 51.0 births per 1,000 women. Women with the education attainment of graduate degree have the highest fertility rate of 66.0 births per 1,000 women, while women with the education attainment of less than high school have the lowest fertility at 29.0 births per 1,000 women. Women with the education attainment of college or associate's degree represent 28.1% of all women with births.
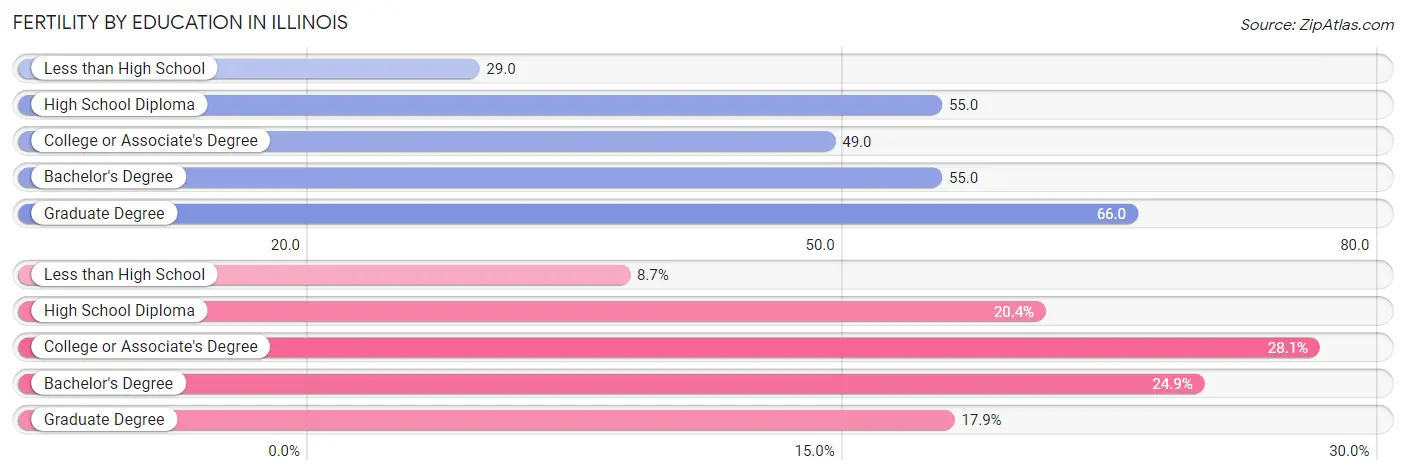
| Educational Attainment | Women with Births | Births / 1,000 Women |
| Less than High School | 13,342 (8.7%) | 29.0 |
| High School Diploma | 31,202 (20.4%) | 55.0 |
| College or Associate's Degree | 42,974 (28.1%) | 49.0 |
| Bachelor's Degree | 38,030 (24.9%) | 55.0 |
| Graduate Degree | 27,277 (17.8%) | 66.0 |
| Total | 152,825 (100.0%) | 51.0 |
Fertility by Education by Marriage Status in Illinois
32.2% of women with births in Illinois are unmarried. Women with the educational attainment of graduate degree are most likely to be married with 92.7% of them married at childbirth, while women with the educational attainment of high school diploma are least likely to be married with 54.7% of them unmarried at childbirth.
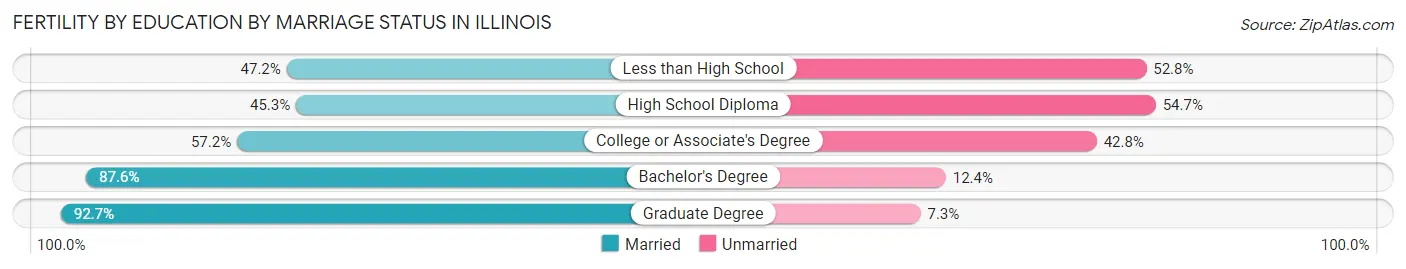
| Educational Attainment | Married | Unmarried |
| Less than High School | 6,297 (47.2%) | 7,045 (52.8%) |
| High School Diploma | 14,135 (45.3%) | 17,067 (54.7%) |
| College or Associate's Degree | 24,581 (57.2%) | 18,393 (42.8%) |
| Bachelor's Degree | 33,314 (87.6%) | 4,716 (12.4%) |
| Graduate Degree | 25,286 (92.7%) | 1,991 (7.3%) |
| Total | 103,615 (67.8%) | 49,210 (32.2%) |
Employment Characteristics in Illinois
Employment by Class of Employer in Illinois
Among the 6,171,891 employed individuals in Illinois, private company employees (4,261,726 | 69.1%), not-for-profit organizations (572,895 | 9.3%), and local government employees (454,860 | 7.4%) make up the most common classes of employment.
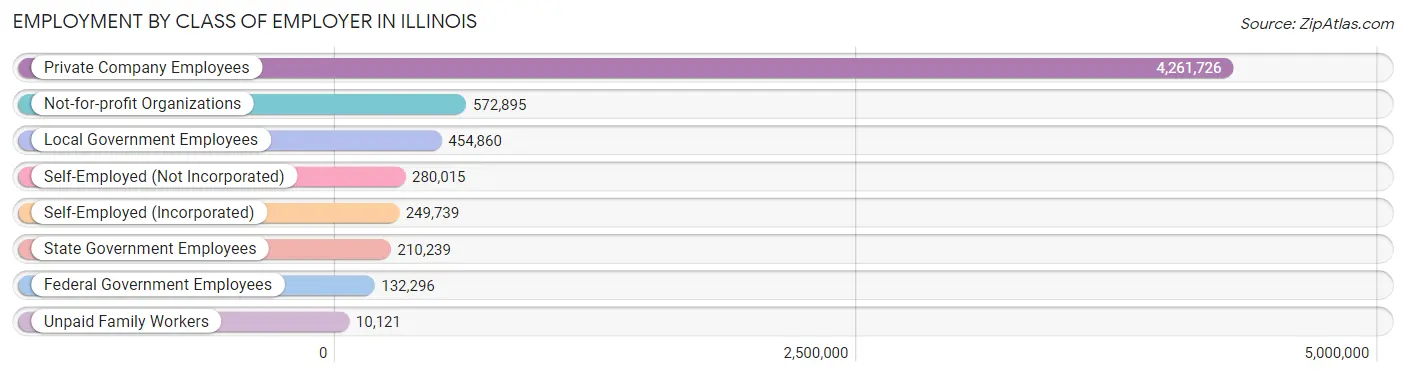
| Employer Class | # Employees | % Employees |
| Private Company Employees | 4,261,726 | 69.1% |
| Self-Employed (Incorporated) | 249,739 | 4.1% |
| Self-Employed (Not Incorporated) | 280,015 | 4.5% |
| Not-for-profit Organizations | 572,895 | 9.3% |
| Local Government Employees | 454,860 | 7.4% |
| State Government Employees | 210,239 | 3.4% |
| Federal Government Employees | 132,296 | 2.1% |
| Unpaid Family Workers | 10,121 | 0.2% |
| Total | 6,171,891 | 100.0% |
Employment Status by Age in Illinois
According to the labor force statistics for Illinois, out of the total population over 16 years of age (10,274,014), 65.2% or 6,698,657 individuals are in the labor force, with 6.0% or 401,919 of them unemployed. The age group with the highest labor force participation rate is 30 to 34 years, with 85.8% or 742,828 individuals in the labor force. Within the labor force, the 16 to 19 years age range has the highest percentage of unemployed individuals, with 15.9% or 44,306 of them being unemployed.
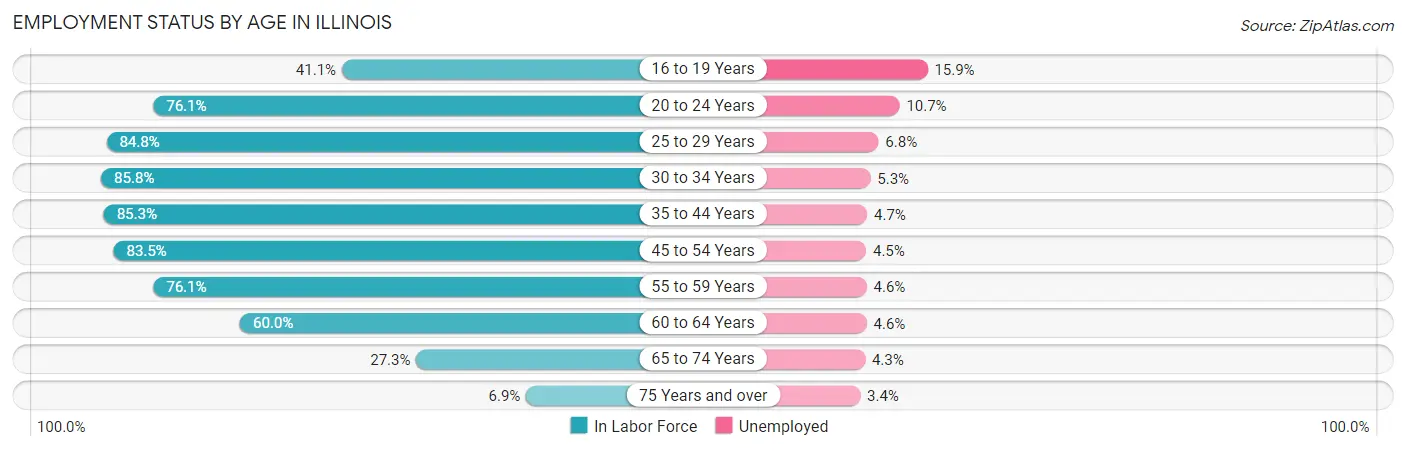
| Age Bracket | In Labor Force | Unemployed |
| 16 to 19 Years | 278,653 (41.1%) | 44,306 (15.9%) |
| 20 to 24 Years | 646,552 (76.1%) | 69,181 (10.7%) |
| 25 to 29 Years | 737,274 (84.8%) | 50,135 (6.8%) |
| 30 to 34 Years | 742,828 (85.8%) | 39,370 (5.3%) |
| 35 to 44 Years | 1,427,722 (85.3%) | 67,103 (4.7%) |
| 45 to 54 Years | 1,342,622 (83.5%) | 60,418 (4.5%) |
| 55 to 59 Years | 645,303 (76.1%) | 29,684 (4.6%) |
| 60 to 64 Years | 486,391 (60.0%) | 22,374 (4.6%) |
| 65 to 74 Years | 330,953 (27.3%) | 14,231 (4.3%) |
| 75 Years and over | 59,245 (6.9%) | 2,014 (3.4%) |
| Total | 6,698,657 (65.2%) | 401,919 (6.0%) |
Employment Status by Educational Attainment in Illinois
According to labor force statistics for Illinois, 80.6% of individuals (5,380,460) out of the total population between 25 and 64 years of age (6,675,509) are in the labor force, with 5.0% or 269,023 of them being unemployed. The group with the highest labor force participation rate are those with the educational attainment of bachelor's degree or higher, with 88.3% or 2,304,792 individuals in the labor force. Within the labor force, individuals with less than high school education have the highest percentage of unemployment, with 9.0% or 33,988 of them being unemployed.
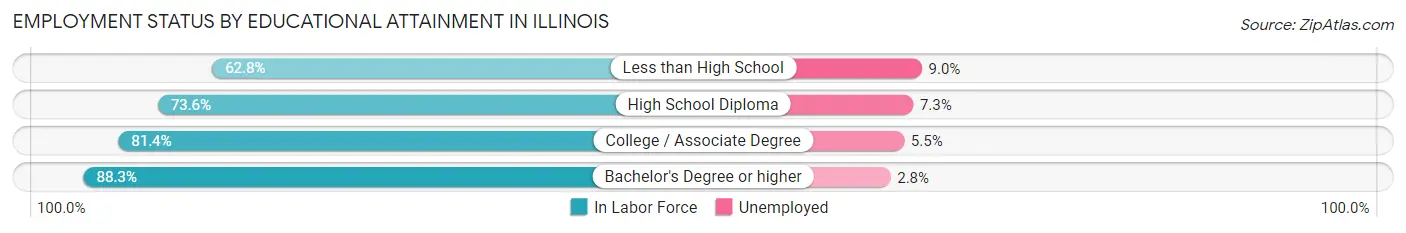
| Educational Attainment | In Labor Force | Unemployed |
| Less than High School | 377,649 (62.8%) | 54,122 (9.0%) |
| High School Diploma | 1,149,738 (73.6%) | 114,037 (7.3%) |
| College / Associate Degree | 1,548,089 (81.4%) | 104,601 (5.5%) |
| Bachelor's Degree or higher | 2,304,792 (88.3%) | 73,085 (2.8%) |
| Total | 5,380,460 (80.6%) | 333,775 (5.0%) |
Employment Occupations by Sex in Illinois
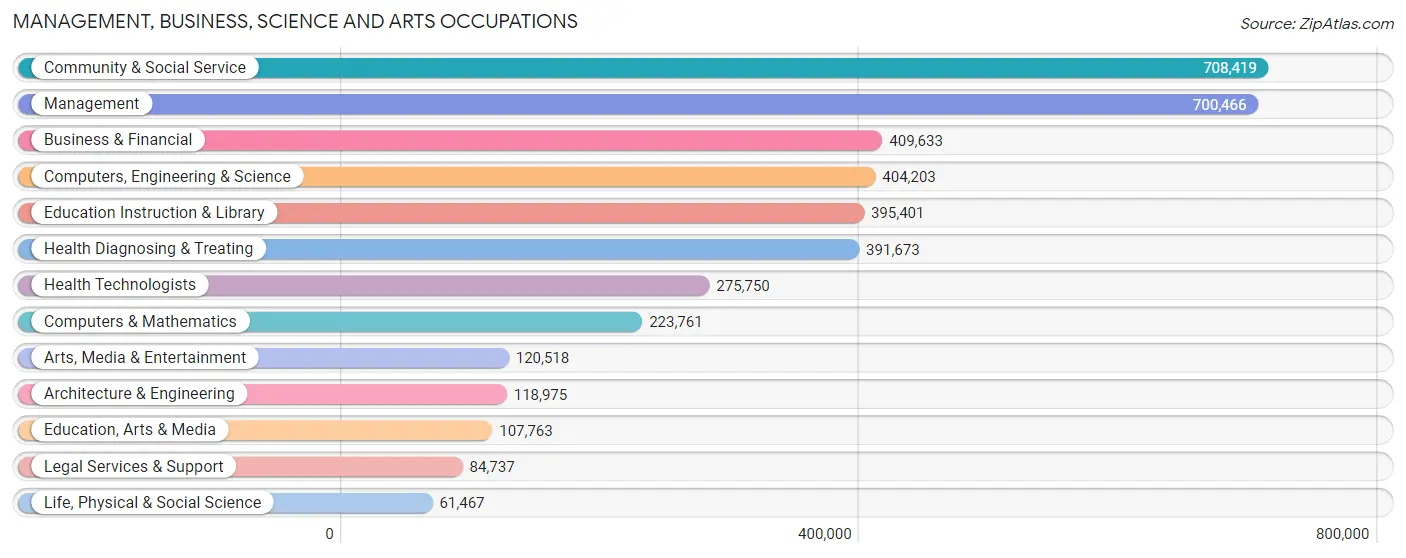
Management, Business, Science and Arts Occupations
The most common Management, Business, Science and Arts occupations in Illinois are Community & Social Service (708,419 | 11.3%), Management (700,466 | 11.2%), Business & Financial (409,633 | 6.5%), Computers, Engineering & Science (404,203 | 6.4%), and Education Instruction & Library (395,401 | 6.3%).
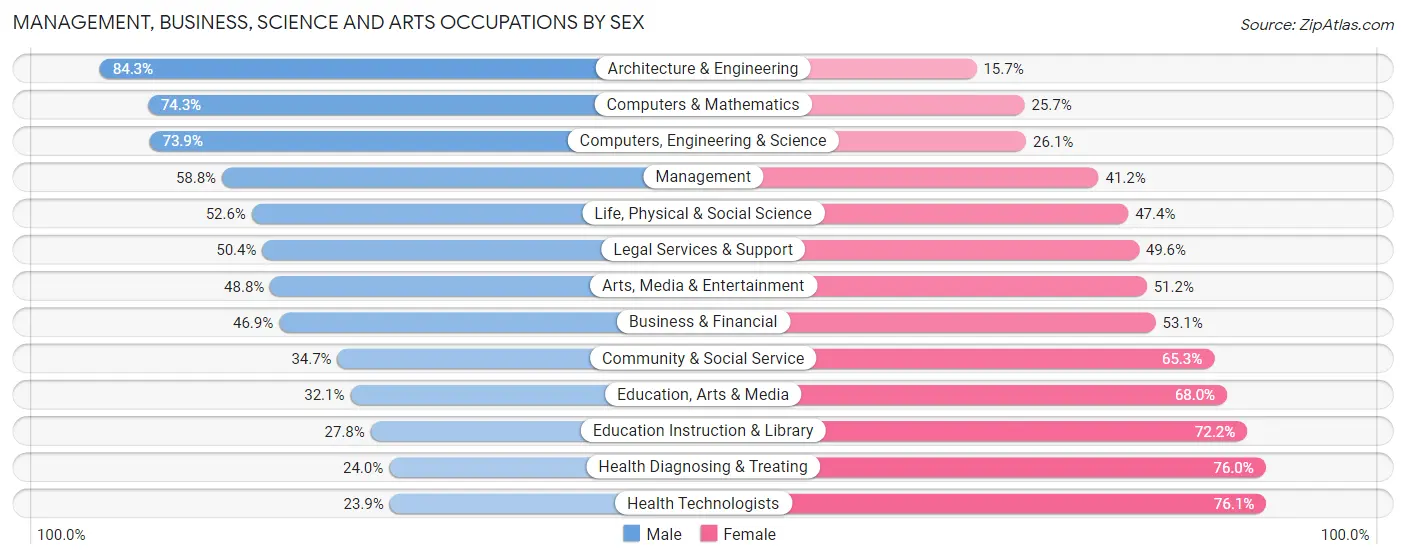
Management, Business, Science and Arts Occupations by Sex
Within the Management, Business, Science and Arts occupations in Illinois, the most male-oriented occupations are Architecture & Engineering (84.3%), Computers & Mathematics (74.3%), and Computers, Engineering & Science (73.9%), while the most female-oriented occupations are Health Technologists (76.1%), Health Diagnosing & Treating (76.0%), and Education Instruction & Library (72.2%).
| Occupation | Male | Female |
| Management | 412,073 (58.8%) | 288,393 (41.2%) |
| Business & Financial | 192,215 (46.9%) | 217,418 (53.1%) |
| Computers, Engineering & Science | 298,813 (73.9%) | 105,390 (26.1%) |
| Computers & Mathematics | 166,176 (74.3%) | 57,585 (25.7%) |
| Architecture & Engineering | 100,287 (84.3%) | 18,688 (15.7%) |
| Life, Physical & Social Science | 32,350 (52.6%) | 29,117 (47.4%) |
| Community & Social Service | 246,092 (34.7%) | 462,327 (65.3%) |
| Education, Arts & Media | 34,535 (32.1%) | 73,228 (67.9%) |
| Legal Services & Support | 42,721 (50.4%) | 42,016 (49.6%) |
| Education Instruction & Library | 110,065 (27.8%) | 285,336 (72.2%) |
| Arts, Media & Entertainment | 58,771 (48.8%) | 61,747 (51.2%) |
| Health Diagnosing & Treating | 93,918 (24.0%) | 297,755 (76.0%) |
| Health Technologists | 65,828 (23.9%) | 209,922 (76.1%) |
| Total (Category) | 1,243,111 (47.5%) | 1,371,283 (52.4%) |
| Total (Overall) | 3,302,947 (52.6%) | 2,977,500 (47.4%) |
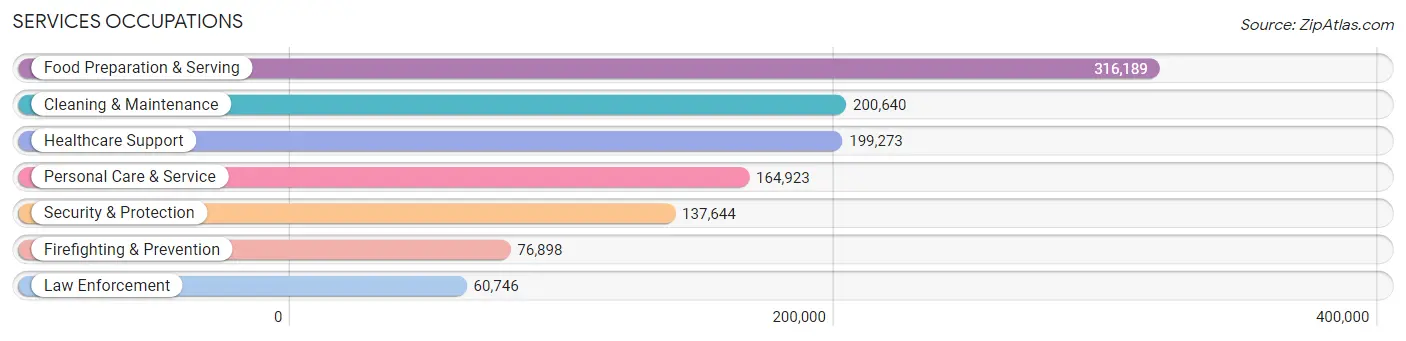
Services Occupations
The most common Services occupations in Illinois are Food Preparation & Serving (316,189 | 5.0%), Cleaning & Maintenance (200,640 | 3.2%), Healthcare Support (199,273 | 3.2%), Personal Care & Service (164,923 | 2.6%), and Security & Protection (137,644 | 2.2%).
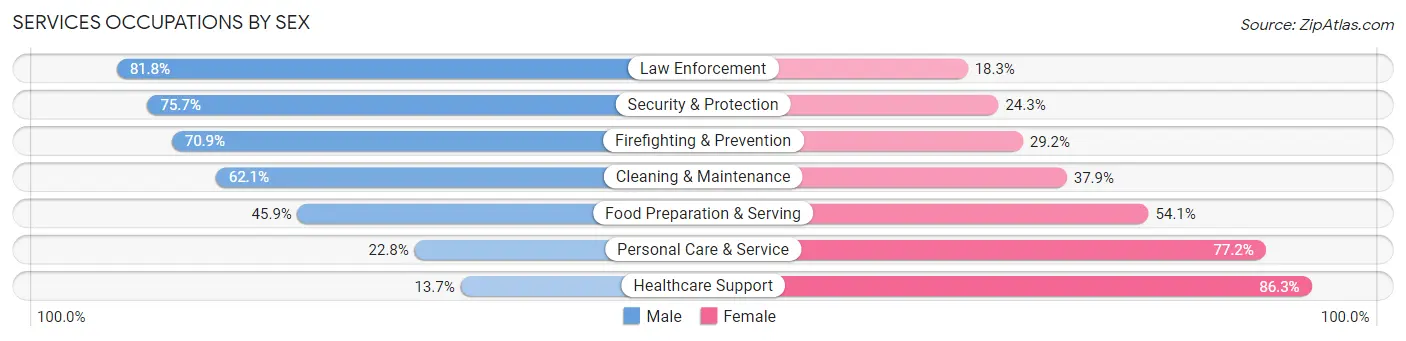
Services Occupations by Sex
Within the Services occupations in Illinois, the most male-oriented occupations are Law Enforcement (81.8%), Security & Protection (75.7%), and Firefighting & Prevention (70.9%), while the most female-oriented occupations are Healthcare Support (86.3%), Personal Care & Service (77.2%), and Food Preparation & Serving (54.1%).
| Occupation | Male | Female |
| Healthcare Support | 27,271 (13.7%) | 172,002 (86.3%) |
| Security & Protection | 104,138 (75.7%) | 33,506 (24.3%) |
| Firefighting & Prevention | 54,480 (70.9%) | 22,418 (29.1%) |
| Law Enforcement | 49,658 (81.8%) | 11,088 (18.2%) |
| Food Preparation & Serving | 145,216 (45.9%) | 170,973 (54.1%) |
| Cleaning & Maintenance | 124,649 (62.1%) | 75,991 (37.9%) |
| Personal Care & Service | 37,559 (22.8%) | 127,364 (77.2%) |
| Total (Category) | 438,833 (43.1%) | 579,836 (56.9%) |
| Total (Overall) | 3,302,947 (52.6%) | 2,977,500 (47.4%) |
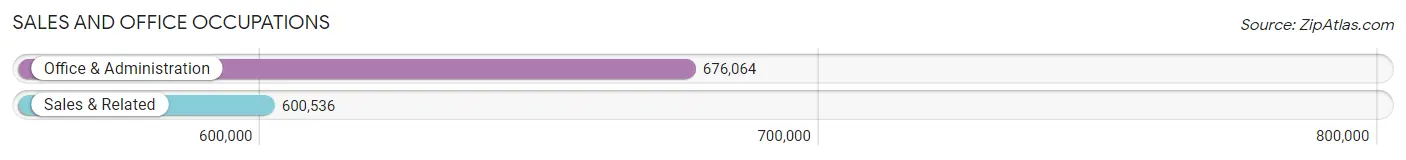
Sales and Office Occupations
The most common Sales and Office occupations in Illinois are Office & Administration (676,064 | 10.8%), and Sales & Related (600,536 | 9.6%).
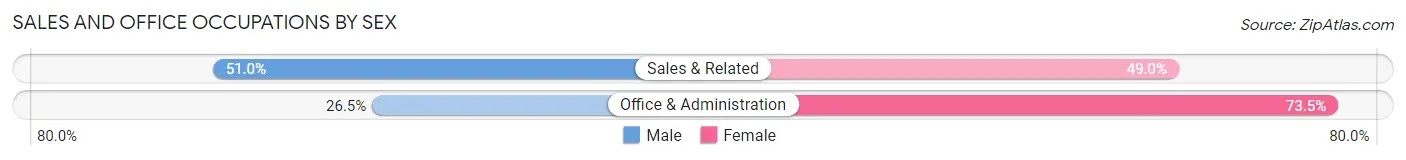
Sales and Office Occupations by Sex
| Occupation | Male | Female |
| Sales & Related | 306,493 (51.0%) | 294,043 (49.0%) |
| Office & Administration | 179,459 (26.5%) | 496,605 (73.5%) |
| Total (Category) | 485,952 (38.1%) | 790,648 (61.9%) |
| Total (Overall) | 3,302,947 (52.6%) | 2,977,500 (47.4%) |
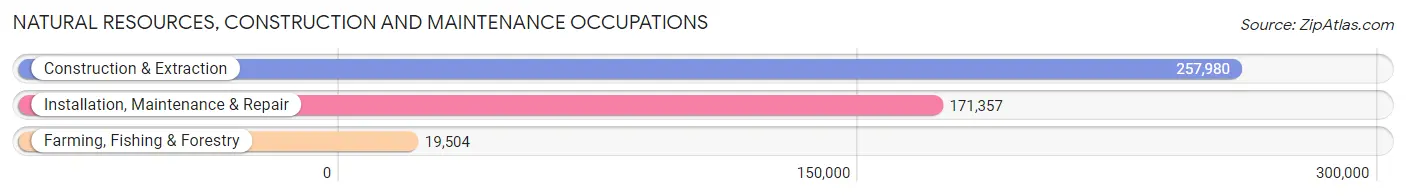
Natural Resources, Construction and Maintenance Occupations
The most common Natural Resources, Construction and Maintenance occupations in Illinois are Construction & Extraction (257,980 | 4.1%), Installation, Maintenance & Repair (171,357 | 2.7%), and Farming, Fishing & Forestry (19,504 | 0.3%).
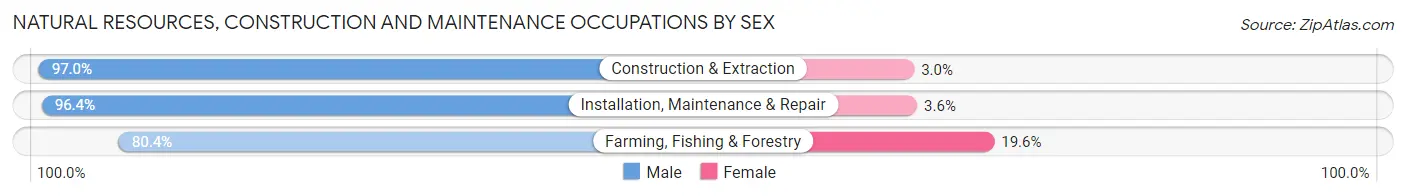
Natural Resources, Construction and Maintenance Occupations by Sex
| Occupation | Male | Female |
| Farming, Fishing & Forestry | 15,675 (80.4%) | 3,829 (19.6%) |
| Construction & Extraction | 250,315 (97.0%) | 7,665 (3.0%) |
| Installation, Maintenance & Repair | 165,209 (96.4%) | 6,148 (3.6%) |
| Total (Category) | 431,199 (96.1%) | 17,642 (3.9%) |
| Total (Overall) | 3,302,947 (52.6%) | 2,977,500 (47.4%) |
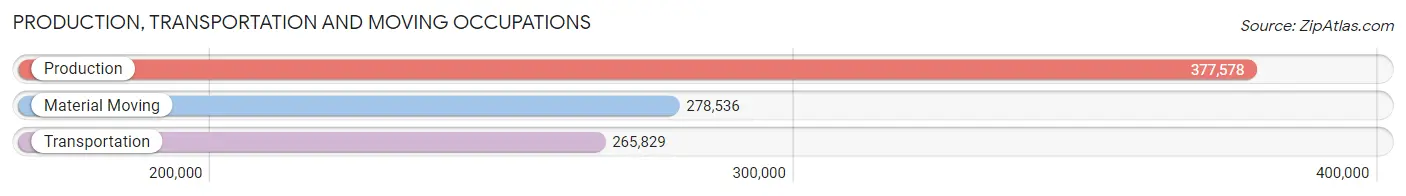
Production, Transportation and Moving Occupations
The most common Production, Transportation and Moving occupations in Illinois are Production (377,578 | 6.0%), Material Moving (278,536 | 4.4%), and Transportation (265,829 | 4.2%).
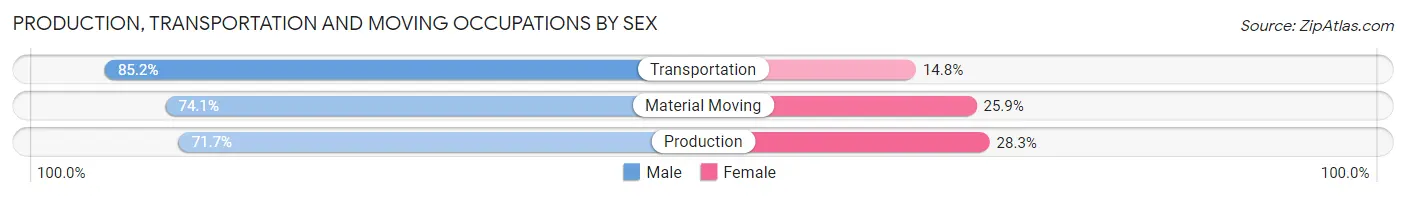
Production, Transportation and Moving Occupations by Sex
| Occupation | Male | Female |
| Production | 270,801 (71.7%) | 106,777 (28.3%) |
| Transportation | 226,585 (85.2%) | 39,244 (14.8%) |
| Material Moving | 206,466 (74.1%) | 72,070 (25.9%) |
| Total (Category) | 703,852 (76.3%) | 218,091 (23.7%) |
| Total (Overall) | 3,302,947 (52.6%) | 2,977,500 (47.4%) |
Employment Industries by Sex in Illinois
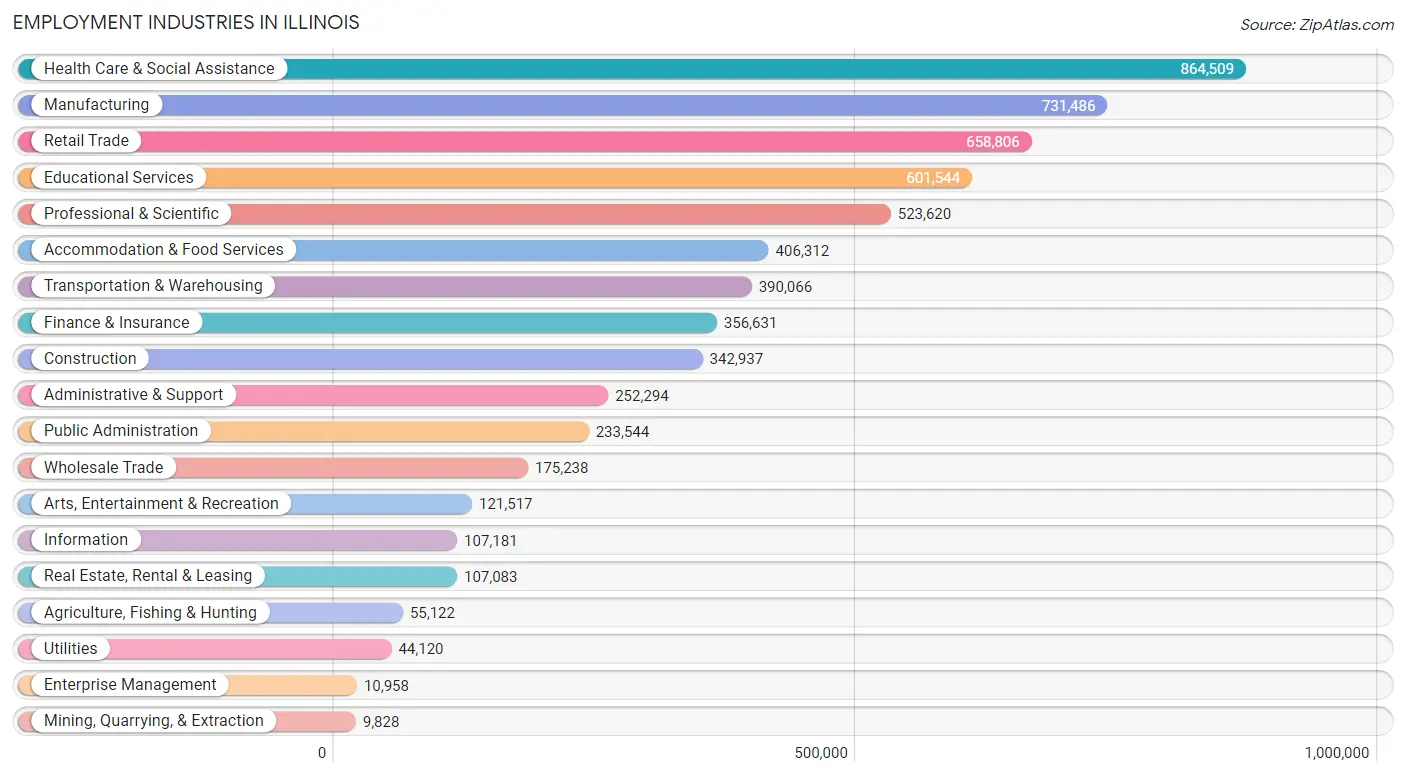
Employment Industries in Illinois
The major employment industries in Illinois include Health Care & Social Assistance (864,509 | 13.8%), Manufacturing (731,486 | 11.7%), Retail Trade (658,806 | 10.5%), Educational Services (601,544 | 9.6%), and Professional & Scientific (523,620 | 8.3%).
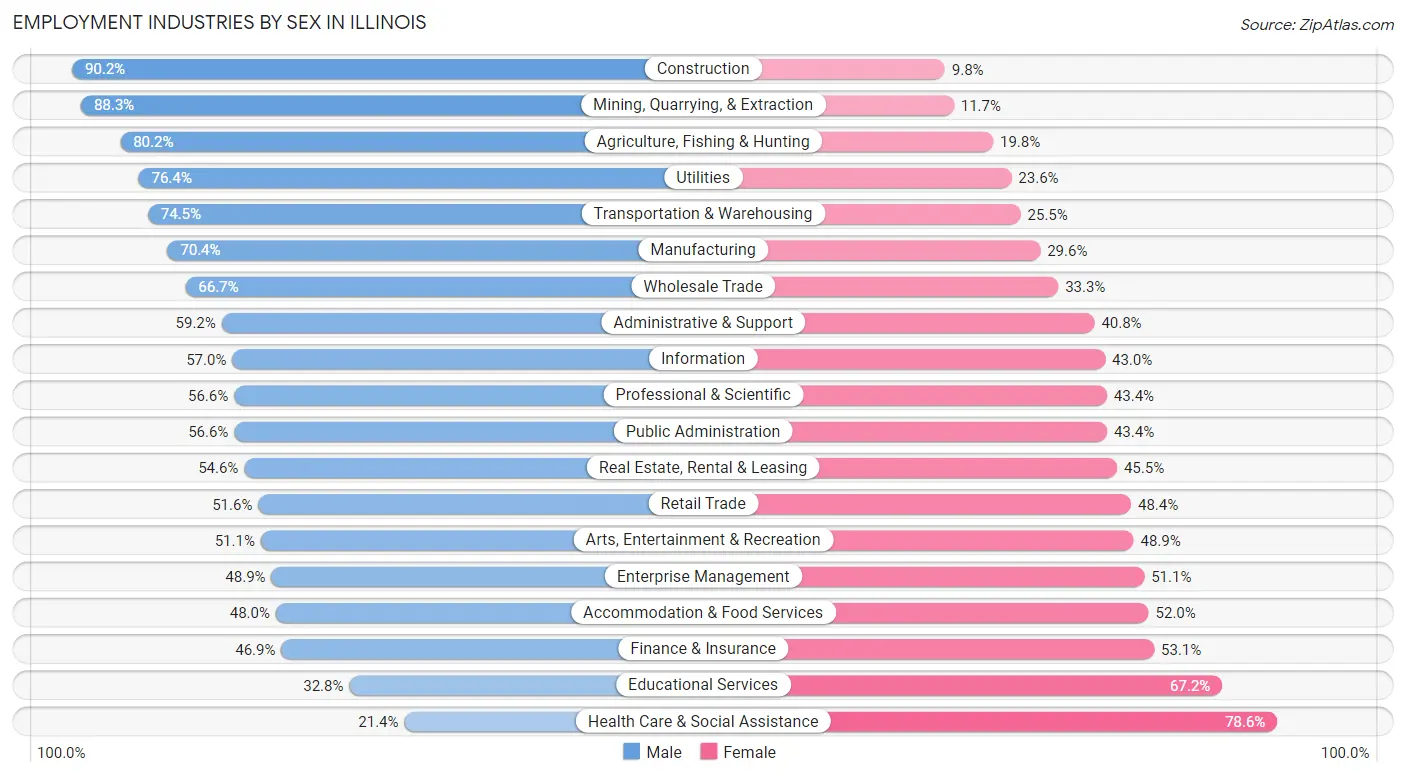
Employment Industries by Sex in Illinois
The Illinois industries that see more men than women are Construction (90.2%), Mining, Quarrying, & Extraction (88.3%), and Agriculture, Fishing & Hunting (80.2%), whereas the industries that tend to have a higher number of women are Health Care & Social Assistance (78.6%), Educational Services (67.2%), and Finance & Insurance (53.1%).
| Industry | Male | Female |
| Agriculture, Fishing & Hunting | 44,208 (80.2%) | 10,914 (19.8%) |
| Mining, Quarrying, & Extraction | 8,681 (88.3%) | 1,147 (11.7%) |
| Construction | 309,289 (90.2%) | 33,648 (9.8%) |
| Manufacturing | 515,223 (70.4%) | 216,263 (29.6%) |
| Wholesale Trade | 116,912 (66.7%) | 58,326 (33.3%) |
| Retail Trade | 340,218 (51.6%) | 318,588 (48.4%) |
| Transportation & Warehousing | 290,593 (74.5%) | 99,473 (25.5%) |
| Utilities | 33,711 (76.4%) | 10,409 (23.6%) |
| Information | 61,115 (57.0%) | 46,066 (43.0%) |
| Finance & Insurance | 167,142 (46.9%) | 189,489 (53.1%) |
| Real Estate, Rental & Leasing | 58,409 (54.5%) | 48,674 (45.5%) |
| Professional & Scientific | 296,596 (56.6%) | 227,024 (43.4%) |
| Enterprise Management | 5,360 (48.9%) | 5,598 (51.1%) |
| Administrative & Support | 149,399 (59.2%) | 102,895 (40.8%) |
| Educational Services | 197,247 (32.8%) | 404,297 (67.2%) |
| Health Care & Social Assistance | 184,968 (21.4%) | 679,541 (78.6%) |
| Arts, Entertainment & Recreation | 62,119 (51.1%) | 59,398 (48.9%) |
| Accommodation & Food Services | 195,057 (48.0%) | 211,255 (52.0%) |
| Public Administration | 132,227 (56.6%) | 101,317 (43.4%) |
| Total | 3,302,947 (52.6%) | 2,977,500 (47.4%) |
Education in Illinois
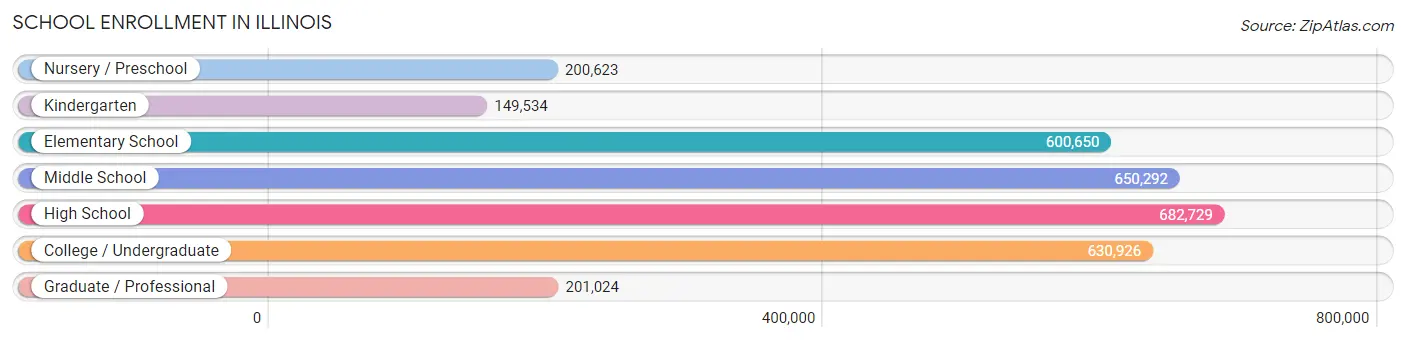
School Enrollment in Illinois
The most common levels of schooling among the 3,115,778 students in Illinois are high school (682,729 | 21.9%), middle school (650,292 | 20.9%), and college / undergraduate (630,926 | 20.3%).
| School Level | # Students | % Students |
| Nursery / Preschool | 200,623 | 6.4% |
| Kindergarten | 149,534 | 4.8% |
| Elementary School | 600,650 | 19.3% |
| Middle School | 650,292 | 20.9% |
| High School | 682,729 | 21.9% |
| College / Undergraduate | 630,926 | 20.3% |
| Graduate / Professional | 201,024 | 6.5% |
| Total | 3,115,778 | 100.0% |
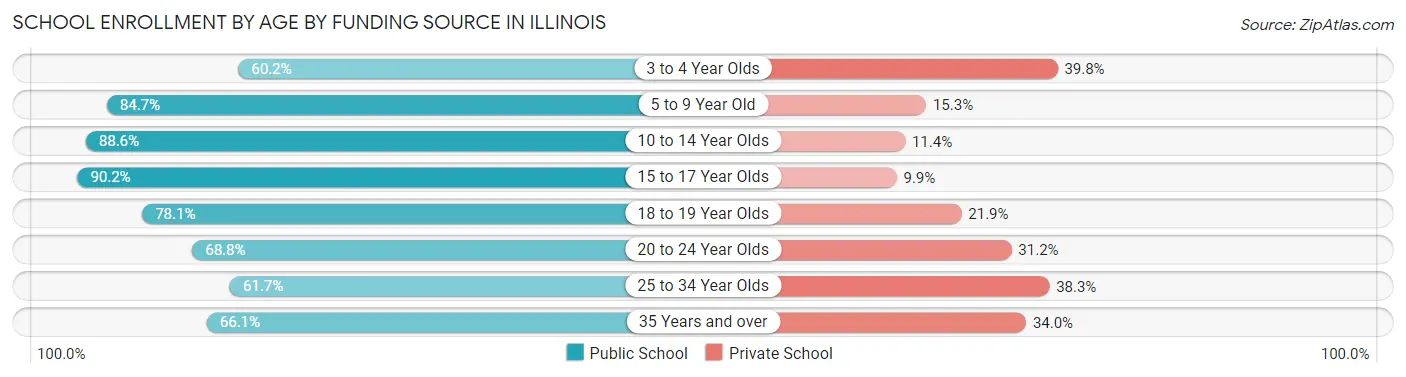
School Enrollment by Age by Funding Source in Illinois
Out of a total of 3,115,778 students who are enrolled in schools in Illinois, 601,345 (19.3%) attend a private institution, while the remaining 2,514,433 (80.7%) are enrolled in public schools. The age group of 3 to 4 year olds has the highest likelihood of being enrolled in private schools, with 61,980 (39.8% in the age bracket) enrolled. Conversely, the age group of 15 to 17 year olds has the lowest likelihood of being enrolled in a private school, with 442,936 (90.1% in the age bracket) attending a public institution.
| Age Bracket | Public School | Private School |
| 3 to 4 Year Olds | 93,672 (60.2%) | 61,980 (39.8%) |
| 5 to 9 Year Old | 610,679 (84.7%) | 110,536 (15.3%) |
| 10 to 14 Year Olds | 715,151 (88.6%) | 92,161 (11.4%) |
| 15 to 17 Year Olds | 442,936 (90.1%) | 48,375 (9.9%) |
| 18 to 19 Year Olds | 198,877 (78.1%) | 55,842 (21.9%) |
| 20 to 24 Year Olds | 236,715 (68.8%) | 107,562 (31.2%) |
| 25 to 34 Year Olds | 115,982 (61.7%) | 71,938 (38.3%) |
| 35 Years and over | 101,300 (66.0%) | 52,072 (34.0%) |
| Total | 2,514,433 (80.7%) | 601,345 (19.3%) |
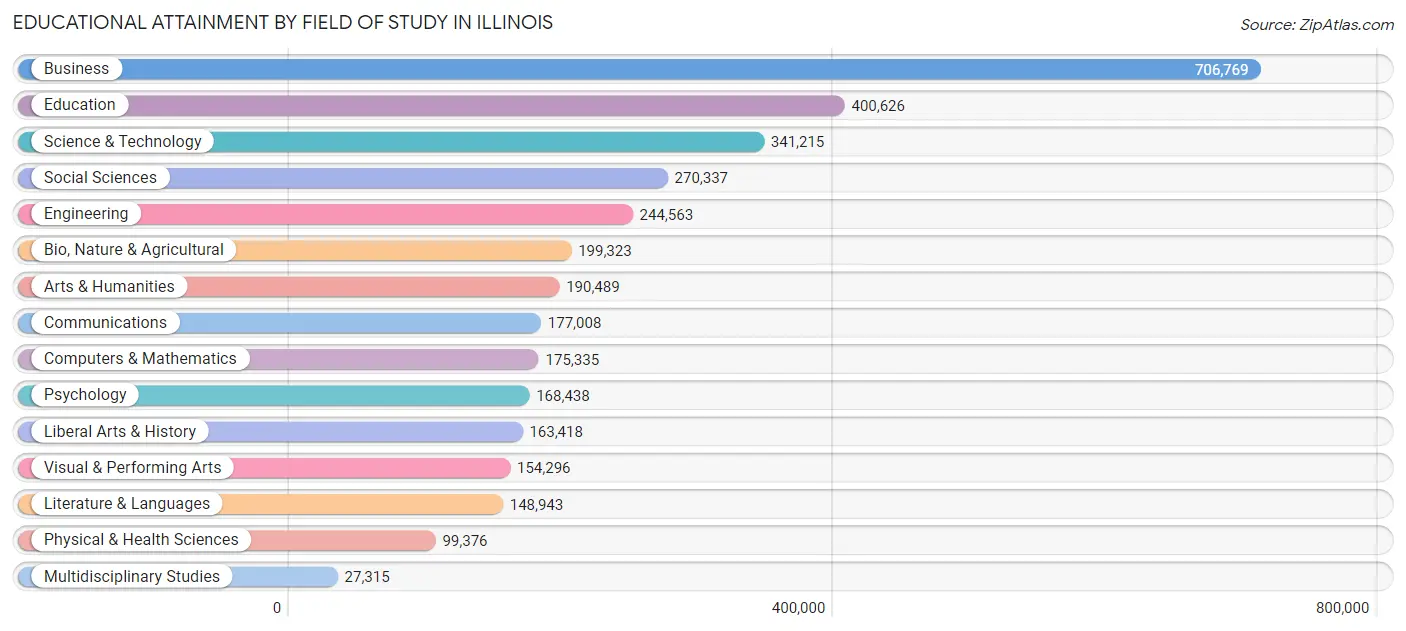
Educational Attainment by Field of Study in Illinois
Business (706,769 | 20.4%), education (400,626 | 11.6%), science & technology (341,215 | 9.8%), social sciences (270,337 | 7.8%), and engineering (244,563 | 7.0%) are the most common fields of study among 3,467,451 individuals in Illinois who have obtained a bachelor's degree or higher.
| Field of Study | # Graduates | % Graduates |
| Computers & Mathematics | 175,335 | 5.1% |
| Bio, Nature & Agricultural | 199,323 | 5.8% |
| Physical & Health Sciences | 99,376 | 2.9% |
| Psychology | 168,438 | 4.9% |
| Social Sciences | 270,337 | 7.8% |
| Engineering | 244,563 | 7.0% |
| Multidisciplinary Studies | 27,315 | 0.8% |
| Science & Technology | 341,215 | 9.8% |
| Business | 706,769 | 20.4% |
| Education | 400,626 | 11.6% |
| Literature & Languages | 148,943 | 4.3% |
| Liberal Arts & History | 163,418 | 4.7% |
| Visual & Performing Arts | 154,296 | 4.4% |
| Communications | 177,008 | 5.1% |
| Arts & Humanities | 190,489 | 5.5% |
| Total | 3,467,451 | 100.0% |
Transportation & Commute in Illinois
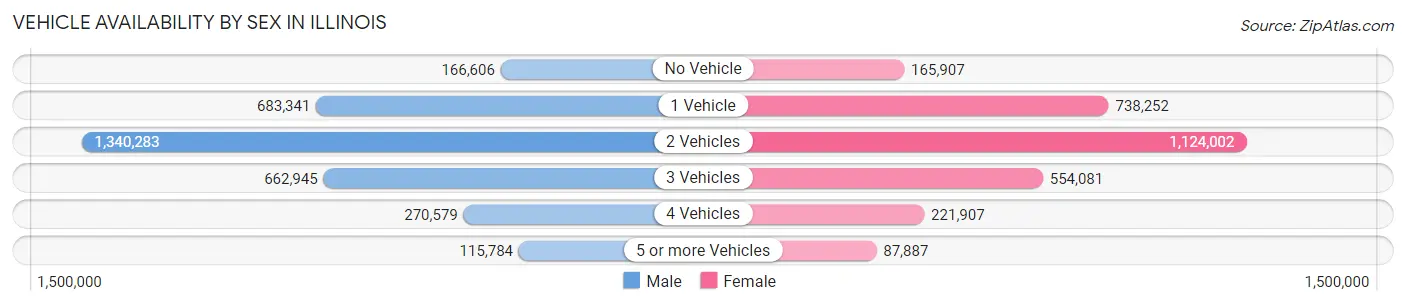
Vehicle Availability by Sex in Illinois
The most prevalent vehicle ownership categories in Illinois are males with 2 vehicles (1,340,283, accounting for 41.4%) and females with 2 vehicles (1,124,002, making up 46.3%).
| Vehicles Available | Male | Female |
| No Vehicle | 166,606 (5.1%) | 165,907 (5.7%) |
| 1 Vehicle | 683,341 (21.1%) | 738,252 (25.5%) |
| 2 Vehicles | 1,340,283 (41.4%) | 1,124,002 (38.9%) |
| 3 Vehicles | 662,945 (20.5%) | 554,081 (19.2%) |
| 4 Vehicles | 270,579 (8.4%) | 221,907 (7.7%) |
| 5 or more Vehicles | 115,784 (3.6%) | 87,887 (3.0%) |
| Total | 3,239,538 (100.0%) | 2,892,036 (100.0%) |
Commute Time in Illinois
The most frequently occuring commute durations in Illinois are 30 to 34 minutes (763,715 commuters, 14.1%), 15 to 19 minutes (717,875 commuters, 13.2%), and 20 to 24 minutes (683,531 commuters, 12.6%).
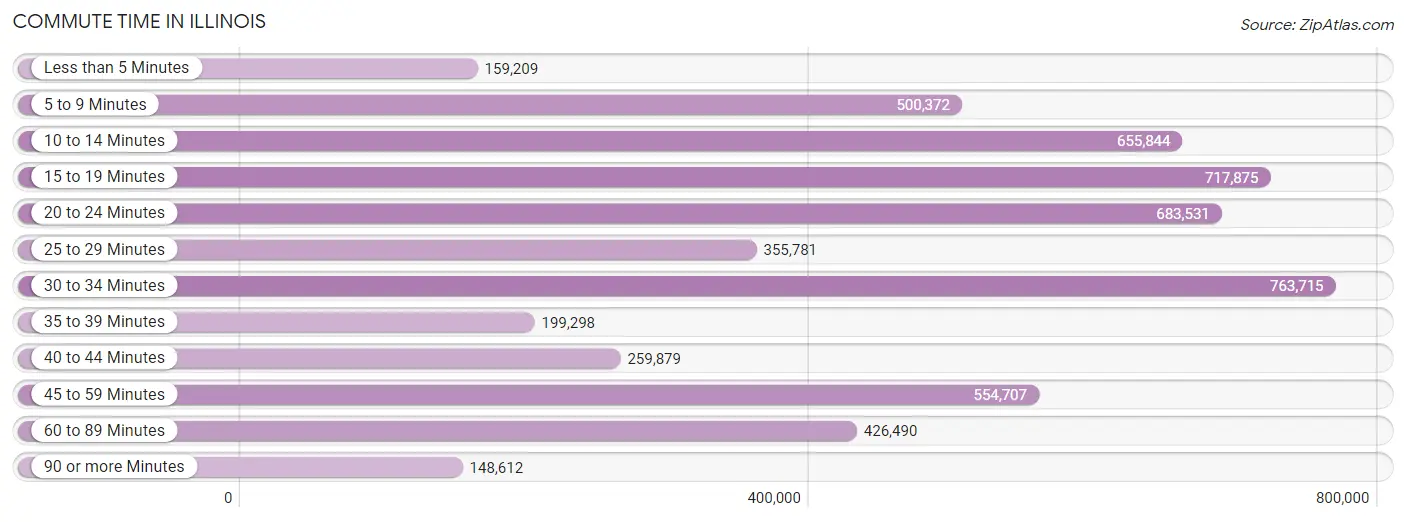
| Commute Time | # Commuters | % Commuters |
| Less than 5 Minutes | 159,209 | 2.9% |
| 5 to 9 Minutes | 500,372 | 9.2% |
| 10 to 14 Minutes | 655,844 | 12.1% |
| 15 to 19 Minutes | 717,875 | 13.2% |
| 20 to 24 Minutes | 683,531 | 12.6% |
| 25 to 29 Minutes | 355,781 | 6.6% |
| 30 to 34 Minutes | 763,715 | 14.1% |
| 35 to 39 Minutes | 199,298 | 3.7% |
| 40 to 44 Minutes | 259,879 | 4.8% |
| 45 to 59 Minutes | 554,707 | 10.2% |
| 60 to 89 Minutes | 426,490 | 7.9% |
| 90 or more Minutes | 148,612 | 2.7% |
Commute Time by Sex in Illinois
The most common commute times in Illinois are 30 to 34 minutes (422,300 commuters, 14.6%) for males and 15 to 19 minutes (356,051 commuters, 14.1%) for females.
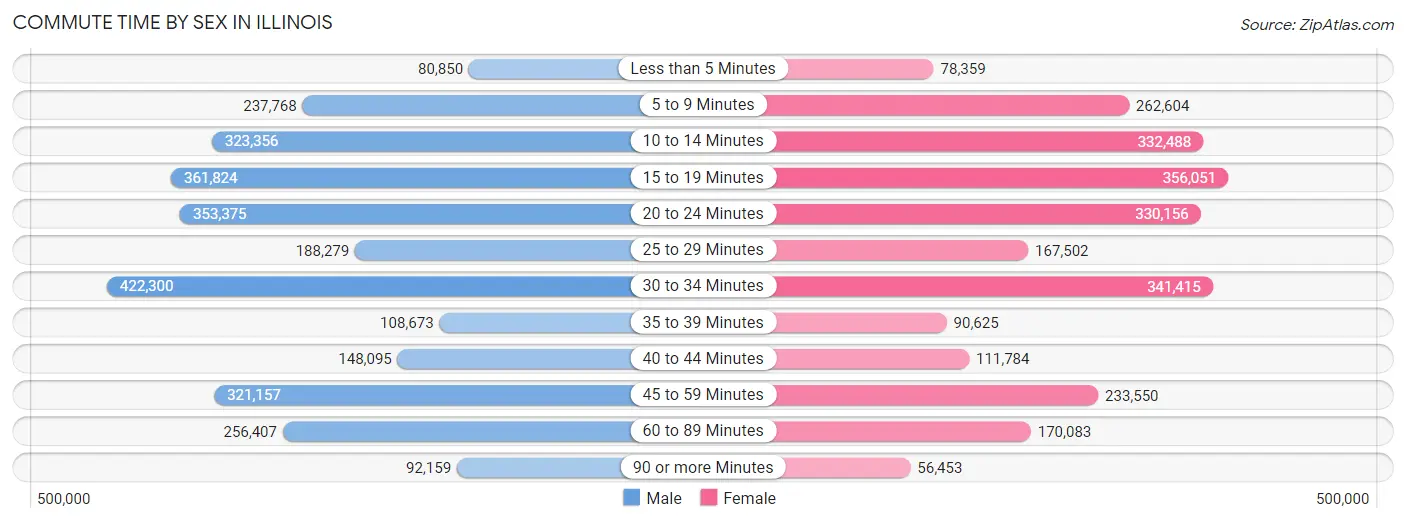
| Commute Time | Male | Female |
| Less than 5 Minutes | 80,850 (2.8%) | 78,359 (3.1%) |
| 5 to 9 Minutes | 237,768 (8.2%) | 262,604 (10.4%) |
| 10 to 14 Minutes | 323,356 (11.2%) | 332,488 (13.1%) |
| 15 to 19 Minutes | 361,824 (12.5%) | 356,051 (14.1%) |
| 20 to 24 Minutes | 353,375 (12.2%) | 330,156 (13.0%) |
| 25 to 29 Minutes | 188,279 (6.5%) | 167,502 (6.6%) |
| 30 to 34 Minutes | 422,300 (14.6%) | 341,415 (13.5%) |
| 35 to 39 Minutes | 108,673 (3.7%) | 90,625 (3.6%) |
| 40 to 44 Minutes | 148,095 (5.1%) | 111,784 (4.4%) |
| 45 to 59 Minutes | 321,157 (11.1%) | 233,550 (9.2%) |
| 60 to 89 Minutes | 256,407 (8.9%) | 170,083 (6.7%) |
| 90 or more Minutes | 92,159 (3.2%) | 56,453 (2.2%) |
Time of Departure to Work by Sex in Illinois
The most frequent times of departure to work in Illinois are 7:00 AM to 7:29 AM (387,114, 13.4%) for males and 7:00 AM to 7:29 AM (394,273, 15.6%) for females.
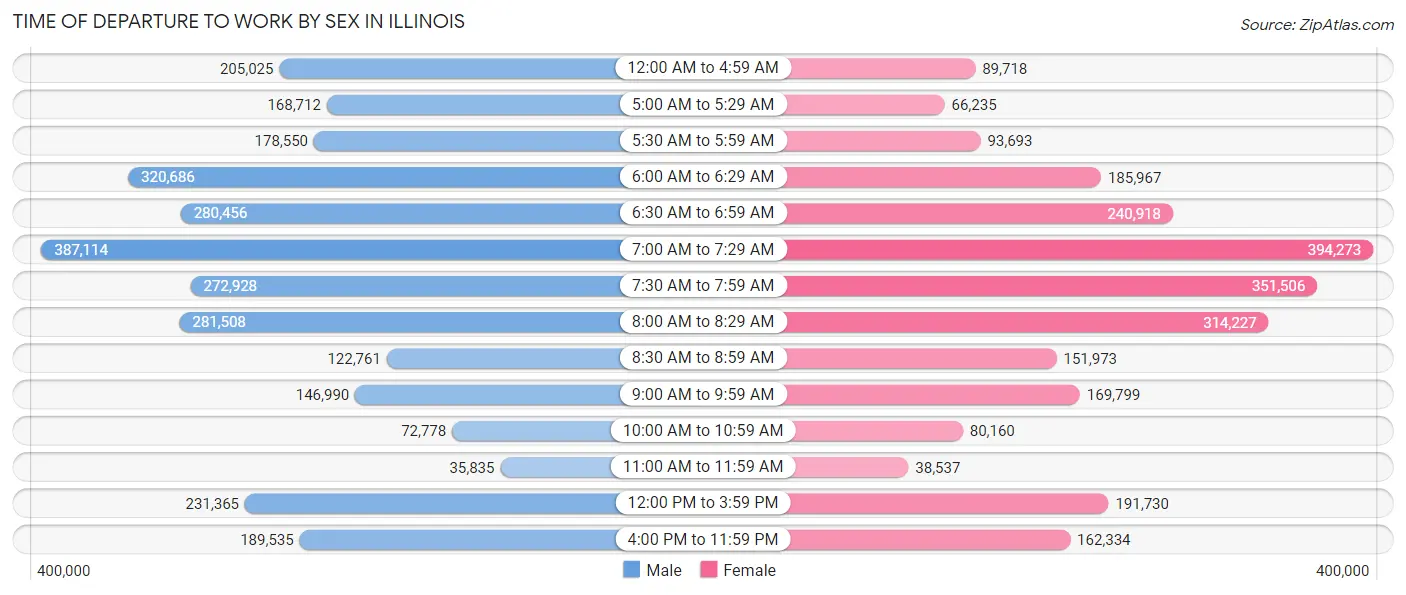
| Time of Departure | Male | Female |
| 12:00 AM to 4:59 AM | 205,025 (7.1%) | 89,718 (3.5%) |
| 5:00 AM to 5:29 AM | 168,712 (5.8%) | 66,235 (2.6%) |
| 5:30 AM to 5:59 AM | 178,550 (6.2%) | 93,693 (3.7%) |
| 6:00 AM to 6:29 AM | 320,686 (11.1%) | 185,967 (7.3%) |
| 6:30 AM to 6:59 AM | 280,456 (9.7%) | 240,918 (9.5%) |
| 7:00 AM to 7:29 AM | 387,114 (13.4%) | 394,273 (15.6%) |
| 7:30 AM to 7:59 AM | 272,928 (9.4%) | 351,506 (13.9%) |
| 8:00 AM to 8:29 AM | 281,508 (9.7%) | 314,227 (12.4%) |
| 8:30 AM to 8:59 AM | 122,761 (4.2%) | 151,973 (6.0%) |
| 9:00 AM to 9:59 AM | 146,990 (5.1%) | 169,799 (6.7%) |
| 10:00 AM to 10:59 AM | 72,778 (2.5%) | 80,160 (3.2%) |
| 11:00 AM to 11:59 AM | 35,835 (1.2%) | 38,537 (1.5%) |
| 12:00 PM to 3:59 PM | 231,365 (8.0%) | 191,730 (7.6%) |
| 4:00 PM to 11:59 PM | 189,535 (6.6%) | 162,334 (6.4%) |
| Total | 2,894,243 (100.0%) | 2,531,070 (100.0%) |
Housing Occupancy in Illinois
Occupancy by Ownership in Illinois
Of the total 4,968,761 dwellings in Illinois, owner-occupied units account for 3,312,809 (66.7%), while renter-occupied units make up 1,655,952 (33.3%).
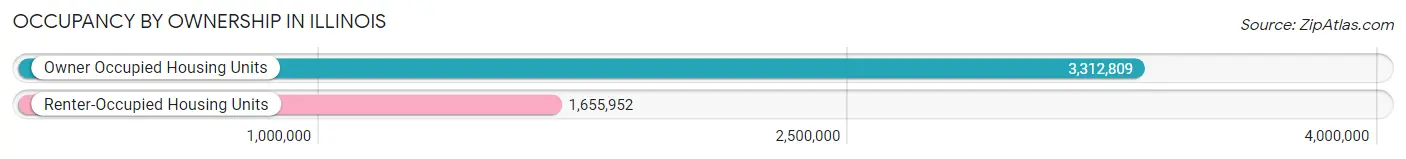
| Occupancy | # Housing Units | % Housing Units |
| Owner Occupied Housing Units | 3,312,809 | 66.7% |
| Renter-Occupied Housing Units | 1,655,952 | 33.3% |
| Total Occupied Housing Units | 4,968,761 | 100.0% |
Occupancy by Household Size in Illinois
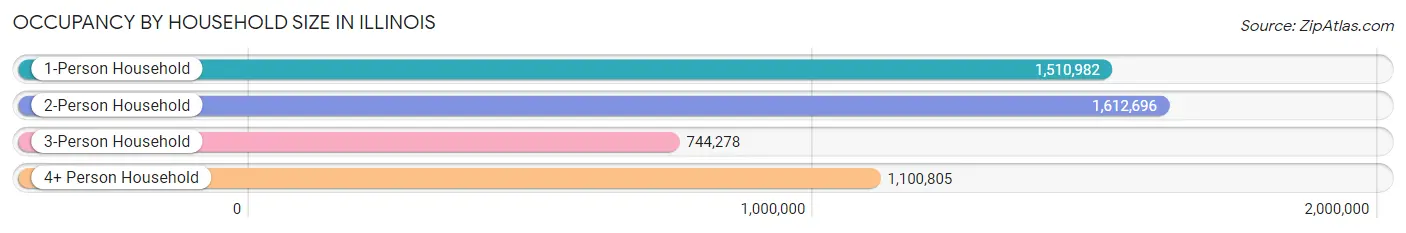
| Household Size | # Housing Units | % Housing Units |
| 1-Person Household | 1,510,982 | 30.4% |
| 2-Person Household | 1,612,696 | 32.5% |
| 3-Person Household | 744,278 | 15.0% |
| 4+ Person Household | 1,100,805 | 22.2% |
| Total Housing Units | 4,968,761 | 100.0% |
Occupancy by Ownership by Household Size in Illinois
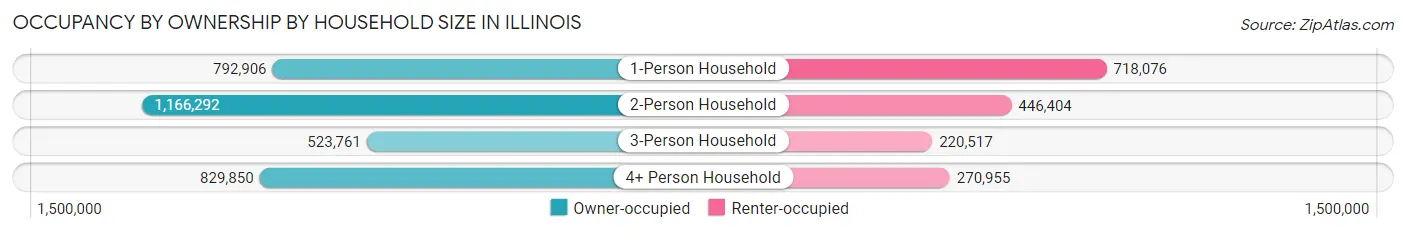
| Household Size | Owner-occupied | Renter-occupied |
| 1-Person Household | 792,906 (52.5%) | 718,076 (47.5%) |
| 2-Person Household | 1,166,292 (72.3%) | 446,404 (27.7%) |
| 3-Person Household | 523,761 (70.4%) | 220,517 (29.6%) |
| 4+ Person Household | 829,850 (75.4%) | 270,955 (24.6%) |
| Total Housing Units | 3,312,809 (66.7%) | 1,655,952 (33.3%) |
Occupancy by Educational Attainment in Illinois
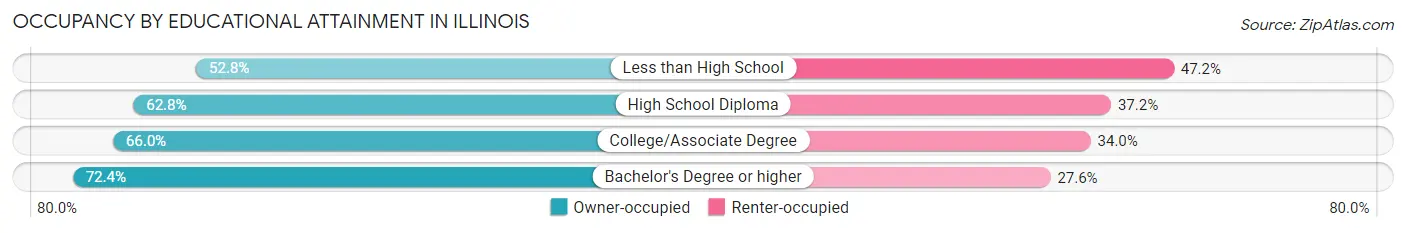
| Household Size | Owner-occupied | Renter-occupied |
| Less than High School | 214,001 (52.8%) | 191,328 (47.2%) |
| High School Diploma | 712,051 (62.8%) | 422,544 (37.2%) |
| College/Associate Degree | 977,974 (66.0%) | 503,942 (34.0%) |
| Bachelor's Degree or higher | 1,408,783 (72.4%) | 538,138 (27.6%) |
Occupancy by Age of Householder in Illinois
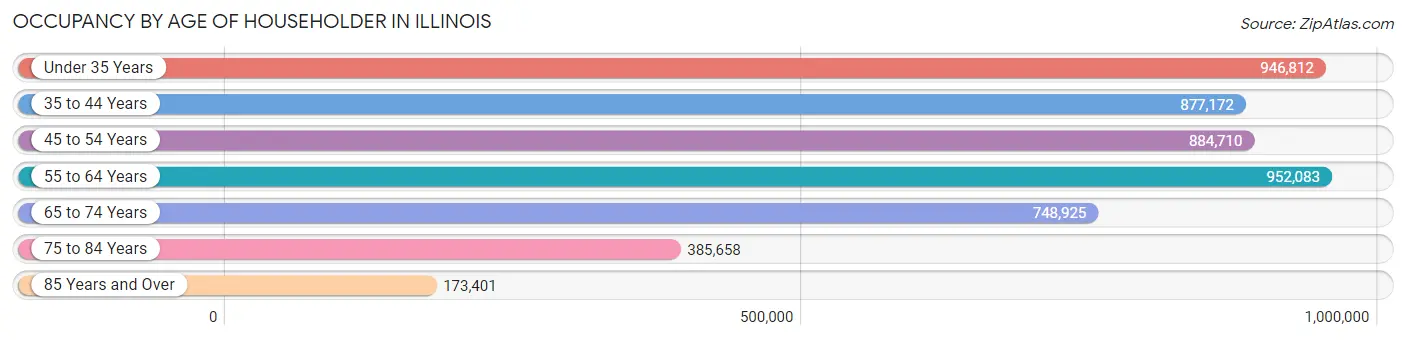
| Age Bracket | # Households | % Households |
| Under 35 Years | 946,812 | 19.1% |
| 35 to 44 Years | 877,172 | 17.6% |
| 45 to 54 Years | 884,710 | 17.8% |
| 55 to 64 Years | 952,083 | 19.2% |
| 65 to 74 Years | 748,925 | 15.1% |
| 75 to 84 Years | 385,658 | 7.8% |
| 85 Years and Over | 173,401 | 3.5% |
| Total | 4,968,761 | 100.0% |
Housing Finances in Illinois
Median Income by Occupancy in Illinois
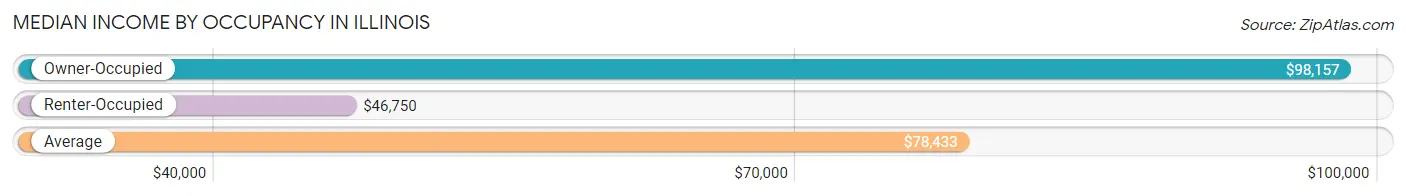
| Occupancy Type | # Households | Median Income |
| Owner-Occupied | 3,312,809 (66.7%) | $98,157 |
| Renter-Occupied | 1,655,952 (33.3%) | $46,750 |
| Average | 4,968,761 (100.0%) | $78,433 |
Occupancy by Householder Income Bracket in Illinois
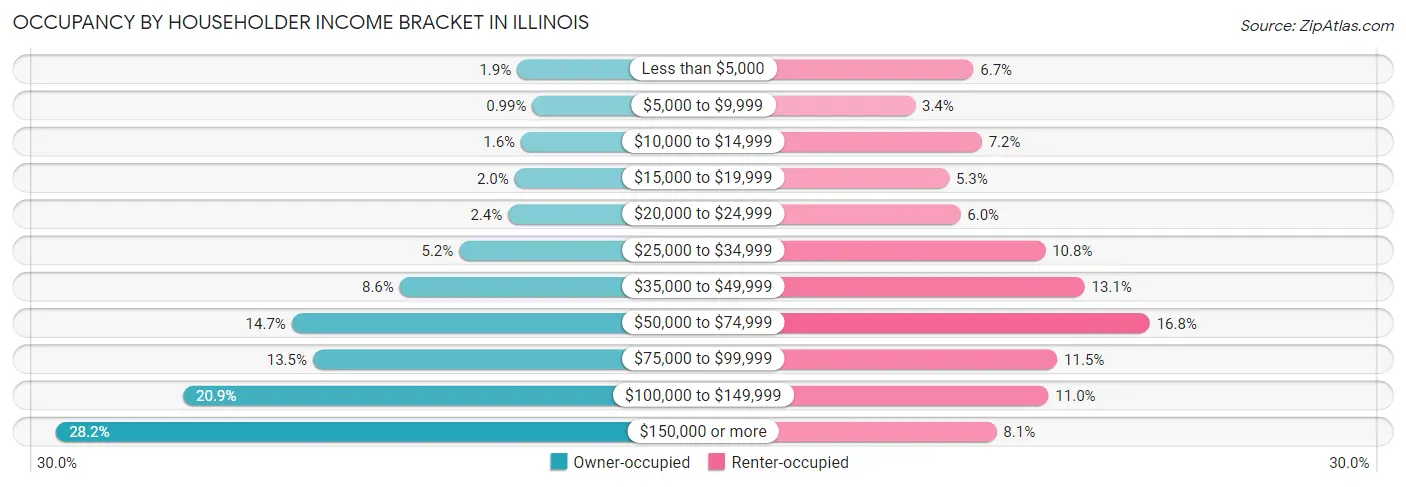
| Income Bracket | Owner-occupied | Renter-occupied |
| Less than $5,000 | 61,567 (1.9%) | 111,468 (6.7%) |
| $5,000 to $9,999 | 32,726 (1.0%) | 56,222 (3.4%) |
| $10,000 to $14,999 | 54,287 (1.6%) | 119,343 (7.2%) |
| $15,000 to $19,999 | 66,326 (2.0%) | 88,497 (5.3%) |
| $20,000 to $24,999 | 78,392 (2.4%) | 99,188 (6.0%) |
| $25,000 to $34,999 | 171,402 (5.2%) | 179,564 (10.8%) |
| $35,000 to $49,999 | 284,035 (8.6%) | 216,764 (13.1%) |
| $50,000 to $74,999 | 488,301 (14.7%) | 278,370 (16.8%) |
| $75,000 to $99,999 | 448,230 (13.5%) | 190,816 (11.5%) |
| $100,000 to $149,999 | 693,776 (20.9%) | 182,479 (11.0%) |
| $150,000 or more | 933,767 (28.2%) | 133,241 (8.1%) |
| Total | 3,312,809 (100.0%) | 1,655,952 (100.0%) |
Monthly Housing Cost Tiers in Illinois
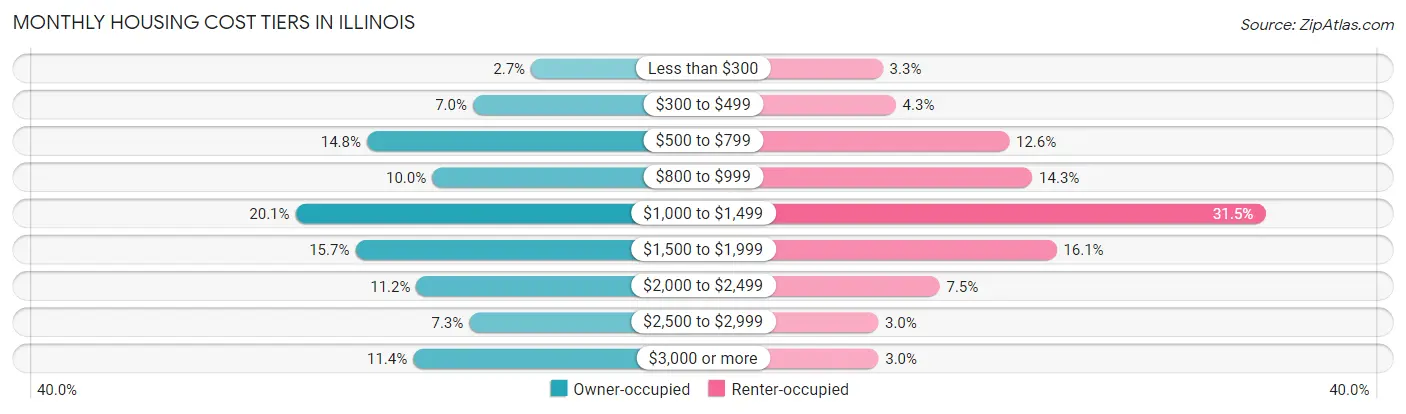
| Monthly Cost | Owner-occupied | Renter-occupied |
| Less than $300 | 89,824 (2.7%) | 55,103 (3.3%) |
| $300 to $499 | 231,631 (7.0%) | 71,102 (4.3%) |
| $500 to $799 | 490,256 (14.8%) | 209,318 (12.6%) |
| $800 to $999 | 330,831 (10.0%) | 237,393 (14.3%) |
| $1,000 to $1,499 | 664,695 (20.1%) | 521,590 (31.5%) |
| $1,500 to $1,999 | 518,387 (15.7%) | 267,137 (16.1%) |
| $2,000 to $2,499 | 369,433 (11.2%) | 124,448 (7.5%) |
| $2,500 to $2,999 | 240,496 (7.3%) | 49,450 (3.0%) |
| $3,000 or more | 377,256 (11.4%) | 49,806 (3.0%) |
| Total | 3,312,809 (100.0%) | 1,655,952 (100.0%) |
Physical Housing Characteristics in Illinois
Housing Structures in Illinois
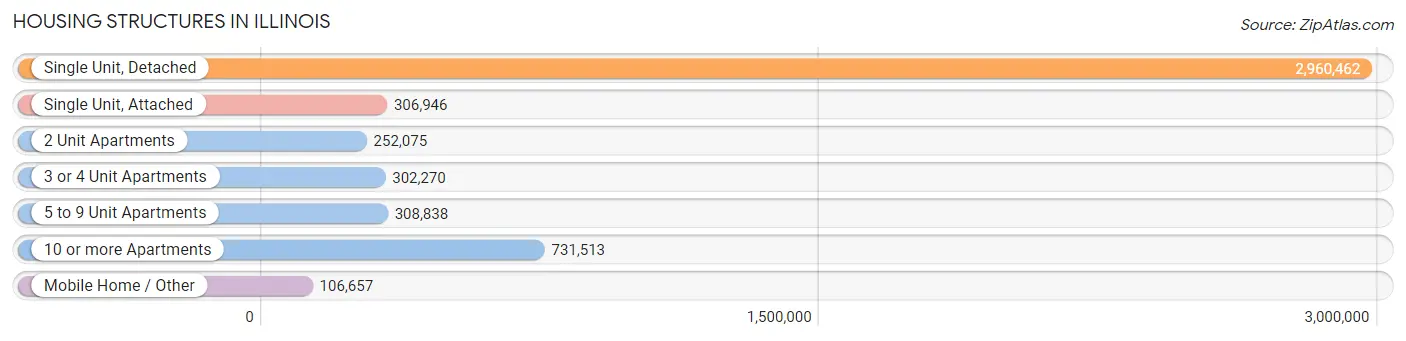
| Structure Type | # Housing Units | % Housing Units |
| Single Unit, Detached | 2,960,462 | 59.6% |
| Single Unit, Attached | 306,946 | 6.2% |
| 2 Unit Apartments | 252,075 | 5.1% |
| 3 or 4 Unit Apartments | 302,270 | 6.1% |
| 5 to 9 Unit Apartments | 308,838 | 6.2% |
| 10 or more Apartments | 731,513 | 14.7% |
| Mobile Home / Other | 106,657 | 2.1% |
| Total | 4,968,761 | 100.0% |
Housing Structures by Occupancy in Illinois
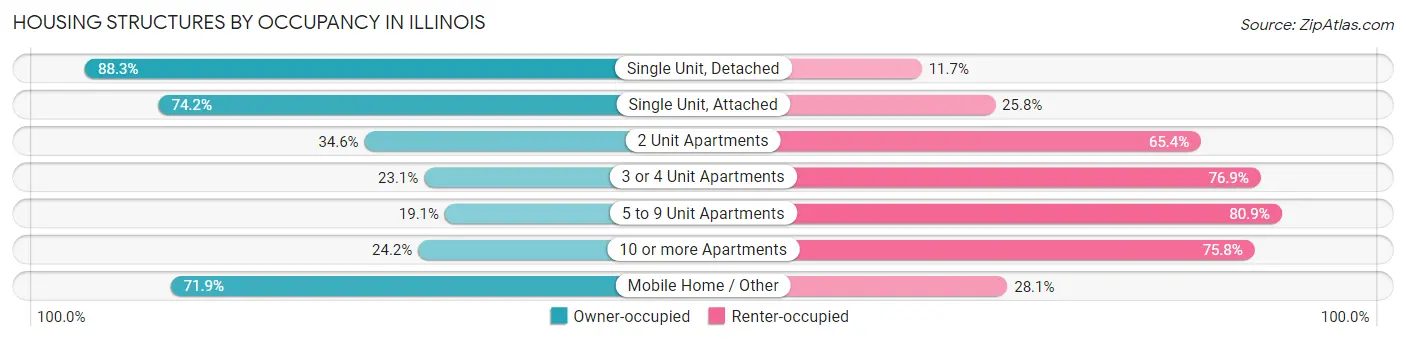
| Structure Type | Owner-occupied | Renter-occupied |
| Single Unit, Detached | 2,615,274 (88.3%) | 345,188 (11.7%) |
| Single Unit, Attached | 227,753 (74.2%) | 79,193 (25.8%) |
| 2 Unit Apartments | 87,137 (34.6%) | 164,938 (65.4%) |
| 3 or 4 Unit Apartments | 69,777 (23.1%) | 232,493 (76.9%) |
| 5 to 9 Unit Apartments | 58,927 (19.1%) | 249,911 (80.9%) |
| 10 or more Apartments | 177,289 (24.2%) | 554,224 (75.8%) |
| Mobile Home / Other | 76,652 (71.9%) | 30,005 (28.1%) |
| Total | 3,312,809 (66.7%) | 1,655,952 (33.3%) |
Housing Structures by Number of Rooms in Illinois
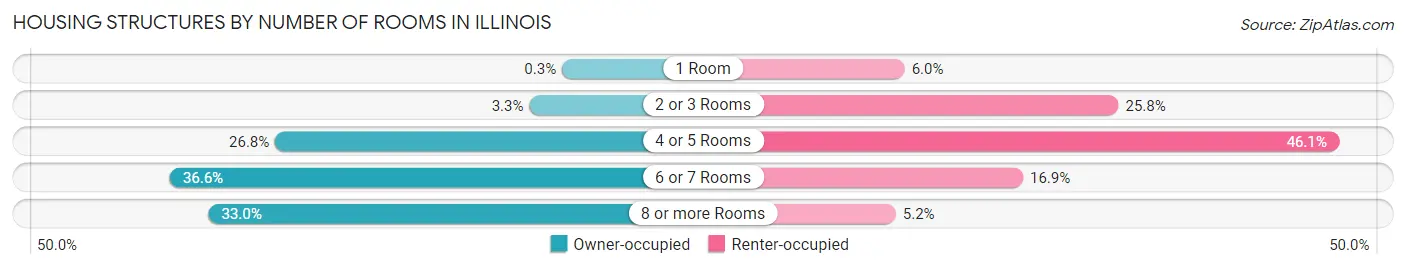
| Number of Rooms | Owner-occupied | Renter-occupied |
| 1 Room | 10,069 (0.3%) | 99,118 (6.0%) |
| 2 or 3 Rooms | 110,112 (3.3%) | 426,790 (25.8%) |
| 4 or 5 Rooms | 888,665 (26.8%) | 763,912 (46.1%) |
| 6 or 7 Rooms | 1,211,124 (36.6%) | 280,550 (16.9%) |
| 8 or more Rooms | 1,092,839 (33.0%) | 85,582 (5.2%) |
| Total | 3,312,809 (100.0%) | 1,655,952 (100.0%) |
Housing Structure by Heating Type in Illinois
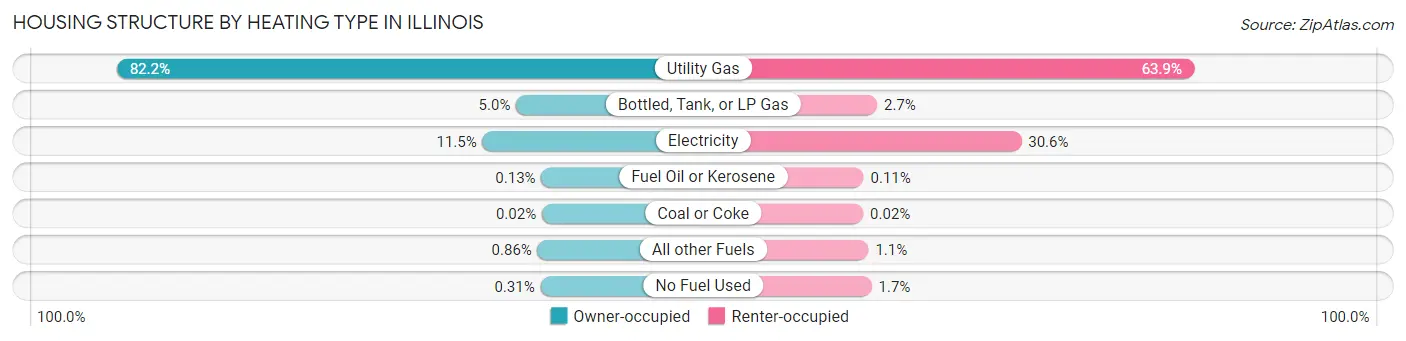
| Heating Type | Owner-occupied | Renter-occupied |
| Utility Gas | 2,722,961 (82.2%) | 1,057,905 (63.9%) |
| Bottled, Tank, or LP Gas | 165,486 (5.0%) | 44,738 (2.7%) |
| Electricity | 380,893 (11.5%) | 506,407 (30.6%) |
| Fuel Oil or Kerosene | 4,159 (0.1%) | 1,807 (0.1%) |
| Coal or Coke | 602 (0.0%) | 399 (0.0%) |
| All other Fuels | 28,505 (0.9%) | 17,353 (1.1%) |
| No Fuel Used | 10,203 (0.3%) | 27,343 (1.7%) |
| Total | 3,312,809 (100.0%) | 1,655,952 (100.0%) |
Household Vehicle Usage in Illinois
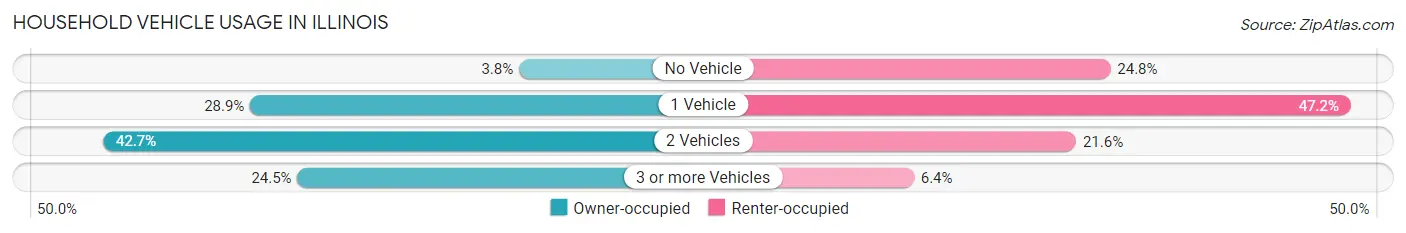
| Vehicles per Household | Owner-occupied | Renter-occupied |
| No Vehicle | 127,047 (3.8%) | 410,299 (24.8%) |
| 1 Vehicle | 958,576 (28.9%) | 781,962 (47.2%) |
| 2 Vehicles | 1,414,403 (42.7%) | 357,133 (21.6%) |
| 3 or more Vehicles | 812,783 (24.5%) | 106,558 (6.4%) |
| Total | 3,312,809 (100.0%) | 1,655,952 (100.0%) |
Real Estate & Mortgages in Illinois
Real Estate and Mortgage Overview in Illinois
| Characteristic | Without Mortgage | With Mortgage |
| Housing Units | 1,258,536 | 2,054,273 |
| Median Property Value | $209,400 | $256,300 |
| Median Household Income | $72,814 | $690,409 |
| Monthly Housing Costs | $737 | $363,447 |
| Real Estate Taxes | $4,224 | $35,825 |
Property Value by Mortgage Status in Illinois
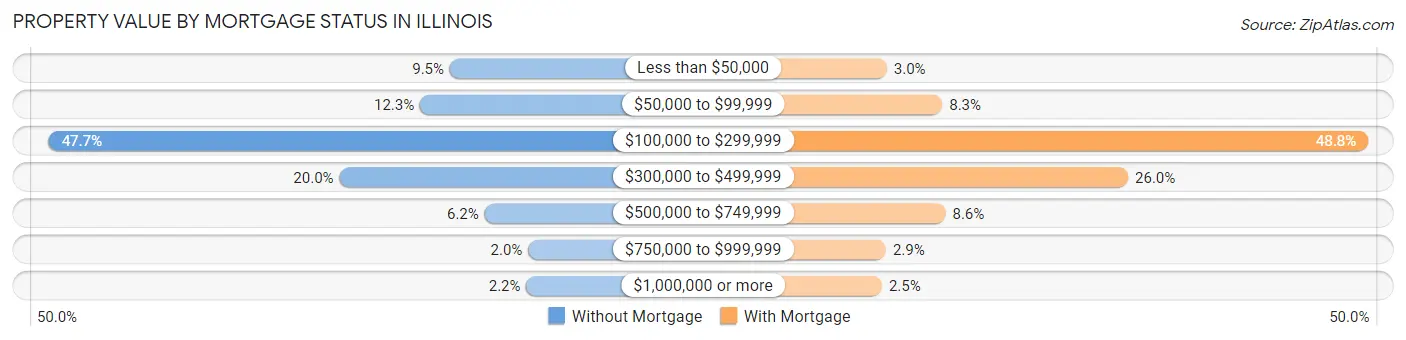
| Property Value | Without Mortgage | With Mortgage |
| Less than $50,000 | 119,620 (9.5%) | 61,128 (3.0%) |
| $50,000 to $99,999 | 155,263 (12.3%) | 169,699 (8.3%) |
| $100,000 to $299,999 | 600,333 (47.7%) | 1,002,786 (48.8%) |
| $300,000 to $499,999 | 251,955 (20.0%) | 533,201 (26.0%) |
| $500,000 to $749,999 | 77,896 (6.2%) | 176,068 (8.6%) |
| $750,000 to $999,999 | 25,706 (2.0%) | 59,656 (2.9%) |
| $1,000,000 or more | 27,763 (2.2%) | 51,735 (2.5%) |
| Total | 1,258,536 (100.0%) | 2,054,273 (100.0%) |
Household Income by Mortgage Status in Illinois
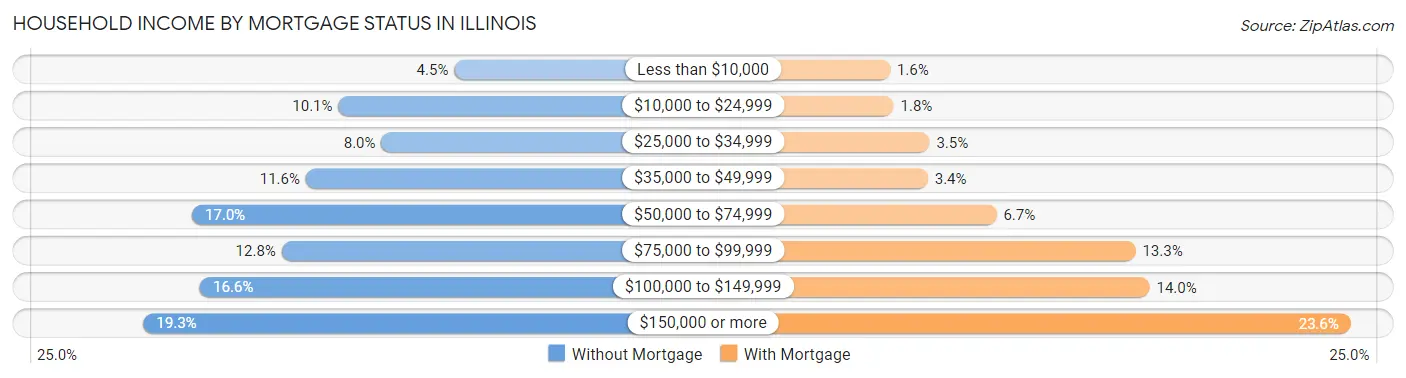
| Household Income | Without Mortgage | With Mortgage |
| Less than $10,000 | 57,097 (4.5%) | 33,734 (1.6%) |
| $10,000 to $24,999 | 126,620 (10.1%) | 37,196 (1.8%) |
| $25,000 to $34,999 | 100,809 (8.0%) | 72,385 (3.5%) |
| $35,000 to $49,999 | 146,174 (11.6%) | 70,593 (3.4%) |
| $50,000 to $74,999 | 214,364 (17.0%) | 137,861 (6.7%) |
| $75,000 to $99,999 | 160,635 (12.8%) | 273,937 (13.3%) |
| $100,000 to $149,999 | 209,479 (16.6%) | 287,595 (14.0%) |
| $150,000 or more | 243,358 (19.3%) | 484,297 (23.6%) |
| Total | 1,258,536 (100.0%) | 2,054,273 (100.0%) |
Property Value to Household Income Ratio in Illinois
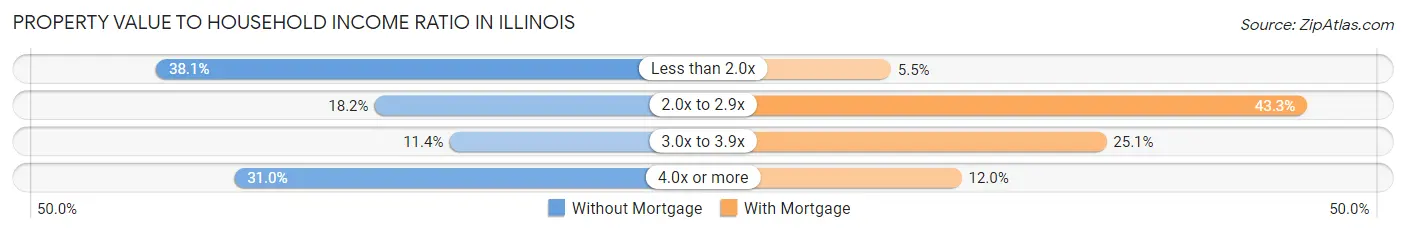
| Value-to-Income Ratio | Without Mortgage | With Mortgage |
| Less than 2.0x | 478,997 (38.1%) | 113,647 (5.5%) |
| 2.0x to 2.9x | 229,566 (18.2%) | 890,024 (43.3%) |
| 3.0x to 3.9x | 143,988 (11.4%) | 515,532 (25.1%) |
| 4.0x or more | 389,684 (31.0%) | 245,517 (11.9%) |
| Total | 1,258,536 (100.0%) | 2,054,273 (100.0%) |
Real Estate Taxes by Mortgage Status in Illinois
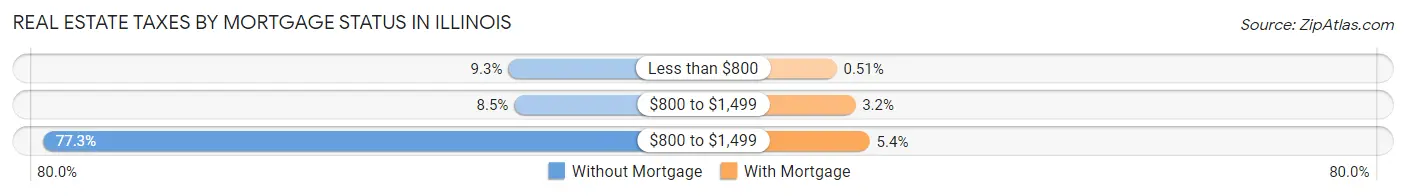
| Property Taxes | Without Mortgage | With Mortgage |
| Less than $800 | 117,419 (9.3%) | 10,403 (0.5%) |
| $800 to $1,499 | 106,441 (8.5%) | 66,617 (3.2%) |
| $800 to $1,499 | 973,207 (77.3%) | 109,875 (5.3%) |
| Total | 1,258,536 (100.0%) | 2,054,273 (100.0%) |
Health & Disability in Illinois
Health Insurance Coverage by Age in Illinois
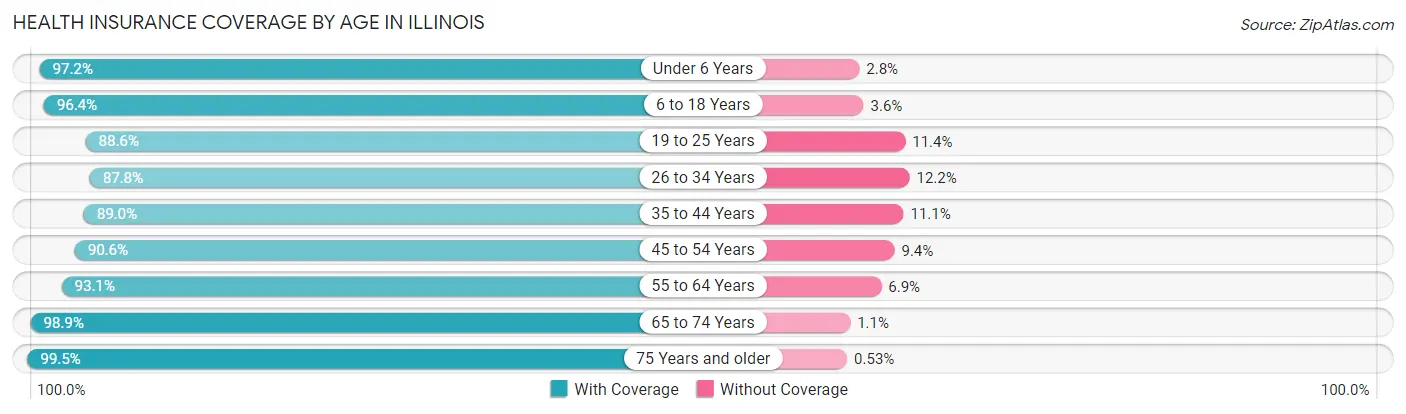
| Age Bracket | With Coverage | Without Coverage |
| Under 6 Years | 844,955 (97.2%) | 24,469 (2.8%) |
| 6 to 18 Years | 2,049,356 (96.4%) | 76,510 (3.6%) |
| 19 to 25 Years | 1,027,650 (88.6%) | 131,936 (11.4%) |
| 26 to 34 Years | 1,354,142 (87.8%) | 187,684 (12.2%) |
| 35 to 44 Years | 1,468,806 (88.9%) | 182,442 (11.1%) |
| 45 to 54 Years | 1,443,168 (90.6%) | 149,131 (9.4%) |
| 55 to 64 Years | 1,527,408 (93.1%) | 113,316 (6.9%) |
| 65 to 74 Years | 1,181,420 (98.9%) | 13,129 (1.1%) |
| 75 Years and older | 808,675 (99.5%) | 4,301 (0.5%) |
| Total | 11,705,580 (93.0%) | 882,918 (7.0%) |
Health Insurance Coverage by Citizenship Status in Illinois
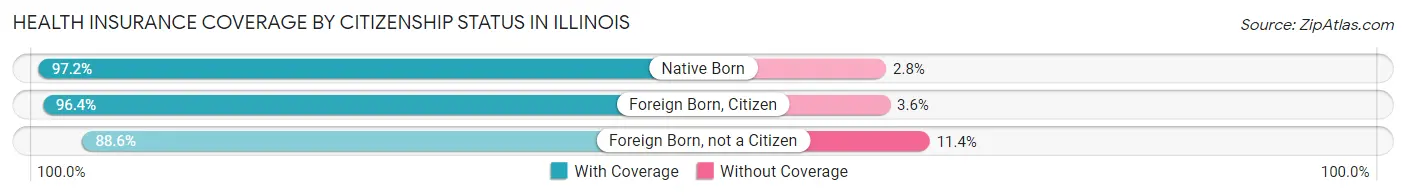
| Citizenship Status | With Coverage | Without Coverage |
| Native Born | 844,955 (97.2%) | 24,469 (2.8%) |
| Foreign Born, Citizen | 2,049,356 (96.4%) | 76,510 (3.6%) |
| Foreign Born, not a Citizen | 1,027,650 (88.6%) | 131,936 (11.4%) |
Health Insurance Coverage by Household Income in Illinois
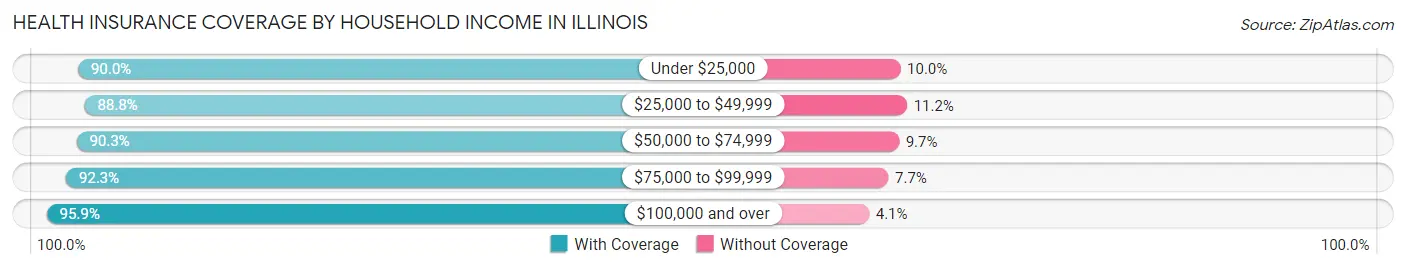
| Household Income | With Coverage | Without Coverage |
| Under $25,000 | 1,187,420 (90.0%) | 131,845 (10.0%) |
| $25,000 to $49,999 | 1,562,281 (88.8%) | 197,430 (11.2%) |
| $50,000 to $74,999 | 1,611,304 (90.3%) | 173,389 (9.7%) |
| $75,000 to $99,999 | 1,522,078 (92.3%) | 127,618 (7.7%) |
| $100,000 and over | 5,710,875 (95.9%) | 245,327 (4.1%) |
Public vs Private Health Insurance Coverage by Age in Illinois
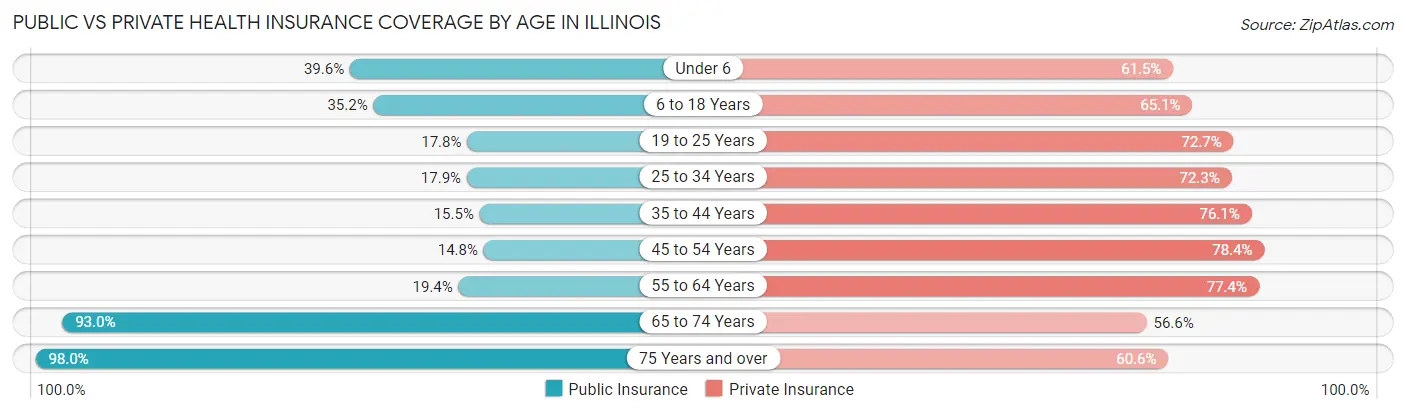
| Age Bracket | Public Insurance | Private Insurance |
| Under 6 | 344,316 (39.6%) | 534,952 (61.5%) |
| 6 to 18 Years | 749,170 (35.2%) | 1,383,555 (65.1%) |
| 19 to 25 Years | 206,784 (17.8%) | 843,269 (72.7%) |
| 25 to 34 Years | 275,943 (17.9%) | 1,115,192 (72.3%) |
| 35 to 44 Years | 256,298 (15.5%) | 1,256,069 (76.1%) |
| 45 to 54 Years | 235,081 (14.8%) | 1,248,977 (78.4%) |
| 55 to 64 Years | 318,965 (19.4%) | 1,269,710 (77.4%) |
| 65 to 74 Years | 1,111,007 (93.0%) | 675,710 (56.6%) |
| 75 Years and over | 796,517 (98.0%) | 492,692 (60.6%) |
| Total | 4,294,081 (34.1%) | 8,820,126 (70.1%) |
Disability Status by Sex by Age in Illinois
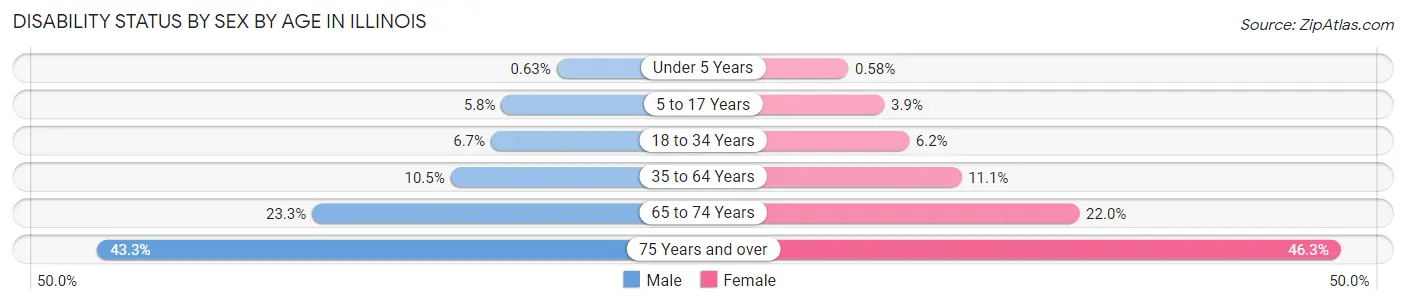
| Age Bracket | Male | Female |
| Under 5 Years | 2,334 (0.6%) | 2,043 (0.6%) |
| 5 to 17 Years | 61,694 (5.8%) | 40,303 (3.9%) |
| 18 to 34 Years | 97,417 (6.7%) | 89,010 (6.2%) |
| 35 to 64 Years | 253,866 (10.5%) | 272,474 (11.1%) |
| 65 to 74 Years | 130,800 (23.3%) | 139,608 (22.0%) |
| 75 Years and over | 142,255 (43.3%) | 224,088 (46.3%) |
Disability Class by Sex by Age in Illinois
Disability Class: Hearing Difficulty
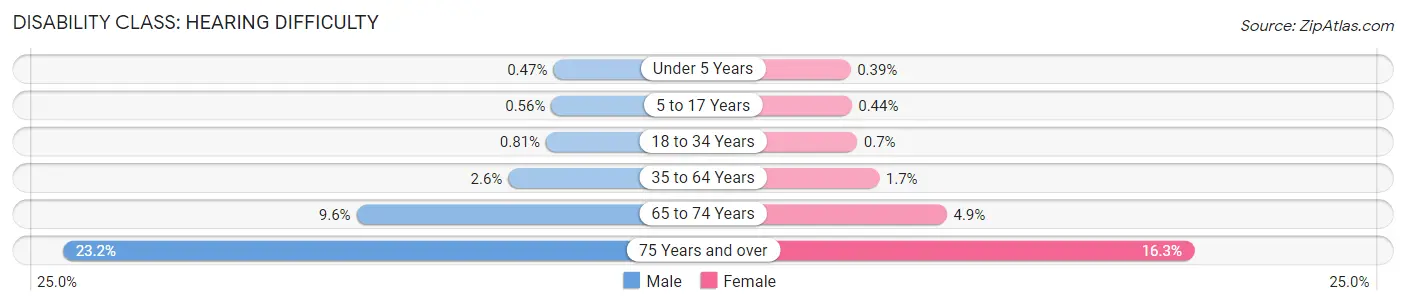
| Age Bracket | Male | Female |
| Under 5 Years | 1,731 (0.5%) | 1,386 (0.4%) |
| 5 to 17 Years | 5,979 (0.6%) | 4,490 (0.4%) |
| 18 to 34 Years | 11,704 (0.8%) | 9,954 (0.7%) |
| 35 to 64 Years | 62,049 (2.6%) | 42,357 (1.7%) |
| 65 to 74 Years | 53,848 (9.6%) | 30,795 (4.9%) |
| 75 Years and over | 76,380 (23.2%) | 79,084 (16.3%) |
Disability Class: Vision Difficulty
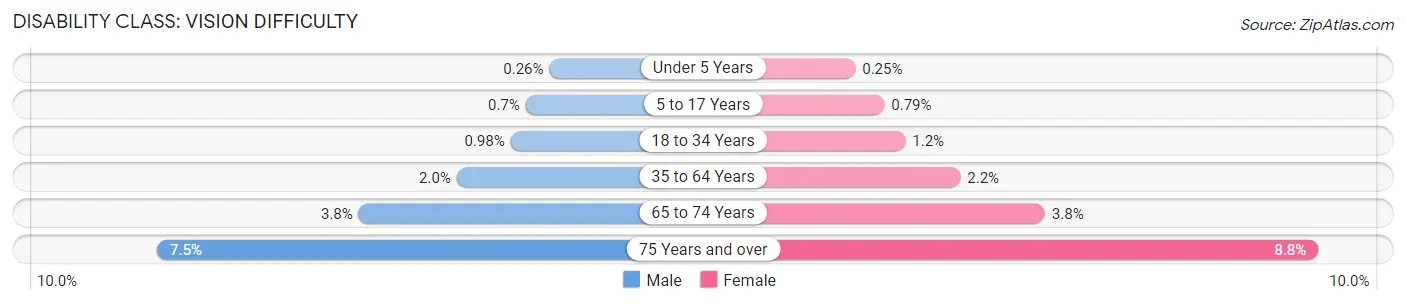
| Age Bracket | Male | Female |
| Under 5 Years | 949 (0.3%) | 885 (0.3%) |
| 5 to 17 Years | 7,525 (0.7%) | 8,073 (0.8%) |
| 18 to 34 Years | 14,195 (1.0%) | 16,938 (1.2%) |
| 35 to 64 Years | 48,123 (2.0%) | 54,103 (2.2%) |
| 65 to 74 Years | 21,316 (3.8%) | 23,898 (3.8%) |
| 75 Years and over | 24,782 (7.5%) | 42,813 (8.8%) |
Disability Class: Cognitive Difficulty
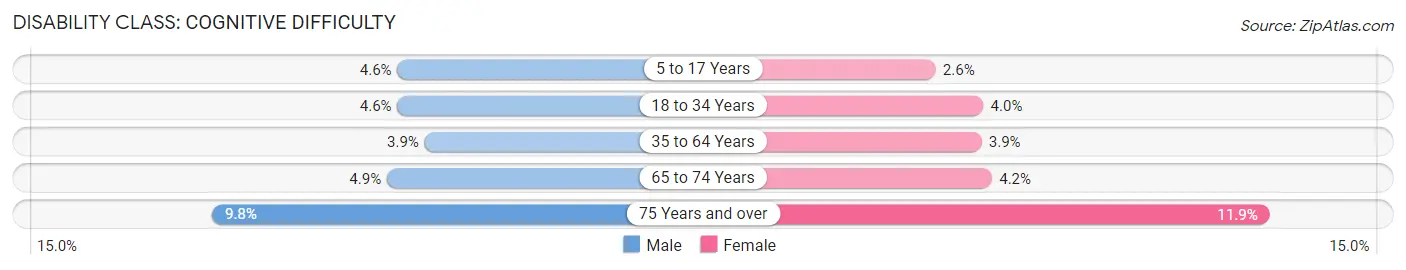
| Age Bracket | Male | Female |
| 5 to 17 Years | 49,570 (4.6%) | 26,829 (2.6%) |
| 18 to 34 Years | 66,866 (4.6%) | 56,529 (4.0%) |
| 35 to 64 Years | 93,691 (3.9%) | 95,794 (3.9%) |
| 65 to 74 Years | 27,557 (4.9%) | 26,534 (4.2%) |
| 75 Years and over | 32,146 (9.8%) | 57,653 (11.9%) |
Disability Class: Ambulatory Difficulty
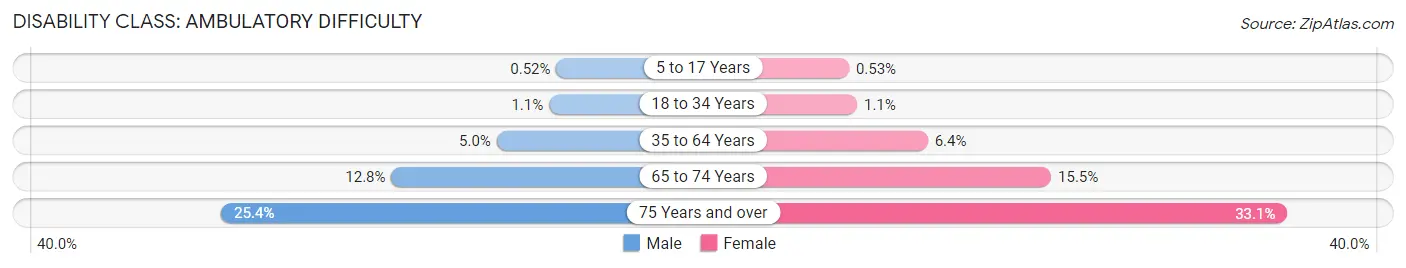
| Age Bracket | Male | Female |
| 5 to 17 Years | 5,571 (0.5%) | 5,414 (0.5%) |
| 18 to 34 Years | 15,272 (1.1%) | 16,177 (1.1%) |
| 35 to 64 Years | 120,130 (5.0%) | 156,868 (6.4%) |
| 65 to 74 Years | 71,648 (12.8%) | 98,463 (15.5%) |
| 75 Years and over | 83,534 (25.4%) | 160,110 (33.1%) |
Disability Class: Self-Care Difficulty
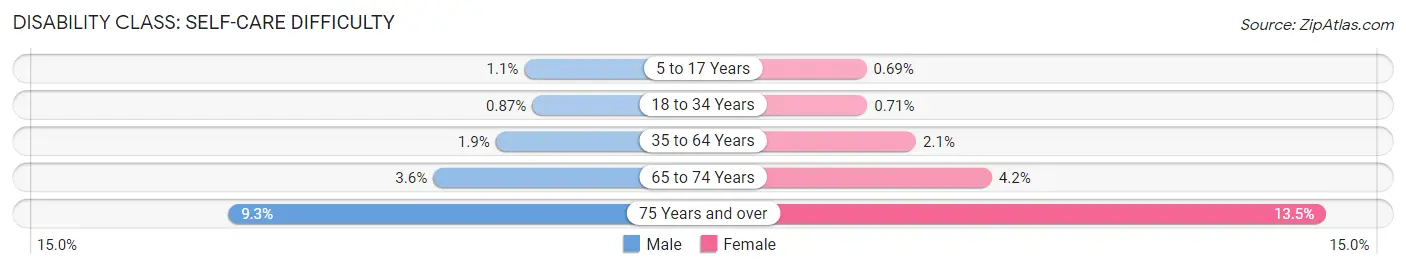
| Age Bracket | Male | Female |
| 5 to 17 Years | 11,682 (1.1%) | 7,095 (0.7%) |
| 18 to 34 Years | 12,604 (0.9%) | 10,161 (0.7%) |
| 35 to 64 Years | 45,721 (1.9%) | 50,847 (2.1%) |
| 65 to 74 Years | 20,368 (3.6%) | 26,489 (4.2%) |
| 75 Years and over | 30,673 (9.3%) | 65,249 (13.5%) |
Technology Access in Illinois
Computing Device Access in Illinois
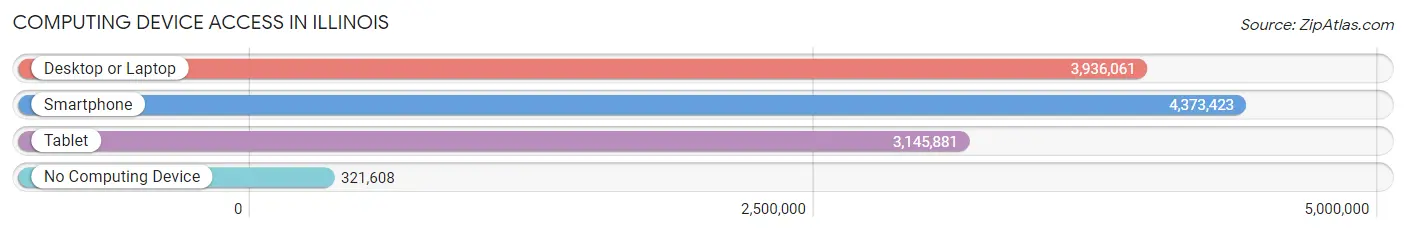
| Device Type | # Households | % Households |
| Desktop or Laptop | 3,936,061 | 79.2% |
| Smartphone | 4,373,423 | 88.0% |
| Tablet | 3,145,881 | 63.3% |
| No Computing Device | 321,608 | 6.5% |
| Total | 4,968,761 | 100.0% |
Internet Access in Illinois
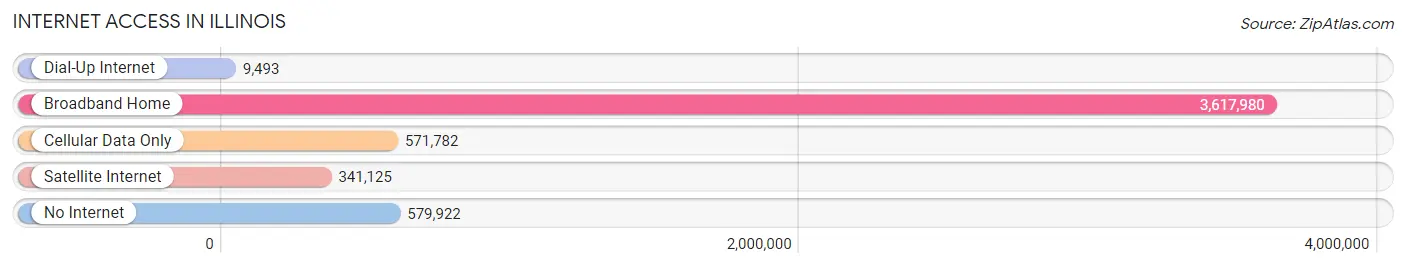
| Internet Type | # Households | % Households |
| Dial-Up Internet | 9,493 | 0.2% |
| Broadband Home | 3,617,980 | 72.8% |
| Cellular Data Only | 571,782 | 11.5% |
| Satellite Internet | 341,125 | 6.9% |
| No Internet | 579,922 | 11.7% |
| Total | 4,968,761 | 100.0% |
Illinois Summary
Illinois is a state located in the Midwestern United States. It is the sixth most populous state in the country and the 25th largest state in terms of land area. Illinois is bordered by Wisconsin to the north, Iowa to the west, Missouri to the south, and Indiana to the east. The state capital is Springfield, and the largest city is Chicago.
History
Illinois was first inhabited by Native American tribes, including the Illiniwek, Miami, and Potawatomi. The first Europeans to explore the area were French explorers in the late 1600s. In 1763, the area became part of the British Empire, and in 1778, the area was ceded to the United States. In 1818, Illinois became the 21st state in the Union.
During the 19th century, Illinois was a major center of immigration, with many immigrants coming from Germany, Ireland, and Scandinavia. The state also experienced a period of industrialization, with the development of the steel and coal industries.
In the 20th century, Illinois was a major center of the civil rights movement, with the city of Chicago becoming a major hub for the movement. The state also experienced a period of economic growth, with the development of the automotive industry and the growth of the Chicago metropolitan area.
Geography
Illinois is located in the Midwestern United States. It is bordered by Wisconsin to the north, Iowa to the west, Missouri to the south, and Indiana to the east. The state has three distinct geographic regions: the Central Plains, the Shawnee Hills, and the Mississippi River Valley.
The Central Plains region is located in the northern part of the state and is characterized by flat terrain and fertile soil. The Shawnee Hills region is located in the southern part of the state and is characterized by rolling hills and forests. The Mississippi River Valley region is located in the western part of the state and is characterized by bluffs and river valleys.
Economy
Illinois has a diverse economy, with a mix of manufacturing, services, and agriculture. The state is a major producer of corn, soybeans, and hogs. It is also a major producer of industrial products, including steel, machinery, and chemicals.
The state is home to several major corporations, including Boeing, Caterpillar, and Motorola. The Chicago metropolitan area is a major center of finance, with the Chicago Board of Trade and the Chicago Mercantile Exchange located in the city.
Demographics
As of the 2010 census, the population of Illinois was 12,830,632. The state is racially diverse, with the largest racial groups being White (68.7%), African American (14.5%), Hispanic or Latino (14.4%), and Asian (5.3%).
The state is also religiously diverse, with the largest religious groups being Catholic (27.2%), Protestant (25.2%), and Other (7.2%). The median household income in the state is $60,960, and the median home value is $183,400.
Common Questions
When was Illinois Incorporated?
Illinois was Incorporated into the Union on Dec 3, 1818.
What is the Total Area of Illinois?
Total Area of Illinois is 57,916 Square Miles.
What is the Total Land Area of Illinois?
Total Land Area of Illinois is 55,518 Square Miles.
What is the Total Water Area of Illinois?
Total Water Area of Illinois is 2,398 Square Miles.
What is the Average Elevation in Illinois?
Average Elevation in Illinois is 600 Feet.
What is the Highest Elevation in Illinois?
Highest Elevation in Illinois is 1,235 Feet.
What is the Lowest Elevation in Illinois?
Lowest Elevation in Illinois is 279 Feet.
What is the Population Density in Illinois?
Population Density in Illinois is 229.8 People per Square Mile.
What is Per Capita Income in Illinois?
Per Capita income in Illinois is $43,198.
What is the Median Family Income in Illinois?
Median Family Income in Illinois is $99,215.
What is the Median Household income in Illinois?
Median Household Income in Illinois is $78,433.
What is Income or Wage Gap in Illinois?
Income or Wage Gap in Illinois is 29.6%.
Women in Illinois earn 70.4 cents for every dollar earned by a man.
What is Family Income Deficit in Illinois?
Family Income Deficit in Illinois is $11,242.
Families that are below poverty line in Illinois earn $11,242 less on average than the poverty threshold level.
What is Inequality or Gini Index in Illinois?
Inequality or Gini Index in Illinois is 0.48.
What is the Total Population of Illinois?
Total Population of Illinois is 12,757,634.
What is the Total Male Population of Illinois?
Total Male Population of Illinois is 6,313,019.
What is the Total Female Population of Illinois?
Total Female Population of Illinois is 6,444,615.
What is the Ratio of Males per 100 Females in Illinois?
There are 97.96 Males per 100 Females in Illinois.
What is the Ratio of Females per 100 Males in Illinois?
There are 102.08 Females per 100 Males in Illinois.
What is the Median Population Age in Illinois?
Median Population Age in Illinois is 38.7 Years.
What is the Average Family Size in Illinois
Average Family Size in Illinois is 3.2 People.
What is the Average Household Size in Illinois
Average Household Size in Illinois is 2.5 People.
How Large is the Labor Force in Illinois?
There are 6,698,657 People in the Labor Forcein in Illinois.
What is the Percentage of People in the Labor Force in Illinois?
65.2% of People are in the Labor Force in Illinois.
What is the Unemployment Rate in Illinois?
Unemployment Rate in Illinois is 6.0%.