Challenge Brownsville, CA Map & Demographics
Challenge Brownsville Map
Challenge Brownsville Overview
$35,542
PER CAPITA INCOME
$96,444
AVG FAMILY INCOME
$89,866
AVG HOUSEHOLD INCOME
0.30
INEQUALITY / GINI INDEX
866
TOTAL POPULATION
301
MALE POPULATION
565
FEMALE POPULATION
53.27
MALES / 100 FEMALES
187.71
FEMALES / 100 MALES
53.5
MEDIAN AGE
2.3
AVG FAMILY SIZE
2.1
AVG HOUSEHOLD SIZE
212
LABOR FORCE [ PEOPLE ]
30.6%
PERCENT IN LABOR FORCE
3.3%
UNEMPLOYMENT RATE
Income in Challenge Brownsville
Income Overview in Challenge Brownsville
Per Capita Income in Challenge Brownsville is $35,542, while median incomes of families and households are $96,444 and $89,866 respectively.
| Characteristic | Number | Measure |
| Per Capita Income | 866 | $35,542 |
| Median Family Income | 270 | $96,444 |
| Mean Family Income | 270 | $82,122 |
| Median Household Income | 413 | $89,866 |
| Mean Household Income | 413 | $73,866 |
| Income Deficit | 270 | $0 |
| Wage / Income Gap (%) | 866 | 0.00% |
| Wage / Income Gap ($) | 866 | 100.00¢ per $1 |
| Gini / Inequality Index | 866 | 0.30 |
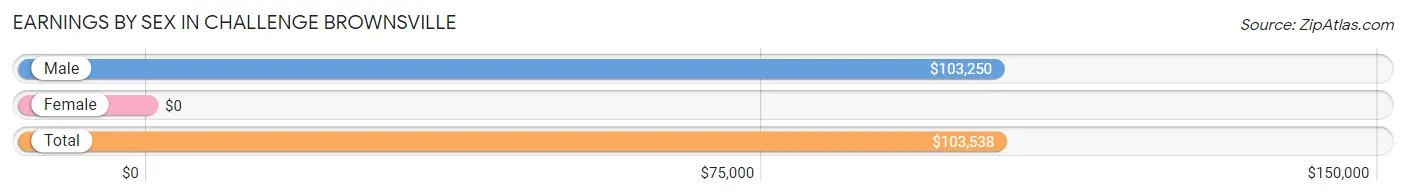
Earnings by Sex in Challenge Brownsville
| Sex | Number | Average Earnings |
| Male | 182 (85.9%) | $103,250 |
| Female | 30 (14.1%) | $0 |
| Total | 212 (100.0%) | $103,538 |
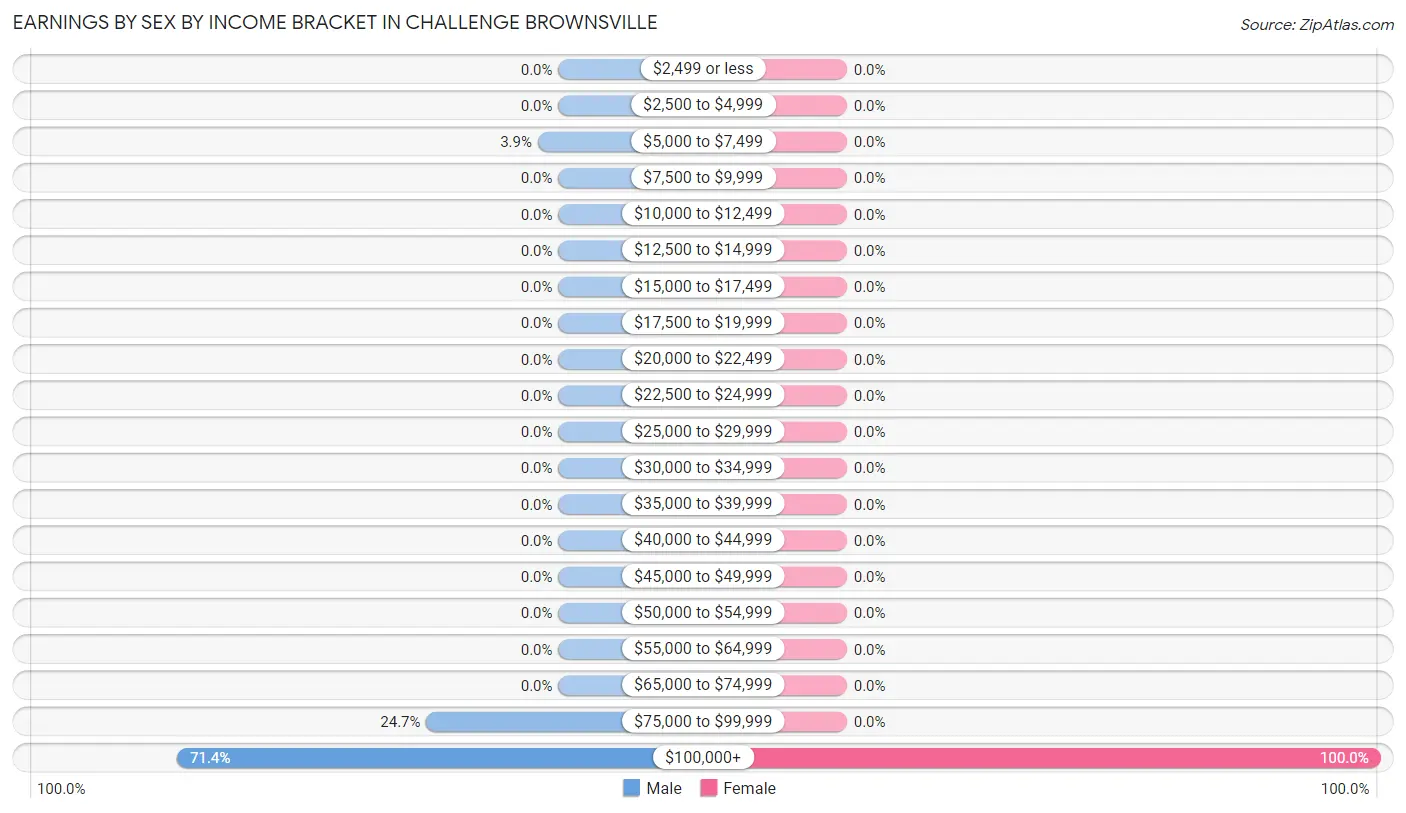
Earnings by Sex by Income Bracket in Challenge Brownsville
The most common earnings brackets in Challenge Brownsville are $100,000+ for men (130 | 71.4%) and $100,000+ for women (30 | 100.0%).
| Income | Male | Female |
| $2,499 or less | 0 (0.0%) | 0 (0.0%) |
| $2,500 to $4,999 | 0 (0.0%) | 0 (0.0%) |
| $5,000 to $7,499 | 7 (3.8%) | 0 (0.0%) |
| $7,500 to $9,999 | 0 (0.0%) | 0 (0.0%) |
| $10,000 to $12,499 | 0 (0.0%) | 0 (0.0%) |
| $12,500 to $14,999 | 0 (0.0%) | 0 (0.0%) |
| $15,000 to $17,499 | 0 (0.0%) | 0 (0.0%) |
| $17,500 to $19,999 | 0 (0.0%) | 0 (0.0%) |
| $20,000 to $22,499 | 0 (0.0%) | 0 (0.0%) |
| $22,500 to $24,999 | 0 (0.0%) | 0 (0.0%) |
| $25,000 to $29,999 | 0 (0.0%) | 0 (0.0%) |
| $30,000 to $34,999 | 0 (0.0%) | 0 (0.0%) |
| $35,000 to $39,999 | 0 (0.0%) | 0 (0.0%) |
| $40,000 to $44,999 | 0 (0.0%) | 0 (0.0%) |
| $45,000 to $49,999 | 0 (0.0%) | 0 (0.0%) |
| $50,000 to $54,999 | 0 (0.0%) | 0 (0.0%) |
| $55,000 to $64,999 | 0 (0.0%) | 0 (0.0%) |
| $65,000 to $74,999 | 0 (0.0%) | 0 (0.0%) |
| $75,000 to $99,999 | 45 (24.7%) | 0 (0.0%) |
| $100,000+ | 130 (71.4%) | 30 (100.0%) |
| Total | 182 (100.0%) | 30 (100.0%) |
Earnings by Sex by Educational Attainment in Challenge Brownsville
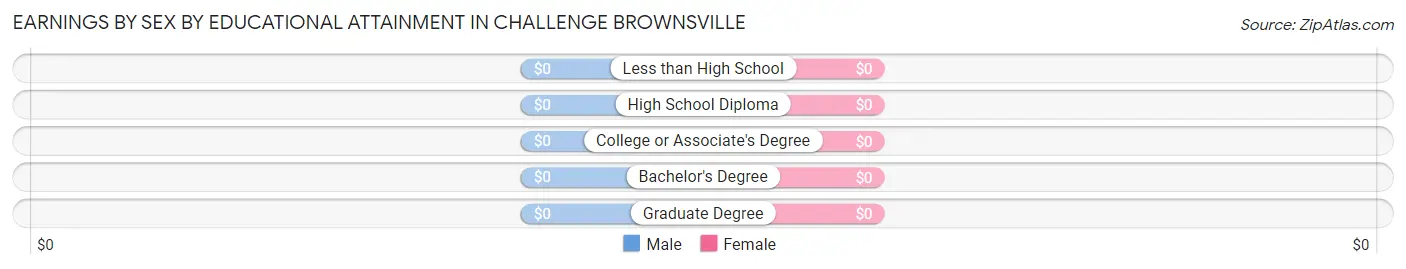
| Educational Attainment | Male Income | Female Income |
| Less than High School | - | - |
| High School Diploma | - | - |
| College or Associate's Degree | - | - |
| Bachelor's Degree | - | - |
| Graduate Degree | - | - |
| Total | $103,317 | $0 |
Family Income in Challenge Brownsville
Family Income Brackets in Challenge Brownsville
According to the Challenge Brownsville family income data, there are 116 families falling into the $100,000 to $149,999 income range, which is the most common income bracket and makes up 43.0% of all families.
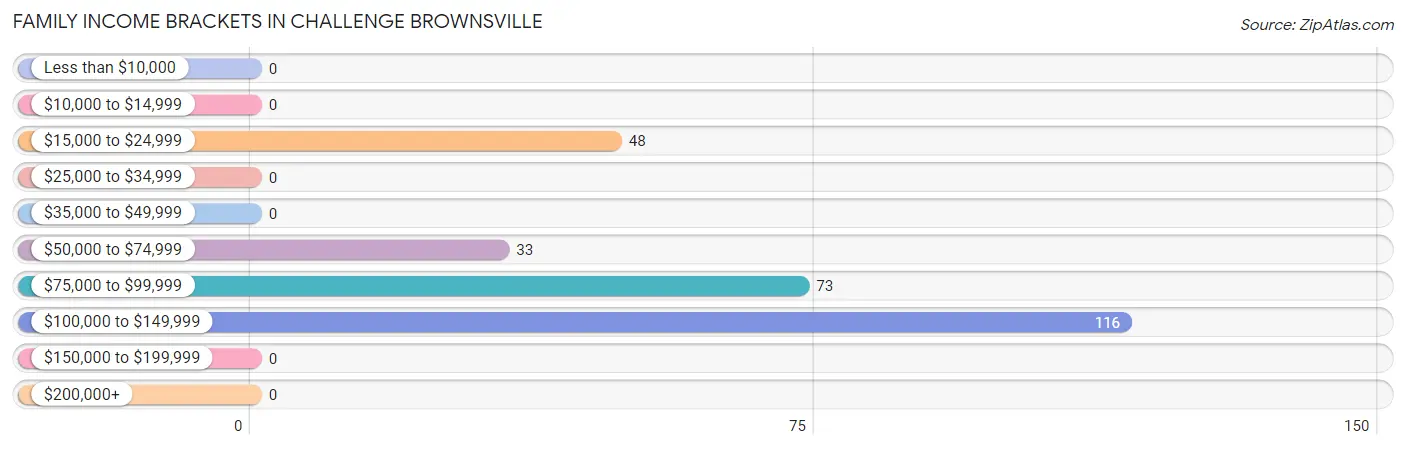
| Income Bracket | # Families | % Families |
| Less than $10,000 | 0 | 0.0% |
| $10,000 to $14,999 | 0 | 0.0% |
| $15,000 to $24,999 | 48 | 17.8% |
| $25,000 to $34,999 | 0 | 0.0% |
| $35,000 to $49,999 | 0 | 0.0% |
| $50,000 to $74,999 | 33 | 12.2% |
| $75,000 to $99,999 | 73 | 27.0% |
| $100,000 to $149,999 | 116 | 43.0% |
| $150,000 to $199,999 | 0 | 0.0% |
| $200,000+ | 0 | 0.0% |
Family Income by Famaliy Size in Challenge Brownsville
2-person families (270 | 100.0%) account for the highest median family income in Challenge Brownsville with $96,444 per family, while 2-person families (270 | 100.0%) have the highest median income of $48,222 per family member.
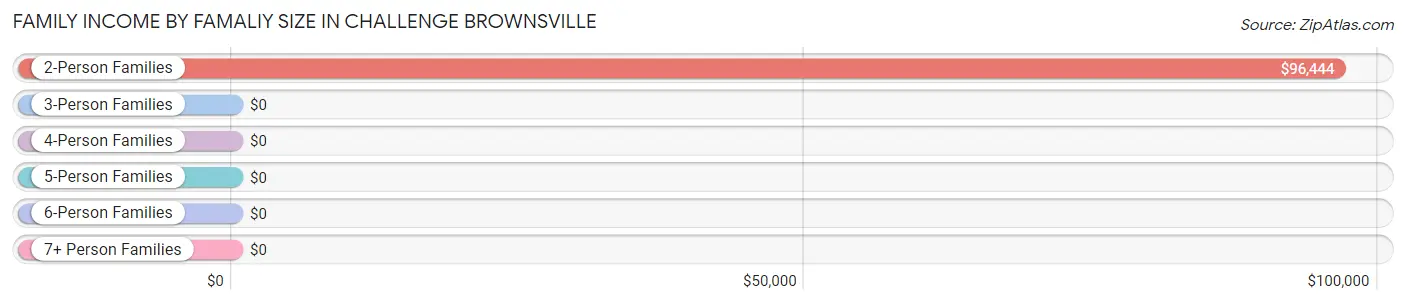
| Income Bracket | # Families | Median Income |
| 2-Person Families | 270 (100.0%) | $96,444 |
| 3-Person Families | 0 (0.0%) | $0 |
| 4-Person Families | 0 (0.0%) | $0 |
| 5-Person Families | 0 (0.0%) | $0 |
| 6-Person Families | 0 (0.0%) | $0 |
| 7+ Person Families | 0 (0.0%) | $0 |
| Total | 270 (100.0%) | $96,444 |
Family Income by Number of Earners in Challenge Brownsville
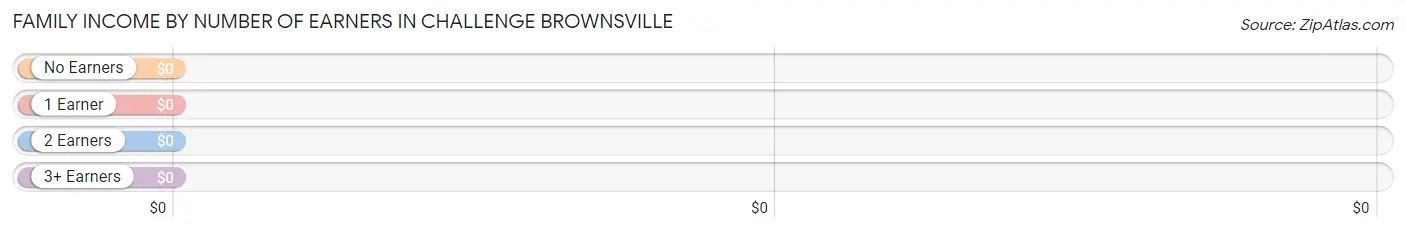
| Number of Earners | # Families | Median Income |
| No Earners | 109 (40.4%) | $0 |
| 1 Earner | 161 (59.6%) | $0 |
| 2 Earners | 0 (0.0%) | $0 |
| 3+ Earners | 0 (0.0%) | $0 |
| Total | 270 (100.0%) | $96,444 |
Household Income in Challenge Brownsville
Household Income Brackets in Challenge Brownsville
With 160 households falling in the category, the $100,000 to $149,999 income range is the most frequent in Challenge Brownsville, accounting for 38.7% of all households.
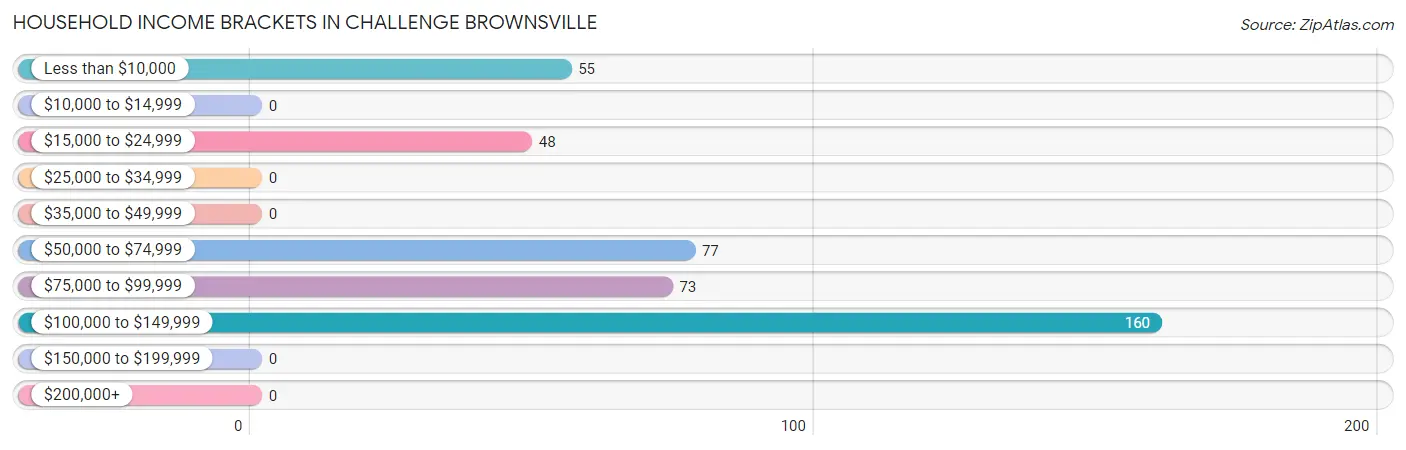
| Income Bracket | # Households | % Households |
| Less than $10,000 | 55 | 13.3% |
| $10,000 to $14,999 | 0 | 0.0% |
| $15,000 to $24,999 | 48 | 11.6% |
| $25,000 to $34,999 | 0 | 0.0% |
| $35,000 to $49,999 | 0 | 0.0% |
| $50,000 to $74,999 | 77 | 18.6% |
| $75,000 to $99,999 | 73 | 17.7% |
| $100,000 to $149,999 | 160 | 38.7% |
| $150,000 to $199,999 | 0 | 0.0% |
| $200,000+ | 0 | 0.0% |
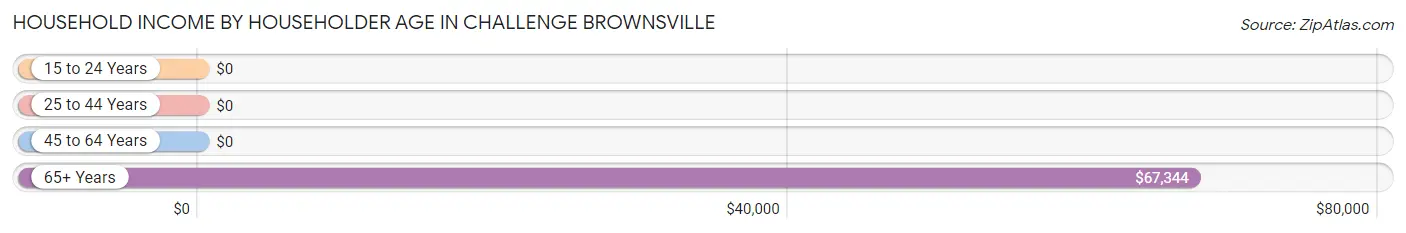
Household Income by Householder Age in Challenge Brownsville
The median household income in Challenge Brownsville is $89,866, with the highest median household income of $67,344 found in the 65+ years age bracket for the primary householder. A total of 90 households (21.8%) fall into this category.
| Income Bracket | # Households | Median Income |
| 15 to 24 Years | 0 (0.0%) | $0 |
| 25 to 44 Years | 116 (28.1%) | $0 |
| 45 to 64 Years | 207 (50.1%) | $0 |
| 65+ Years | 90 (21.8%) | $67,344 |
| Total | 413 (100.0%) | $89,866 |
Poverty in Challenge Brownsville
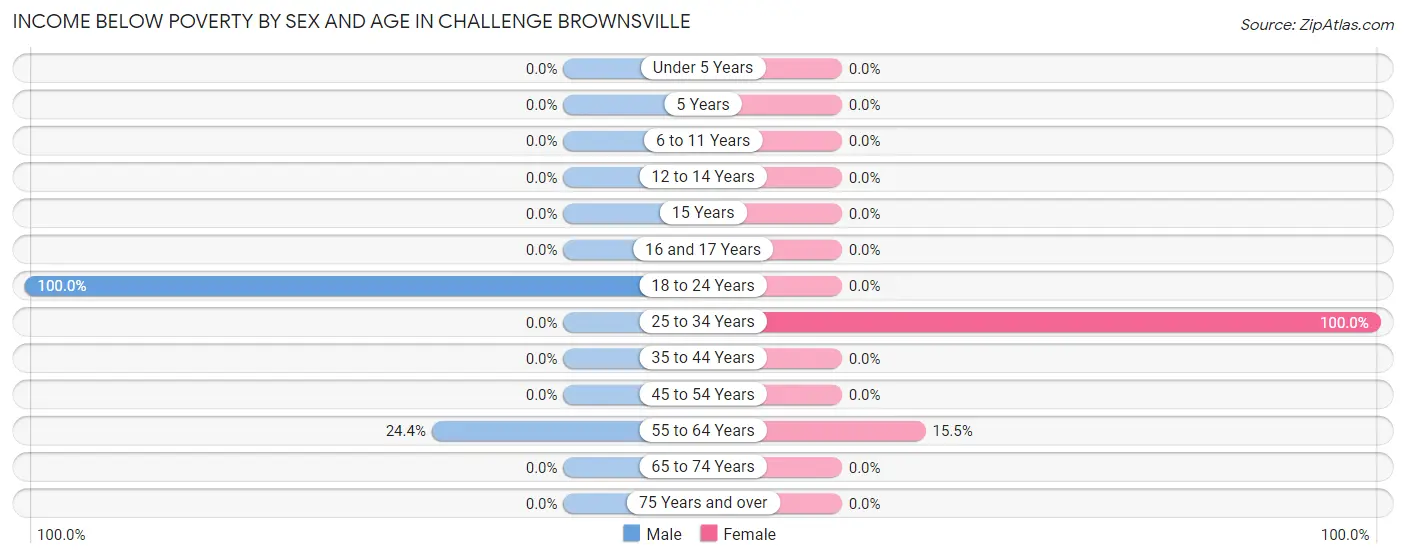
Income Below Poverty by Sex and Age in Challenge Brownsville
With 13.0% poverty level for males and 23.0% for females among the residents of Challenge Brownsville, 18 to 24 year old males and 25 to 34 year old females are the most vulnerable to poverty, with 7 males (100.0%) and 107 females (100.0%) in their respective age groups living below the poverty level.
| Age Bracket | Male | Female |
| Under 5 Years | 0 (0.0%) | 0 (0.0%) |
| 5 Years | 0 (0.0%) | 0 (0.0%) |
| 6 to 11 Years | 0 (0.0%) | 0 (0.0%) |
| 12 to 14 Years | 0 (0.0%) | 0 (0.0%) |
| 15 Years | 0 (0.0%) | 0 (0.0%) |
| 16 and 17 Years | 0 (0.0%) | 0 (0.0%) |
| 18 to 24 Years | 7 (100.0%) | 0 (0.0%) |
| 25 to 34 Years | 0 (0.0%) | 107 (100.0%) |
| 35 to 44 Years | 0 (0.0%) | 0 (0.0%) |
| 45 to 54 Years | 0 (0.0%) | 0 (0.0%) |
| 55 to 64 Years | 32 (24.4%) | 23 (15.5%) |
| 65 to 74 Years | 0 (0.0%) | 0 (0.0%) |
| 75 Years and over | 0 (0.0%) | 0 (0.0%) |
| Total | 39 (13.0%) | 130 (23.0%) |
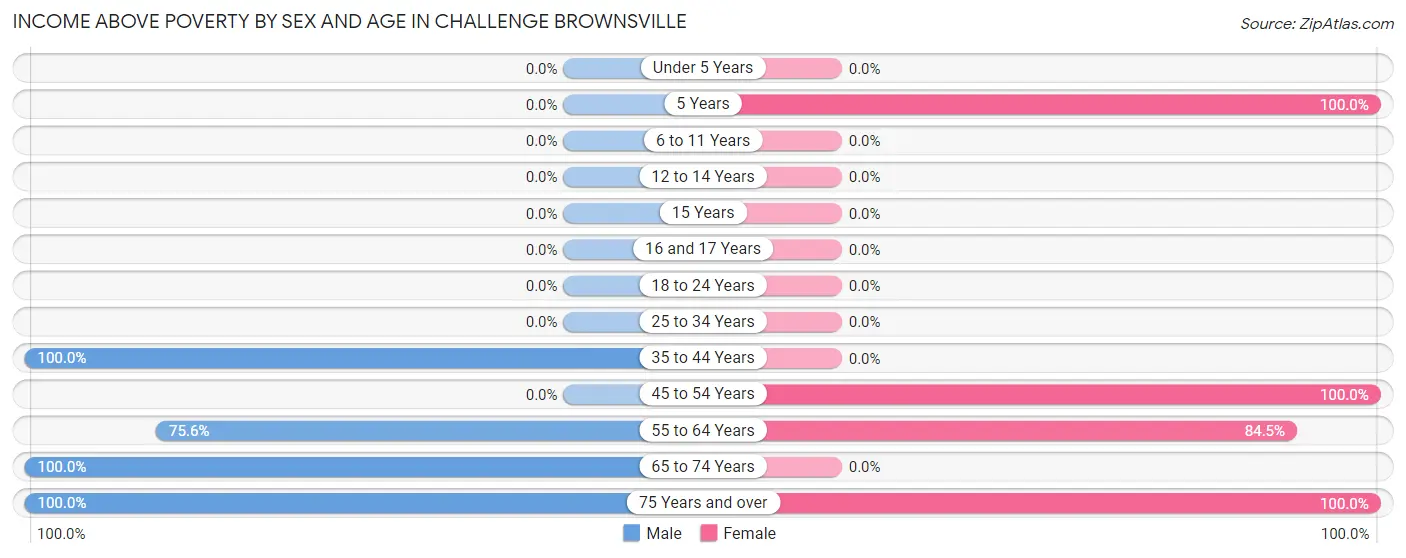
Income Above Poverty by Sex and Age in Challenge Brownsville
According to the poverty statistics in Challenge Brownsville, males aged 35 to 44 years and females aged 5 years are the age groups that are most secure financially, with 100.0% of males and 100.0% of females in these age groups living above the poverty line.
| Age Bracket | Male | Female |
| Under 5 Years | 0 (0.0%) | 0 (0.0%) |
| 5 Years | 0 (0.0%) | 174 (100.0%) |
| 6 to 11 Years | 0 (0.0%) | 0 (0.0%) |
| 12 to 14 Years | 0 (0.0%) | 0 (0.0%) |
| 15 Years | 0 (0.0%) | 0 (0.0%) |
| 16 and 17 Years | 0 (0.0%) | 0 (0.0%) |
| 18 to 24 Years | 0 (0.0%) | 0 (0.0%) |
| 25 to 34 Years | 0 (0.0%) | 0 (0.0%) |
| 35 to 44 Years | 116 (100.0%) | 0 (0.0%) |
| 45 to 54 Years | 0 (0.0%) | 88 (100.0%) |
| 55 to 64 Years | 99 (75.6%) | 125 (84.5%) |
| 65 to 74 Years | 42 (100.0%) | 0 (0.0%) |
| 75 Years and over | 5 (100.0%) | 48 (100.0%) |
| Total | 262 (87.0%) | 435 (77.0%) |
Income Below Poverty Among Married-Couple Families in Challenge Brownsville
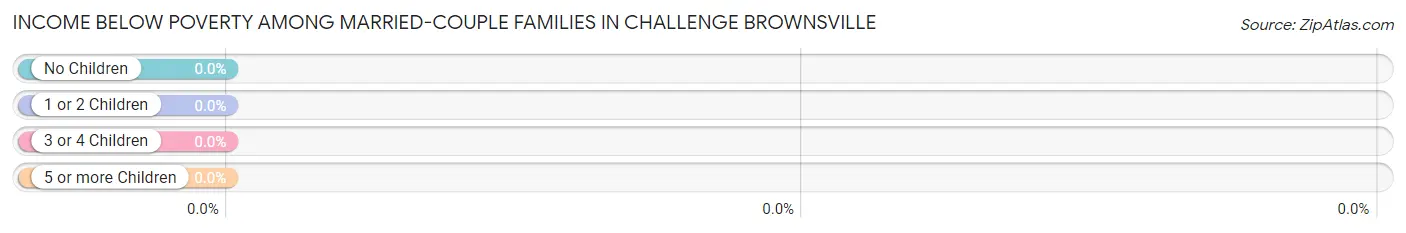
| Children | Above Poverty | Below Poverty |
| No Children | 154 (100.0%) | 0 (0.0%) |
| 1 or 2 Children | 0 (0.0%) | 0 (0.0%) |
| 3 or 4 Children | 0 (0.0%) | 0 (0.0%) |
| 5 or more Children | 0 (0.0%) | 0 (0.0%) |
| Total | 154 (100.0%) | 0 (0.0%) |
Income Below Poverty Among Single-Parent Households in Challenge Brownsville
| Children | Single Father | Single Mother |
| No Children | 0 (0.0%) | 0 (0.0%) |
| 1 or 2 Children | 0 (0.0%) | 0 (0.0%) |
| 3 or 4 Children | 0 (0.0%) | 0 (0.0%) |
| 5 or more Children | 0 (0.0%) | 0 (0.0%) |
| Total | 0 (0.0%) | 0 (0.0%) |
Income Below Poverty Among Married-Couple vs Single-Parent Households in Challenge Brownsville
| Children | Married-Couple Families | Single-Parent Households |
| No Children | 0 (0.0%) | 0 (0.0%) |
| 1 or 2 Children | 0 (0.0%) | 0 (0.0%) |
| 3 or 4 Children | 0 (0.0%) | 0 (0.0%) |
| 5 or more Children | 0 (0.0%) | 0 (0.0%) |
| Total | 0 (0.0%) | 0 (0.0%) |
Race in Challenge Brownsville
The most populous races in Challenge Brownsville are White / Caucasian (836 | 96.5%), Hispanic or Latino (23 | 2.7%), and Two or more Races (23 | 2.7%).
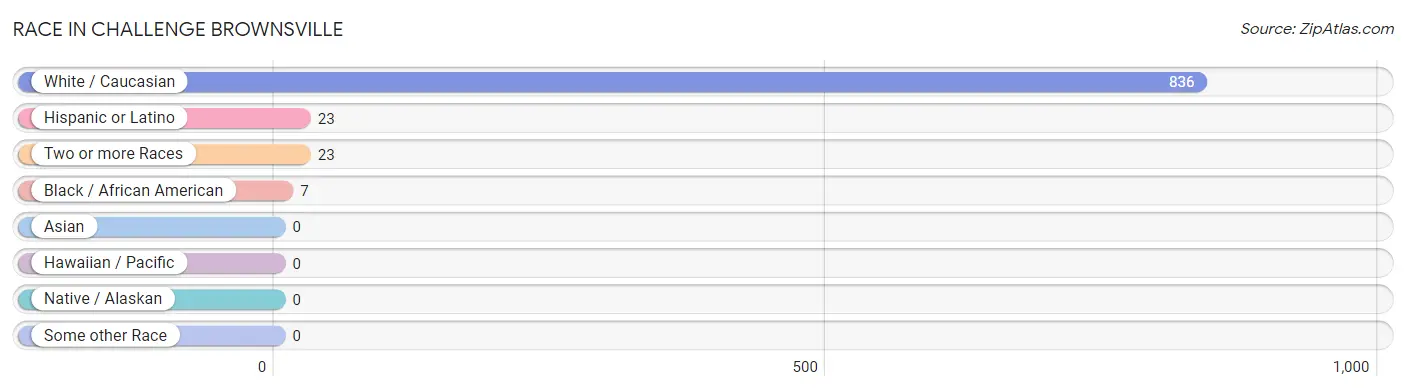
| Race | # Population | % Population |
| Asian | 0 | 0.0% |
| Black / African American | 7 | 0.8% |
| Hawaiian / Pacific | 0 | 0.0% |
| Hispanic or Latino | 23 | 2.7% |
| Native / Alaskan | 0 | 0.0% |
| White / Caucasian | 836 | 96.5% |
| Two or more Races | 23 | 2.7% |
| Some other Race | 0 | 0.0% |
| Total | 866 | 100.0% |
Ancestry in Challenge Brownsville
The most populous ancestries reported in Challenge Brownsville are German (207 | 23.9%), Irish (119 | 13.7%), Swedish (102 | 11.8%), English (54 | 6.2%), and Czech (44 | 5.1%), together accounting for 60.7% of all Challenge Brownsville residents.
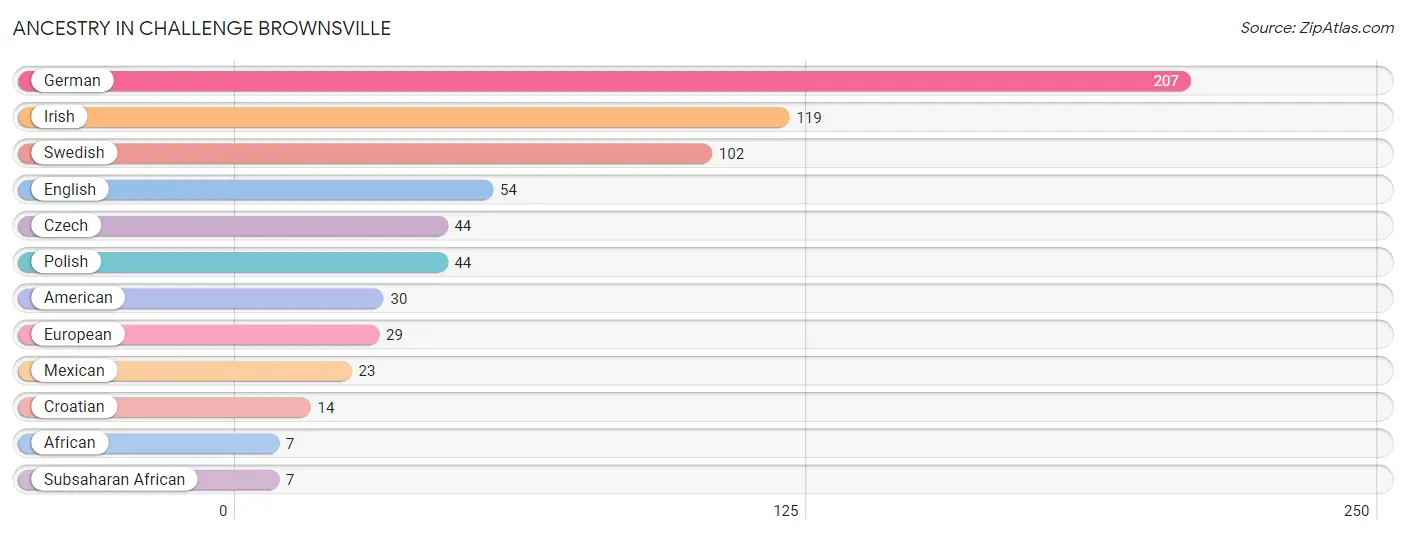
| Ancestry | # Population | % Population |
| African | 7 | 0.8% |
| American | 30 | 3.5% |
| Croatian | 14 | 1.6% |
| Czech | 44 | 5.1% |
| English | 54 | 6.2% |
| European | 29 | 3.4% |
| German | 207 | 23.9% |
| Irish | 119 | 13.7% |
| Mexican | 23 | 2.7% |
| Polish | 44 | 5.1% |
| Subsaharan African | 7 | 0.8% |
| Swedish | 102 | 11.8% | View All 12 Rows |
Immigrants in Challenge Brownsville
The most numerous immigrant groups reported in Challenge Brownsville came from Europe (29 | 3.4%), Central America (23 | 2.7%), Latin America (23 | 2.7%), and Mexico (23 | 2.7%), together accounting for 11.3% of all Challenge Brownsville residents.
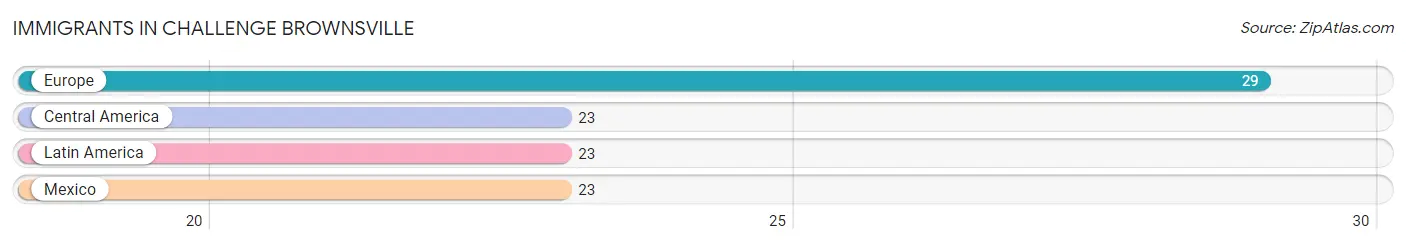
| Immigration Origin | # Population | % Population |
| Central America | 23 | 2.7% |
| Europe | 29 | 3.4% |
| Latin America | 23 | 2.7% |
| Mexico | 23 | 2.7% | View All 4 Rows |
Sex and Age in Challenge Brownsville
Sex and Age in Challenge Brownsville
The most populous age groups in Challenge Brownsville are 55 to 59 Years (131 | 43.5%) for men and 5 to 9 Years (174 | 30.8%) for women.
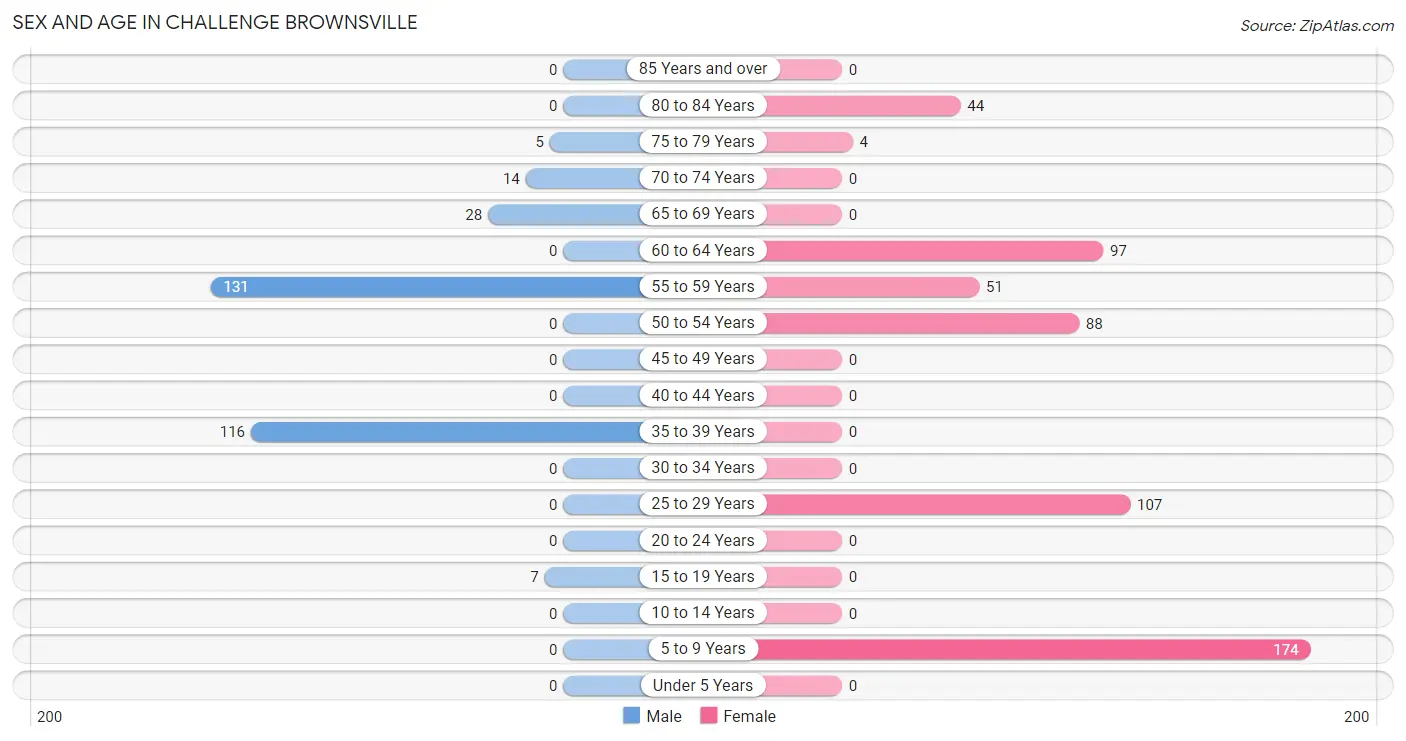
| Age Bracket | Male | Female |
| Under 5 Years | 0 (0.0%) | 0 (0.0%) |
| 5 to 9 Years | 0 (0.0%) | 174 (30.8%) |
| 10 to 14 Years | 0 (0.0%) | 0 (0.0%) |
| 15 to 19 Years | 7 (2.3%) | 0 (0.0%) |
| 20 to 24 Years | 0 (0.0%) | 0 (0.0%) |
| 25 to 29 Years | 0 (0.0%) | 107 (18.9%) |
| 30 to 34 Years | 0 (0.0%) | 0 (0.0%) |
| 35 to 39 Years | 116 (38.5%) | 0 (0.0%) |
| 40 to 44 Years | 0 (0.0%) | 0 (0.0%) |
| 45 to 49 Years | 0 (0.0%) | 0 (0.0%) |
| 50 to 54 Years | 0 (0.0%) | 88 (15.6%) |
| 55 to 59 Years | 131 (43.5%) | 51 (9.0%) |
| 60 to 64 Years | 0 (0.0%) | 97 (17.2%) |
| 65 to 69 Years | 28 (9.3%) | 0 (0.0%) |
| 70 to 74 Years | 14 (4.6%) | 0 (0.0%) |
| 75 to 79 Years | 5 (1.7%) | 4 (0.7%) |
| 80 to 84 Years | 0 (0.0%) | 44 (7.8%) |
| 85 Years and over | 0 (0.0%) | 0 (0.0%) |
| Total | 301 (100.0%) | 565 (100.0%) |
Families and Households in Challenge Brownsville
Median Family Size in Challenge Brownsville
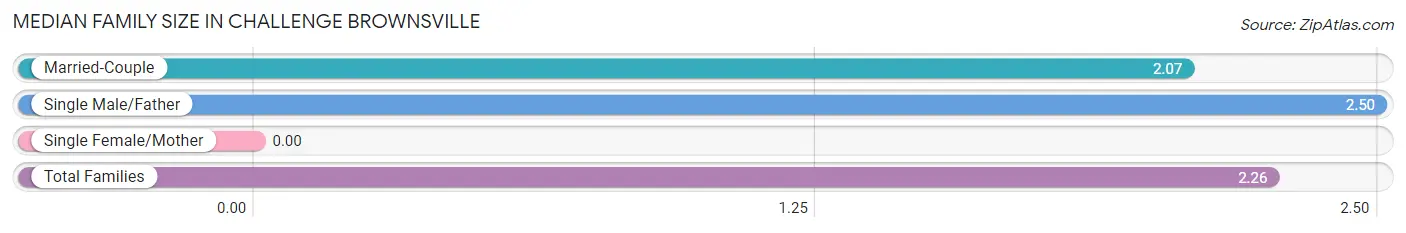
| Family Type | # Families | Family Size |
| Married-Couple | 154 (57.0%) | 2.07 |
| Single Male/Father | 116 (43.0%) | 2.50 |
| Single Female/Mother | 0 (0.0%) | - |
| Total Families | 270 (100.0%) | 2.26 |
Median Household Size in Challenge Brownsville
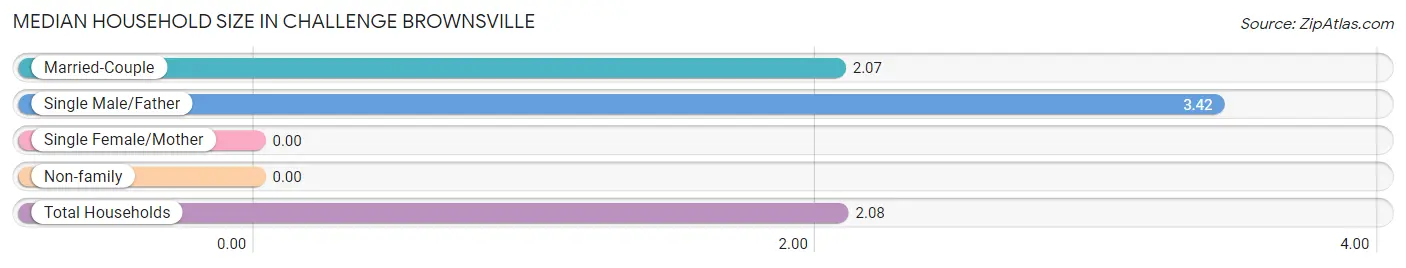
| Household Type | # Households | Household Size |
| Married-Couple | 154 (37.3%) | 2.07 |
| Single Male/Father | 116 (28.1%) | 3.42 |
| Single Female/Mother | 0 (0.0%) | - |
| Non-family | 143 (34.6%) | - |
| Total Households | 413 (100.0%) | 2.08 |
Household Size by Marriage Status in Challenge Brownsville
Out of a total of 413 households in Challenge Brownsville, 270 (65.4%) are family households, while 143 (34.6%) are nonfamily households. The most numerous type of family households are 2-person households, comprising 154, and the most common type of nonfamily households are 1-person households, comprising 143.
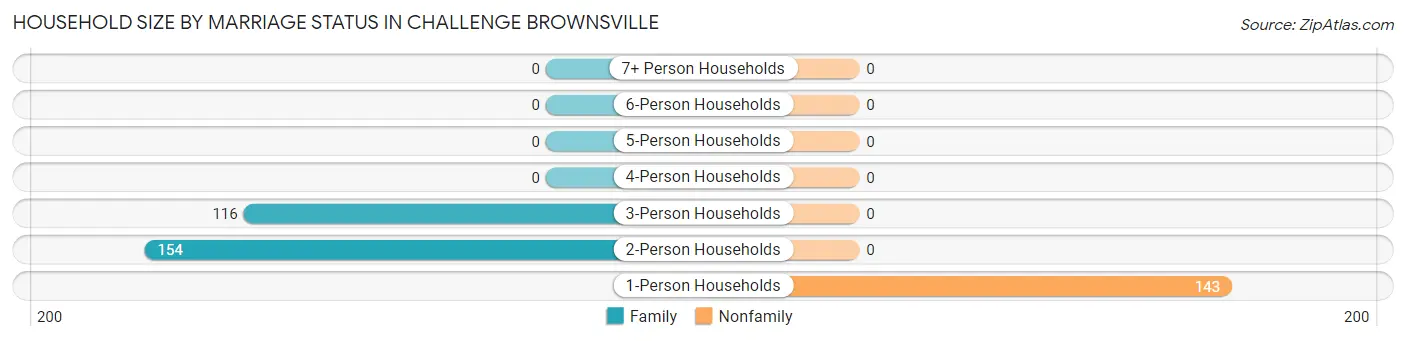
| Household Size | Family Households | Nonfamily Households |
| 1-Person Households | - | 143 (34.6%) |
| 2-Person Households | 154 (37.3%) | 0 (0.0%) |
| 3-Person Households | 116 (28.1%) | 0 (0.0%) |
| 4-Person Households | 0 (0.0%) | 0 (0.0%) |
| 5-Person Households | 0 (0.0%) | 0 (0.0%) |
| 6-Person Households | 0 (0.0%) | 0 (0.0%) |
| 7+ Person Households | 0 (0.0%) | 0 (0.0%) |
| Total | 270 (65.4%) | 143 (34.6%) |
Female Fertility in Challenge Brownsville
Fertility by Age in Challenge Brownsville
| Age Bracket | Women with Births | Births / 1,000 Women |
| 15 to 19 years | 0 (0.0%) | 0.0 |
| 20 to 34 years | 0 (0.0%) | 0.0 |
| 35 to 50 years | 0 (0.0%) | 0.0 |
| Total | 0 (0.0%) | 0.0 |
Fertility by Age by Marriage Status in Challenge Brownsville
| Age Bracket | Married | Unmarried |
| 15 to 19 years | 0 (0.0%) | 0 (0.0%) |
| 20 to 34 years | 0 (0.0%) | 0 (0.0%) |
| 35 to 50 years | 0 (0.0%) | 0 (0.0%) |
| Total | 0 (0.0%) | 0 (0.0%) |
Fertility by Education in Challenge Brownsville
| Educational Attainment | Women with Births | Births / 1,000 Women |
| Less than High School | 0 (0.0%) | 0.0 |
| High School Diploma | 0 (0.0%) | 0.0 |
| College or Associate's Degree | 0 (0.0%) | 0.0 |
| Bachelor's Degree | 0 (0.0%) | 0.0 |
| Graduate Degree | 0 (0.0%) | 0.0 |
| Total | 0 (0.0%) | 0.0 |
Fertility by Education by Marriage Status in Challenge Brownsville
| Educational Attainment | Married | Unmarried |
| Less than High School | 0 (0.0%) | 0 (0.0%) |
| High School Diploma | 0 (0.0%) | 0 (0.0%) |
| College or Associate's Degree | 0 (0.0%) | 0 (0.0%) |
| Bachelor's Degree | 0 (0.0%) | 0 (0.0%) |
| Graduate Degree | 0 (0.0%) | 0 (0.0%) |
| Total | 0 (0.0%) | 0 (0.0%) |
Employment Characteristics in Challenge Brownsville
Employment by Class of Employer in Challenge Brownsville
Among the 205 employed individuals in Challenge Brownsville, private company employees (130 | 63.4%), local government employees (45 | 22.0%), and federal government employees (30 | 14.6%) make up the most common classes of employment.
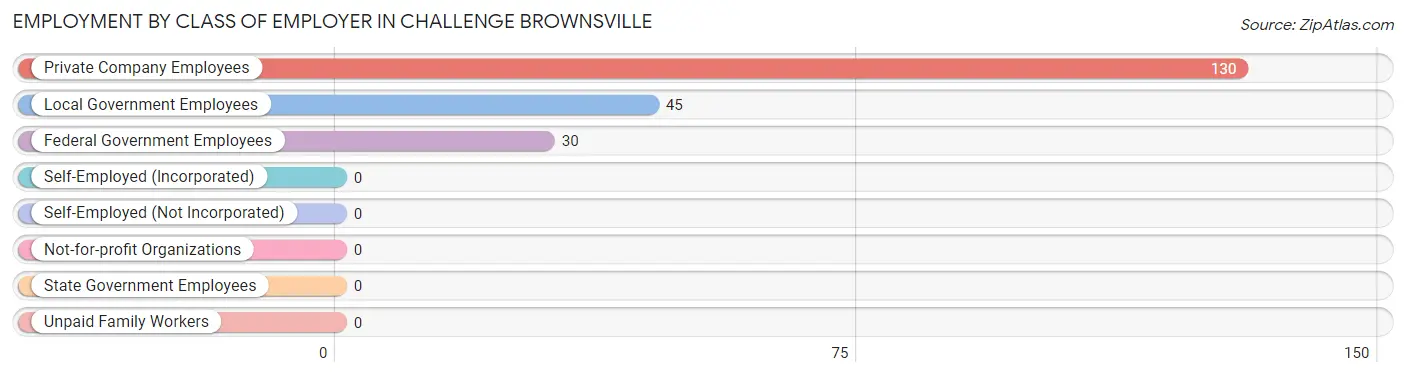
| Employer Class | # Employees | % Employees |
| Private Company Employees | 130 | 63.4% |
| Self-Employed (Incorporated) | 0 | 0.0% |
| Self-Employed (Not Incorporated) | 0 | 0.0% |
| Not-for-profit Organizations | 0 | 0.0% |
| Local Government Employees | 45 | 22.0% |
| State Government Employees | 0 | 0.0% |
| Federal Government Employees | 30 | 14.6% |
| Unpaid Family Workers | 0 | 0.0% |
| Total | 205 | 100.0% |
Employment Status by Age in Challenge Brownsville
According to the labor force statistics for Challenge Brownsville, out of the total population over 16 years of age (692), 30.6% or 212 individuals are in the labor force, with 3.3% or 7 of them unemployed. The age group with the highest labor force participation rate is 16 to 19 years, with 100.0% or 7 individuals in the labor force. Within the labor force, the 16 to 19 years age range has the highest percentage of unemployed individuals, with 100.0% or 7 of them being unemployed.
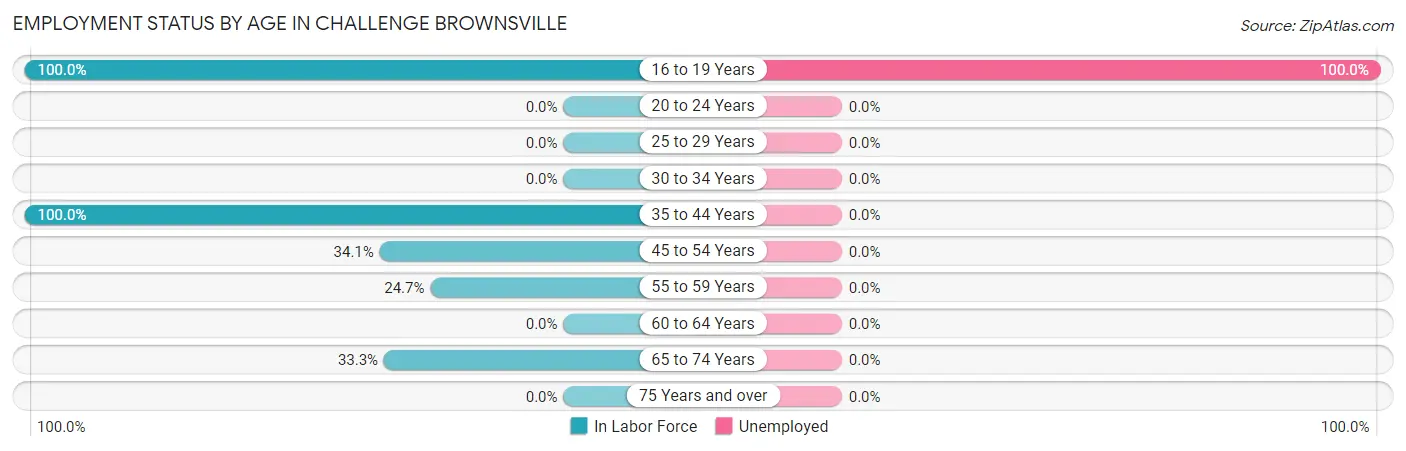
| Age Bracket | In Labor Force | Unemployed |
| 16 to 19 Years | 7 (100.0%) | 7 (100.0%) |
| 20 to 24 Years | 0 (0.0%) | 0 (0.0%) |
| 25 to 29 Years | 0 (0.0%) | 0 (0.0%) |
| 30 to 34 Years | 0 (0.0%) | 0 (0.0%) |
| 35 to 44 Years | 116 (100.0%) | 0 (0.0%) |
| 45 to 54 Years | 30 (34.1%) | 0 (0.0%) |
| 55 to 59 Years | 45 (24.7%) | 0 (0.0%) |
| 60 to 64 Years | 0 (0.0%) | 0 (0.0%) |
| 65 to 74 Years | 14 (33.3%) | 0 (0.0%) |
| 75 Years and over | 0 (0.0%) | 0 (0.0%) |
| Total | 212 (30.6%) | 7 (3.3%) |
Employment Status by Educational Attainment in Challenge Brownsville
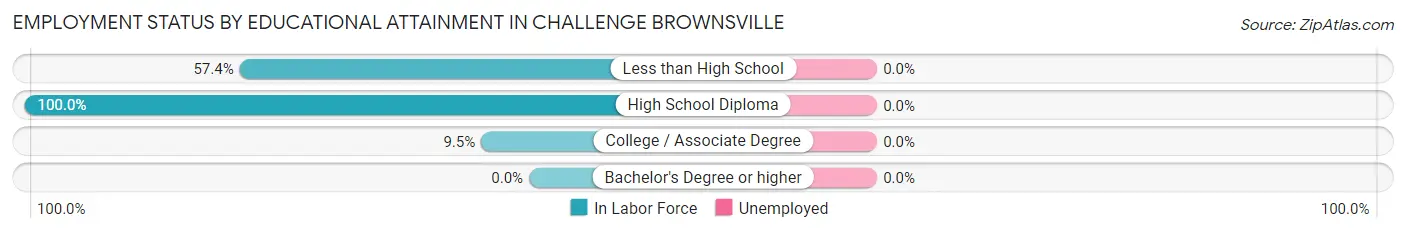
| Educational Attainment | In Labor Force | Unemployed |
| Less than High School | 116 (57.4%) | 0 (0.0%) |
| High School Diploma | 45 (100.0%) | 0 (0.0%) |
| College / Associate Degree | 30 (9.5%) | 0 (0.0%) |
| Bachelor's Degree or higher | 0 (0.0%) | 0 (0.0%) |
| Total | 191 (32.4%) | 0 (0.0%) |
Employment Occupations by Sex in Challenge Brownsville
Management, Business, Science and Arts Occupations
The most common Management, Business, Science and Arts occupations in Challenge Brownsville are , and Business & Financial (30 | 14.6%).
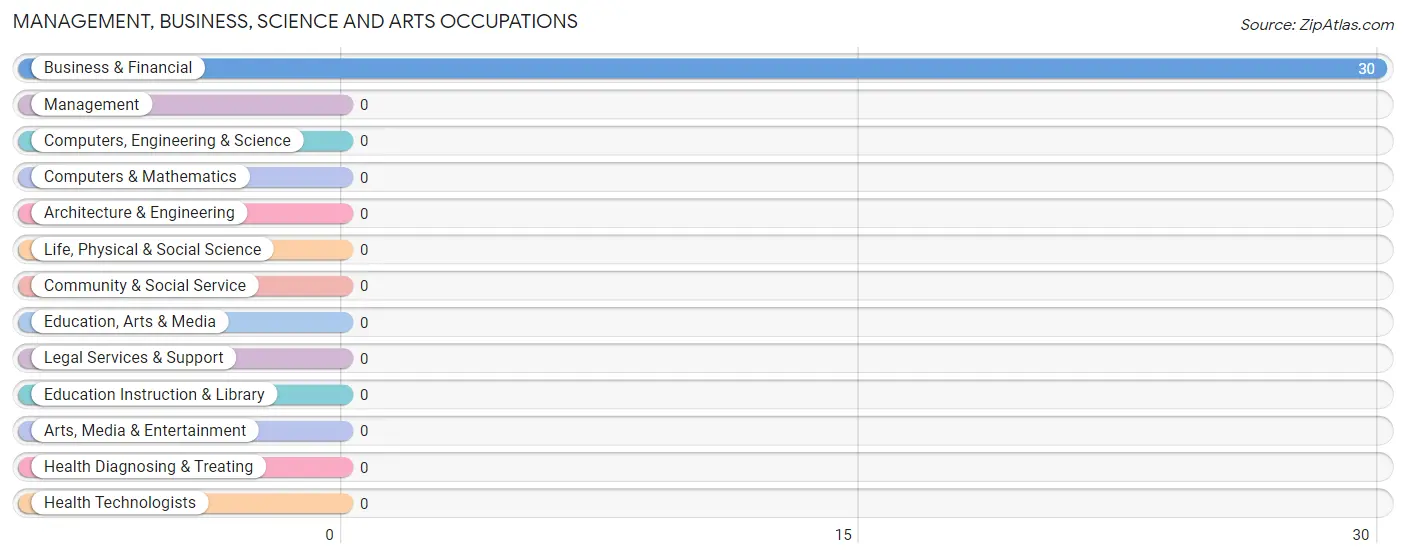
Management, Business, Science and Arts Occupations by Sex
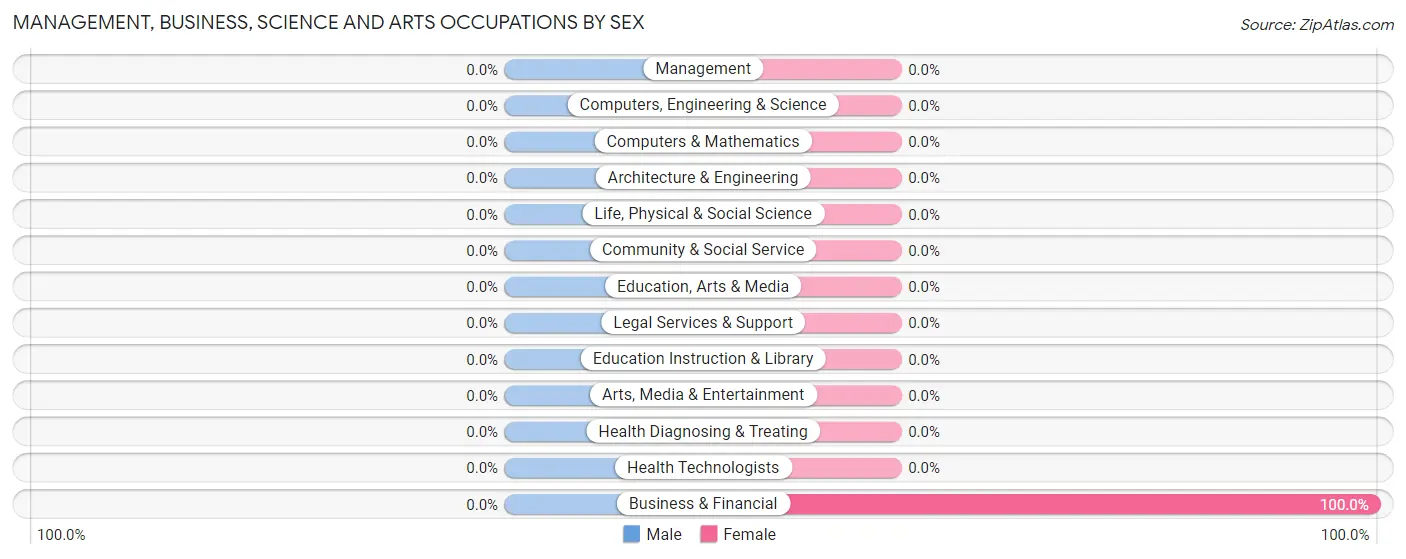
| Occupation | Male | Female |
| Management | 0 (0.0%) | 0 (0.0%) |
| Business & Financial | 0 (0.0%) | 30 (100.0%) |
| Computers, Engineering & Science | 0 (0.0%) | 0 (0.0%) |
| Computers & Mathematics | 0 (0.0%) | 0 (0.0%) |
| Architecture & Engineering | 0 (0.0%) | 0 (0.0%) |
| Life, Physical & Social Science | 0 (0.0%) | 0 (0.0%) |
| Community & Social Service | 0 (0.0%) | 0 (0.0%) |
| Education, Arts & Media | 0 (0.0%) | 0 (0.0%) |
| Legal Services & Support | 0 (0.0%) | 0 (0.0%) |
| Education Instruction & Library | 0 (0.0%) | 0 (0.0%) |
| Arts, Media & Entertainment | 0 (0.0%) | 0 (0.0%) |
| Health Diagnosing & Treating | 0 (0.0%) | 0 (0.0%) |
| Health Technologists | 0 (0.0%) | 0 (0.0%) |
| Total (Category) | 0 (0.0%) | 30 (100.0%) |
| Total (Overall) | 175 (85.4%) | 30 (14.6%) |
Services Occupations
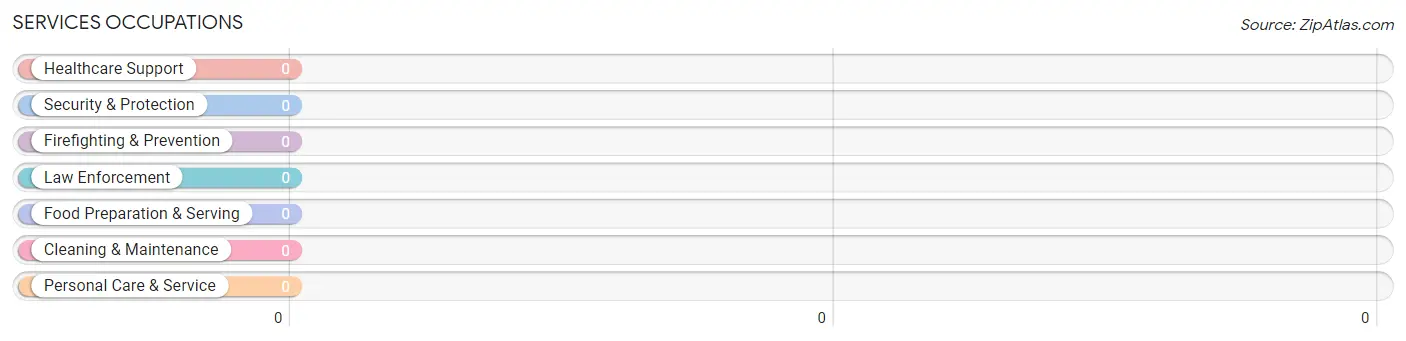
Services Occupations by Sex
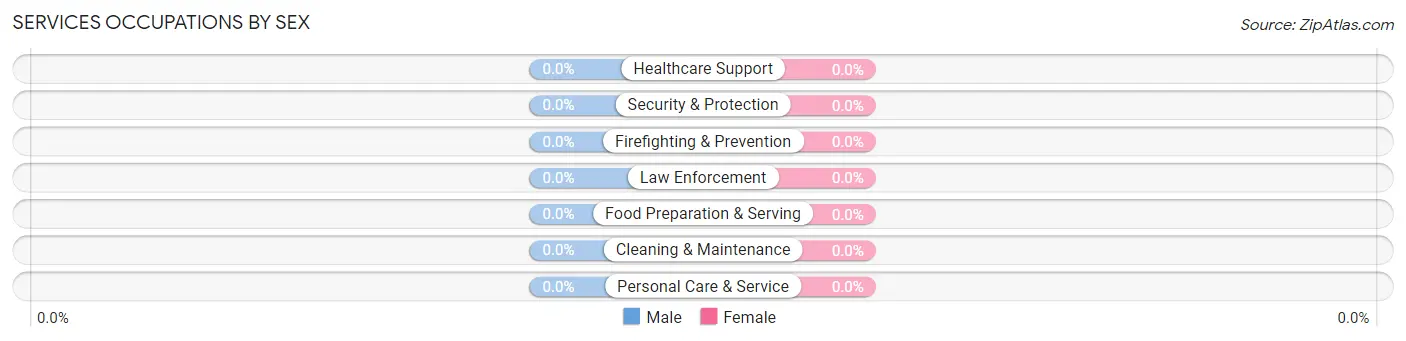
| Occupation | Male | Female |
| Healthcare Support | 0 (0.0%) | 0 (0.0%) |
| Security & Protection | 0 (0.0%) | 0 (0.0%) |
| Firefighting & Prevention | 0 (0.0%) | 0 (0.0%) |
| Law Enforcement | 0 (0.0%) | 0 (0.0%) |
| Food Preparation & Serving | 0 (0.0%) | 0 (0.0%) |
| Cleaning & Maintenance | 0 (0.0%) | 0 (0.0%) |
| Personal Care & Service | 0 (0.0%) | 0 (0.0%) |
| Total (Category) | 0 (0.0%) | 0 (0.0%) |
| Total (Overall) | 175 (85.4%) | 30 (14.6%) |
Sales and Office Occupations
The most common Sales and Office occupations in Challenge Brownsville are , and Sales & Related (14 | 6.8%).
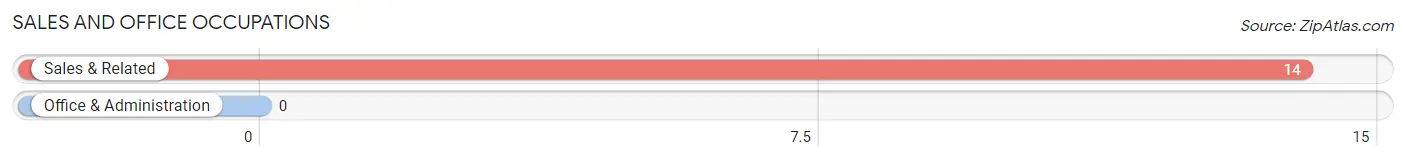
Sales and Office Occupations by Sex
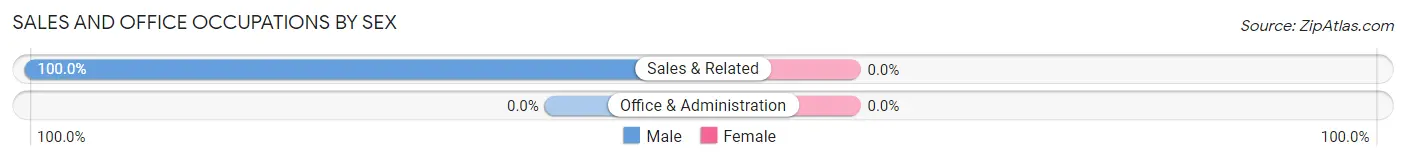
| Occupation | Male | Female |
| Sales & Related | 14 (100.0%) | 0 (0.0%) |
| Office & Administration | 0 (0.0%) | 0 (0.0%) |
| Total (Category) | 14 (100.0%) | 0 (0.0%) |
| Total (Overall) | 175 (85.4%) | 30 (14.6%) |
Natural Resources, Construction and Maintenance Occupations
The most common Natural Resources, Construction and Maintenance occupations in Challenge Brownsville are , and Installation, Maintenance & Repair (161 | 78.5%).
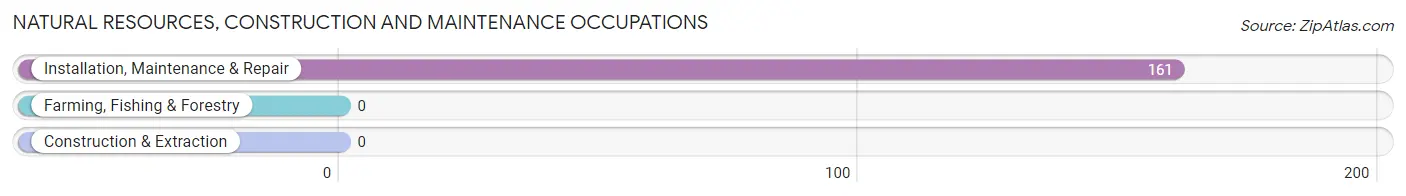
Natural Resources, Construction and Maintenance Occupations by Sex
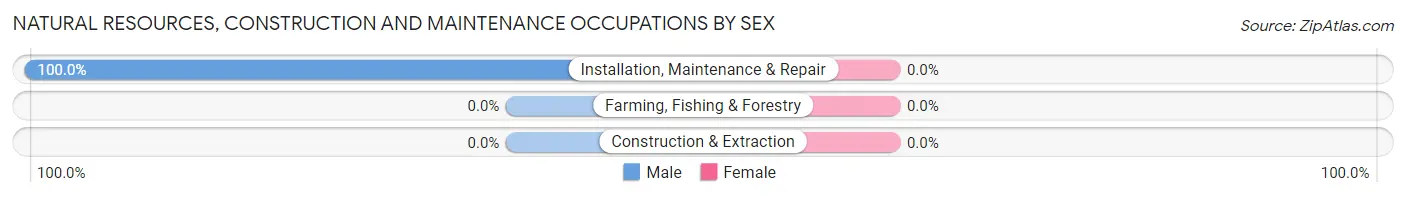
| Occupation | Male | Female |
| Farming, Fishing & Forestry | 0 (0.0%) | 0 (0.0%) |
| Construction & Extraction | 0 (0.0%) | 0 (0.0%) |
| Installation, Maintenance & Repair | 161 (100.0%) | 0 (0.0%) |
| Total (Category) | 161 (100.0%) | 0 (0.0%) |
| Total (Overall) | 175 (85.4%) | 30 (14.6%) |
Production, Transportation and Moving Occupations
Production, Transportation and Moving Occupations by Sex
| Occupation | Male | Female |
| Production | 0 (0.0%) | 0 (0.0%) |
| Transportation | 0 (0.0%) | 0 (0.0%) |
| Material Moving | 0 (0.0%) | 0 (0.0%) |
| Total (Category) | 0 (0.0%) | 0 (0.0%) |
| Total (Overall) | 175 (85.4%) | 30 (14.6%) |
Employment Industries by Sex in Challenge Brownsville
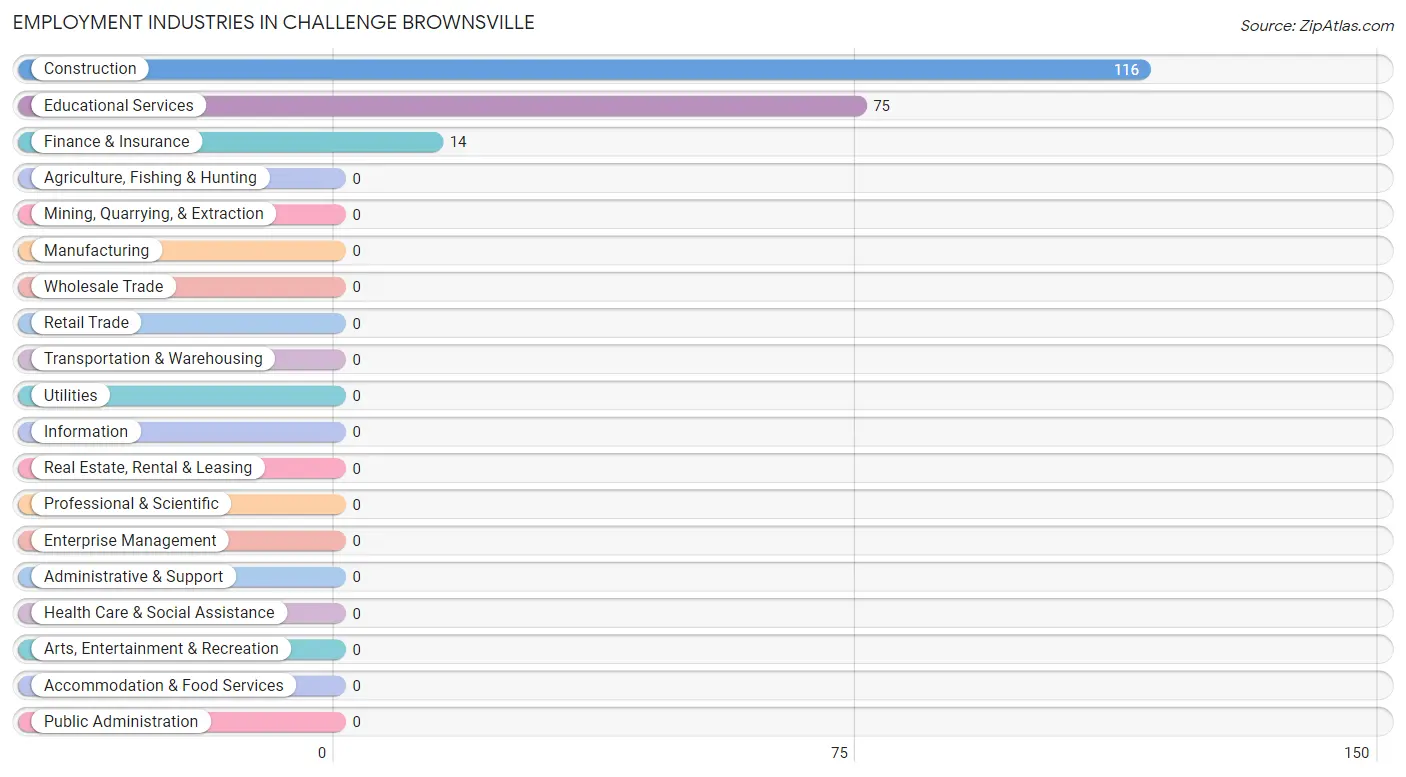
Employment Industries in Challenge Brownsville
The major employment industries in Challenge Brownsville include Construction (116 | 56.6%), Educational Services (75 | 36.6%), and Finance & Insurance (14 | 6.8%).
Employment Industries by Sex in Challenge Brownsville
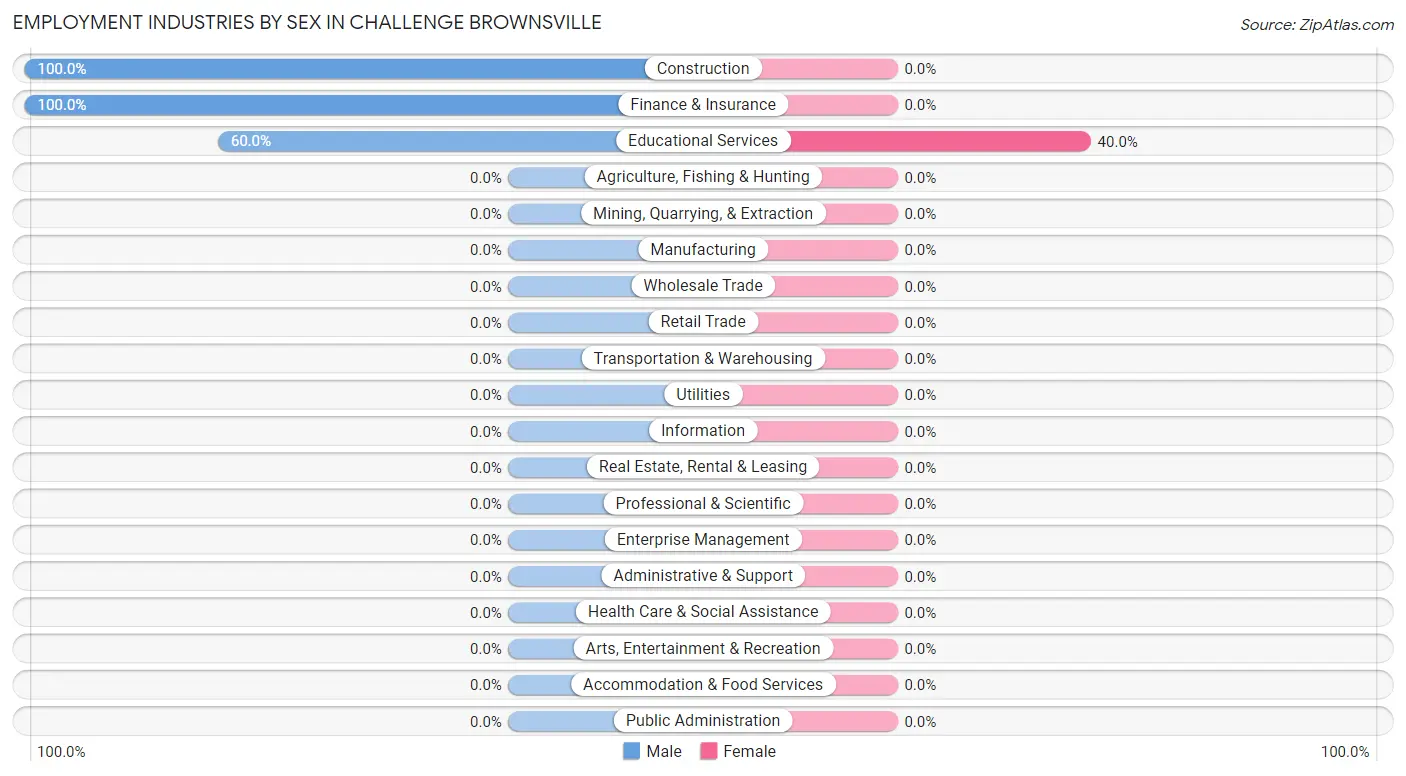
| Industry | Male | Female |
| Agriculture, Fishing & Hunting | 0 (0.0%) | 0 (0.0%) |
| Mining, Quarrying, & Extraction | 0 (0.0%) | 0 (0.0%) |
| Construction | 116 (100.0%) | 0 (0.0%) |
| Manufacturing | 0 (0.0%) | 0 (0.0%) |
| Wholesale Trade | 0 (0.0%) | 0 (0.0%) |
| Retail Trade | 0 (0.0%) | 0 (0.0%) |
| Transportation & Warehousing | 0 (0.0%) | 0 (0.0%) |
| Utilities | 0 (0.0%) | 0 (0.0%) |
| Information | 0 (0.0%) | 0 (0.0%) |
| Finance & Insurance | 14 (100.0%) | 0 (0.0%) |
| Real Estate, Rental & Leasing | 0 (0.0%) | 0 (0.0%) |
| Professional & Scientific | 0 (0.0%) | 0 (0.0%) |
| Enterprise Management | 0 (0.0%) | 0 (0.0%) |
| Administrative & Support | 0 (0.0%) | 0 (0.0%) |
| Educational Services | 45 (60.0%) | 30 (40.0%) |
| Health Care & Social Assistance | 0 (0.0%) | 0 (0.0%) |
| Arts, Entertainment & Recreation | 0 (0.0%) | 0 (0.0%) |
| Accommodation & Food Services | 0 (0.0%) | 0 (0.0%) |
| Public Administration | 0 (0.0%) | 0 (0.0%) |
| Total | 175 (85.4%) | 30 (14.6%) |
Education in Challenge Brownsville
School Enrollment in Challenge Brownsville
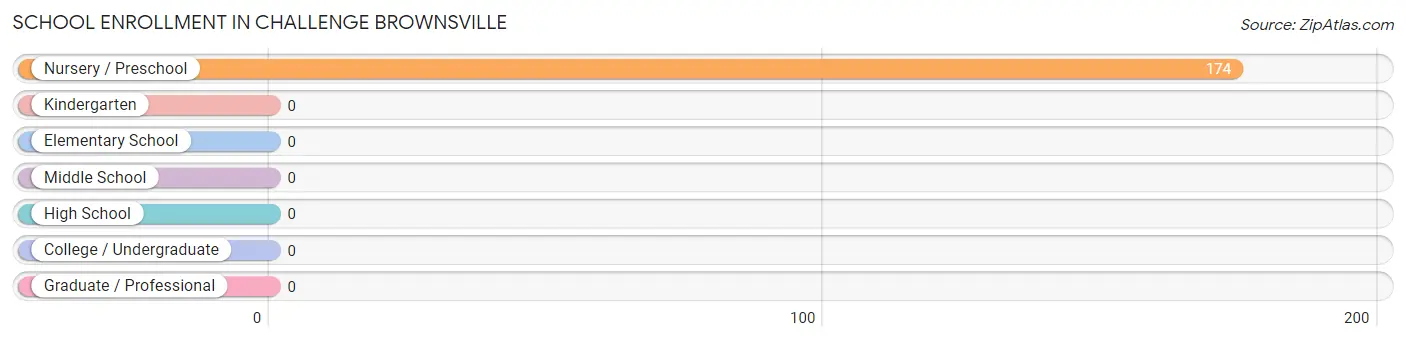
| School Level | # Students | % Students |
| Nursery / Preschool | 174 | 100.0% |
| Kindergarten | 0 | 0.0% |
| Elementary School | 0 | 0.0% |
| Middle School | 0 | 0.0% |
| High School | 0 | 0.0% |
| College / Undergraduate | 0 | 0.0% |
| Graduate / Professional | 0 | 0.0% |
| Total | 174 | 100.0% |
School Enrollment by Age by Funding Source in Challenge Brownsville
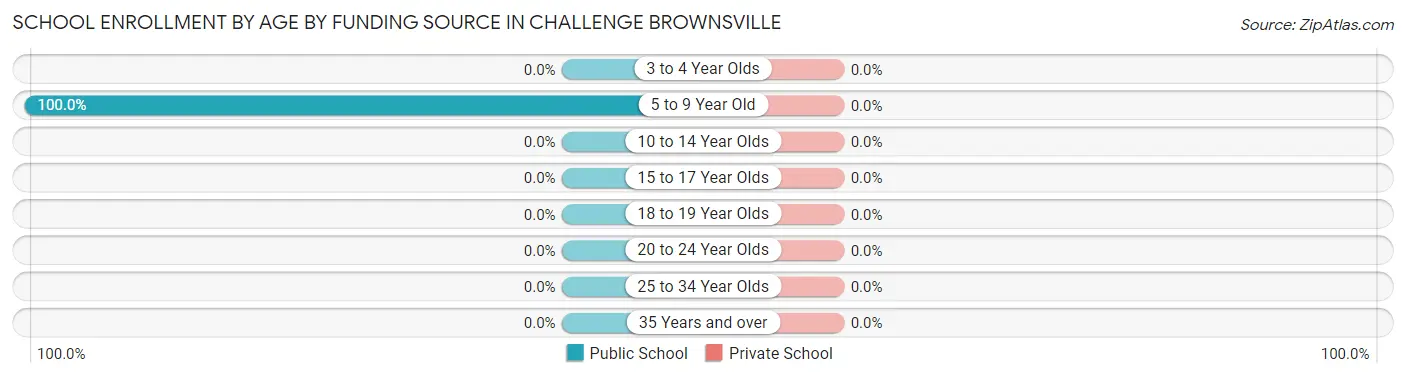
| Age Bracket | Public School | Private School |
| 3 to 4 Year Olds | 0 (0.0%) | 0 (0.0%) |
| 5 to 9 Year Old | 174 (100.0%) | 0 (0.0%) |
| 10 to 14 Year Olds | 0 (0.0%) | 0 (0.0%) |
| 15 to 17 Year Olds | 0 (0.0%) | 0 (0.0%) |
| 18 to 19 Year Olds | 0 (0.0%) | 0 (0.0%) |
| 20 to 24 Year Olds | 0 (0.0%) | 0 (0.0%) |
| 25 to 34 Year Olds | 0 (0.0%) | 0 (0.0%) |
| 35 Years and over | 0 (0.0%) | 0 (0.0%) |
| Total | 174 (100.0%) | 0 (0.0%) |
Educational Attainment by Field of Study in Challenge Brownsville
Business (54 | 56.2%), engineering (28 | 29.2%), and social sciences (14 | 14.6%) are the most common fields of study among 96 individuals in Challenge Brownsville who have obtained a bachelor's degree or higher.
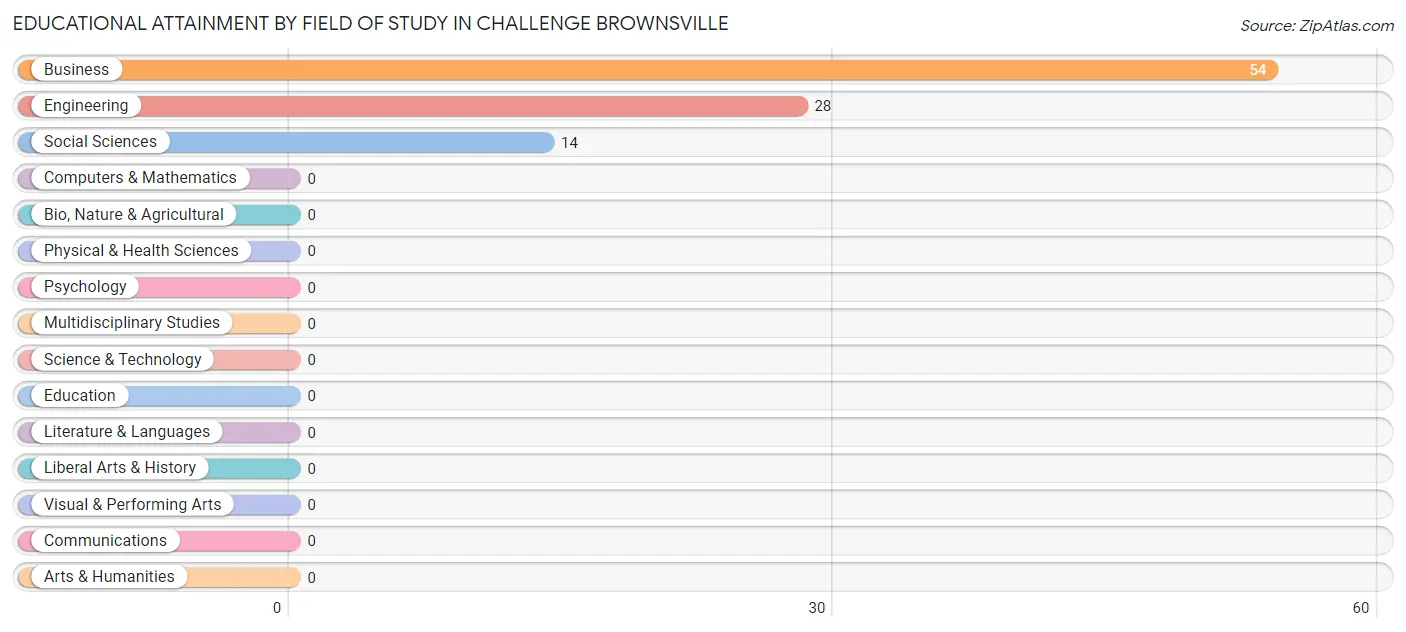
| Field of Study | # Graduates | % Graduates |
| Computers & Mathematics | 0 | 0.0% |
| Bio, Nature & Agricultural | 0 | 0.0% |
| Physical & Health Sciences | 0 | 0.0% |
| Psychology | 0 | 0.0% |
| Social Sciences | 14 | 14.6% |
| Engineering | 28 | 29.2% |
| Multidisciplinary Studies | 0 | 0.0% |
| Science & Technology | 0 | 0.0% |
| Business | 54 | 56.2% |
| Education | 0 | 0.0% |
| Literature & Languages | 0 | 0.0% |
| Liberal Arts & History | 0 | 0.0% |
| Visual & Performing Arts | 0 | 0.0% |
| Communications | 0 | 0.0% |
| Arts & Humanities | 0 | 0.0% |
| Total | 96 | 100.0% |
Transportation & Commute in Challenge Brownsville
Vehicle Availability by Sex in Challenge Brownsville
The most prevalent vehicle ownership categories in Challenge Brownsville are males with 5 or more vehicles (116, accounting for 66.3%) and females with 5 or more vehicles (0, making up 386.7%).
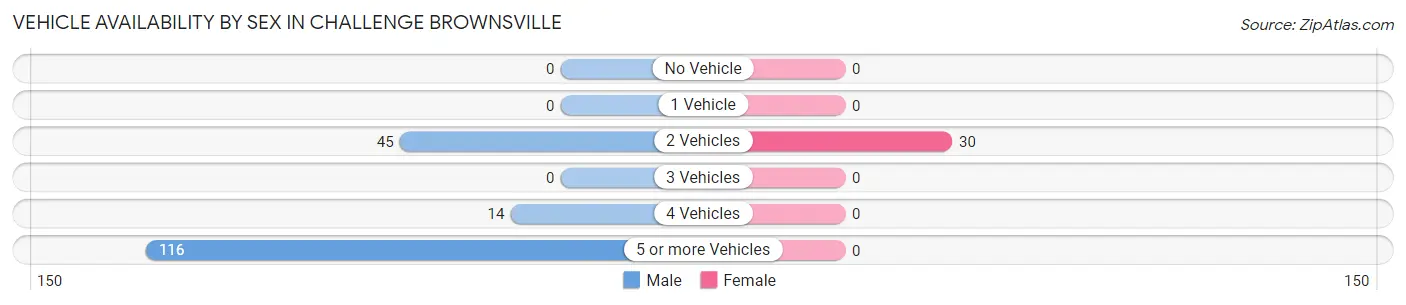
| Vehicles Available | Male | Female |
| No Vehicle | 0 (0.0%) | 0 (0.0%) |
| 1 Vehicle | 0 (0.0%) | 0 (0.0%) |
| 2 Vehicles | 45 (25.7%) | 30 (100.0%) |
| 3 Vehicles | 0 (0.0%) | 0 (0.0%) |
| 4 Vehicles | 14 (8.0%) | 0 (0.0%) |
| 5 or more Vehicles | 116 (66.3%) | 0 (0.0%) |
| Total | 175 (100.0%) | 30 (100.0%) |
Commute Time in Challenge Brownsville
The most frequently occuring commute durations in Challenge Brownsville are 35 to 39 minutes (116 commuters, 56.6%), 30 to 34 minutes (45 commuters, 22.0%), and 60 to 89 minutes (30 commuters, 14.6%).
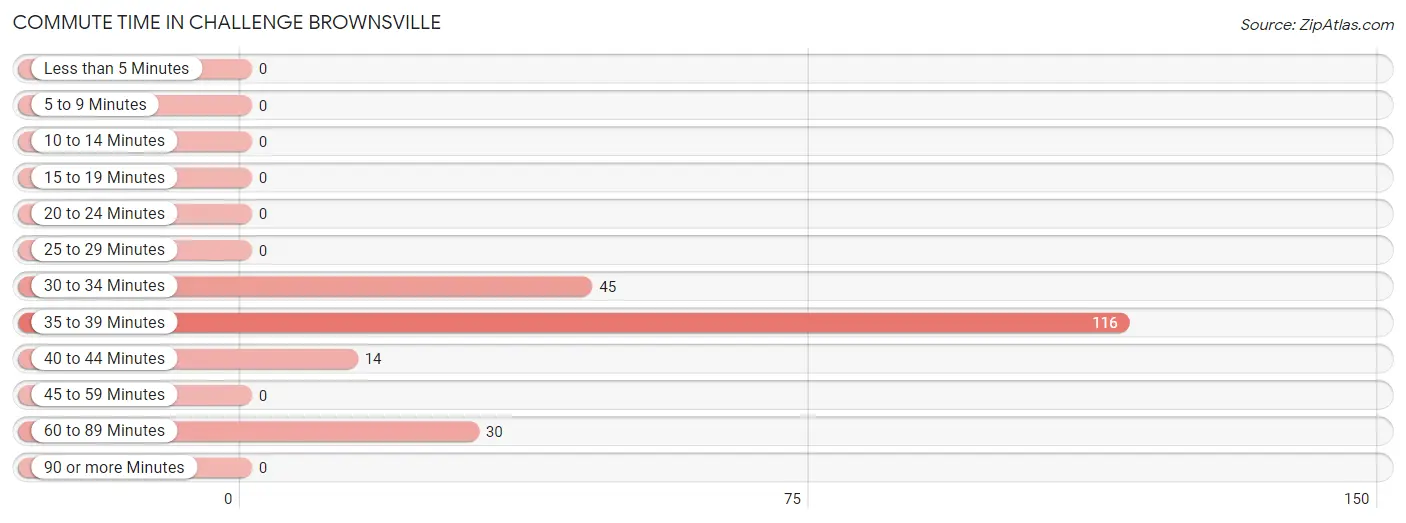
| Commute Time | # Commuters | % Commuters |
| Less than 5 Minutes | 0 | 0.0% |
| 5 to 9 Minutes | 0 | 0.0% |
| 10 to 14 Minutes | 0 | 0.0% |
| 15 to 19 Minutes | 0 | 0.0% |
| 20 to 24 Minutes | 0 | 0.0% |
| 25 to 29 Minutes | 0 | 0.0% |
| 30 to 34 Minutes | 45 | 22.0% |
| 35 to 39 Minutes | 116 | 56.6% |
| 40 to 44 Minutes | 14 | 6.8% |
| 45 to 59 Minutes | 0 | 0.0% |
| 60 to 89 Minutes | 30 | 14.6% |
| 90 or more Minutes | 0 | 0.0% |
Commute Time by Sex in Challenge Brownsville
The most common commute times in Challenge Brownsville are 35 to 39 minutes (116 commuters, 66.3%) for males and 60 to 89 minutes (30 commuters, 100.0%) for females.
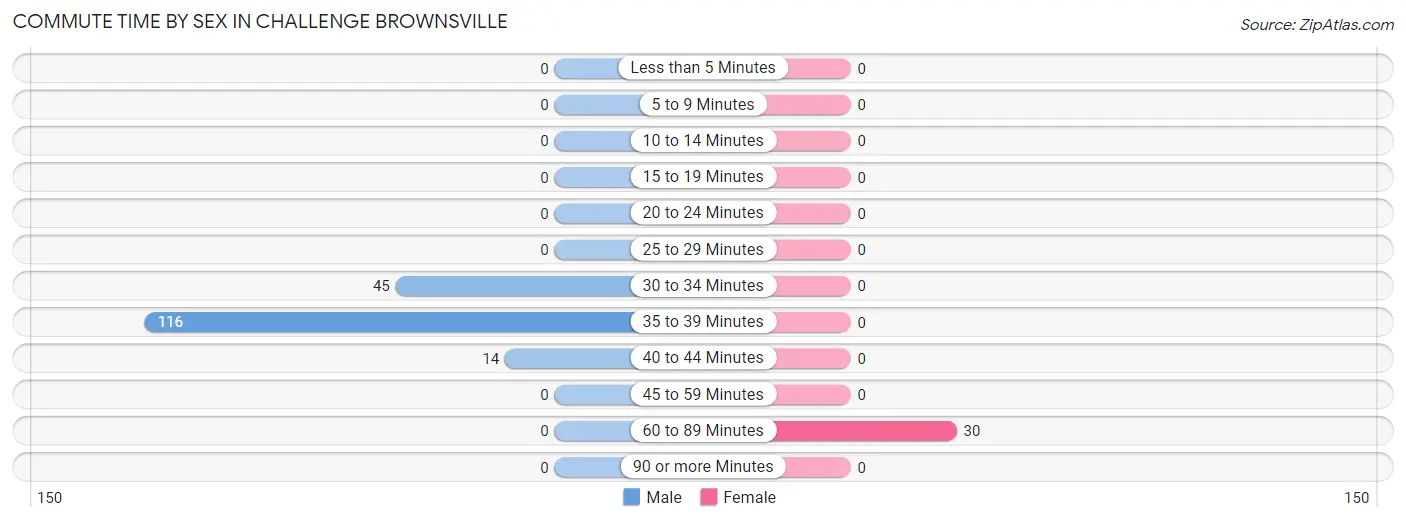
| Commute Time | Male | Female |
| Less than 5 Minutes | 0 (0.0%) | 0 (0.0%) |
| 5 to 9 Minutes | 0 (0.0%) | 0 (0.0%) |
| 10 to 14 Minutes | 0 (0.0%) | 0 (0.0%) |
| 15 to 19 Minutes | 0 (0.0%) | 0 (0.0%) |
| 20 to 24 Minutes | 0 (0.0%) | 0 (0.0%) |
| 25 to 29 Minutes | 0 (0.0%) | 0 (0.0%) |
| 30 to 34 Minutes | 45 (25.7%) | 0 (0.0%) |
| 35 to 39 Minutes | 116 (66.3%) | 0 (0.0%) |
| 40 to 44 Minutes | 14 (8.0%) | 0 (0.0%) |
| 45 to 59 Minutes | 0 (0.0%) | 0 (0.0%) |
| 60 to 89 Minutes | 0 (0.0%) | 30 (100.0%) |
| 90 or more Minutes | 0 (0.0%) | 0 (0.0%) |
Time of Departure to Work by Sex in Challenge Brownsville
The most frequent times of departure to work in Challenge Brownsville are 7:30 AM to 7:59 AM (116, 66.3%) for males and 6:00 AM to 6:29 AM (30, 100.0%) for females.
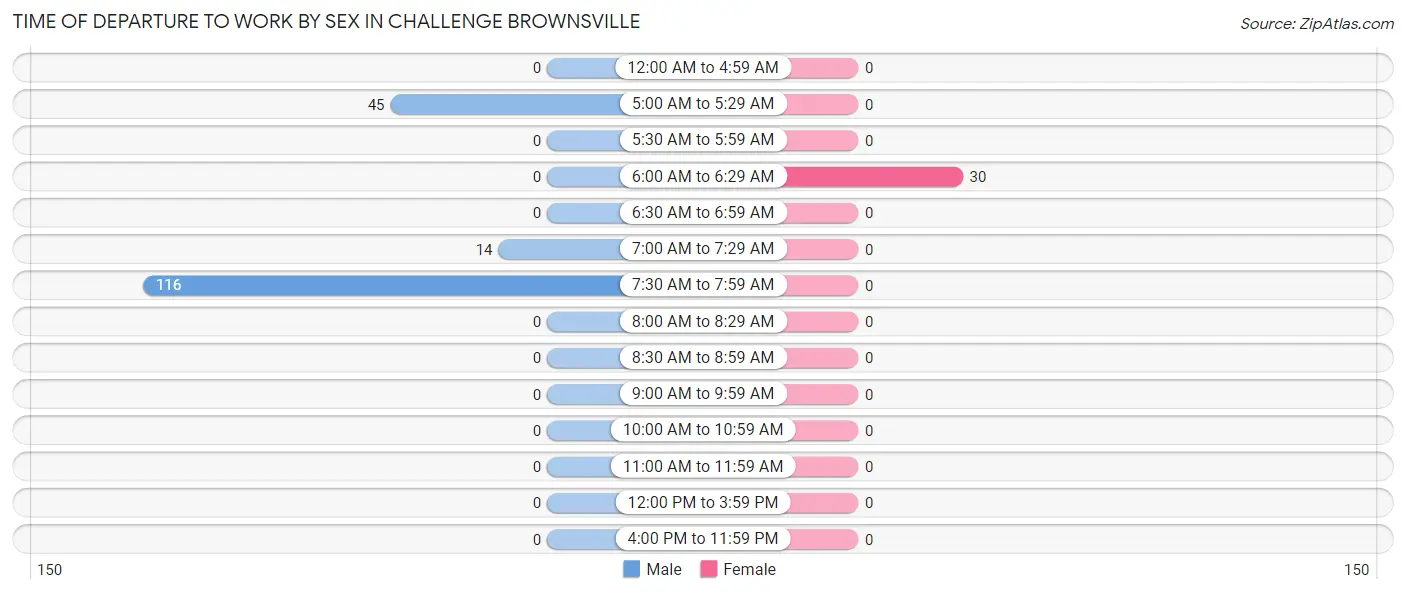
| Time of Departure | Male | Female |
| 12:00 AM to 4:59 AM | 0 (0.0%) | 0 (0.0%) |
| 5:00 AM to 5:29 AM | 45 (25.7%) | 0 (0.0%) |
| 5:30 AM to 5:59 AM | 0 (0.0%) | 0 (0.0%) |
| 6:00 AM to 6:29 AM | 0 (0.0%) | 30 (100.0%) |
| 6:30 AM to 6:59 AM | 0 (0.0%) | 0 (0.0%) |
| 7:00 AM to 7:29 AM | 14 (8.0%) | 0 (0.0%) |
| 7:30 AM to 7:59 AM | 116 (66.3%) | 0 (0.0%) |
| 8:00 AM to 8:29 AM | 0 (0.0%) | 0 (0.0%) |
| 8:30 AM to 8:59 AM | 0 (0.0%) | 0 (0.0%) |
| 9:00 AM to 9:59 AM | 0 (0.0%) | 0 (0.0%) |
| 10:00 AM to 10:59 AM | 0 (0.0%) | 0 (0.0%) |
| 11:00 AM to 11:59 AM | 0 (0.0%) | 0 (0.0%) |
| 12:00 PM to 3:59 PM | 0 (0.0%) | 0 (0.0%) |
| 4:00 PM to 11:59 PM | 0 (0.0%) | 0 (0.0%) |
| Total | 175 (100.0%) | 30 (100.0%) |
Housing Occupancy in Challenge Brownsville
Occupancy by Ownership in Challenge Brownsville
Of the total 413 dwellings in Challenge Brownsville, owner-occupied units account for 381 (92.2%), while renter-occupied units make up 32 (7.7%).
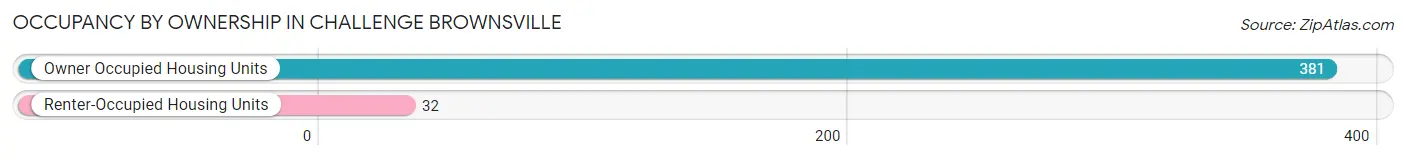
| Occupancy | # Housing Units | % Housing Units |
| Owner Occupied Housing Units | 381 | 92.2% |
| Renter-Occupied Housing Units | 32 | 7.7% |
| Total Occupied Housing Units | 413 | 100.0% |
Occupancy by Household Size in Challenge Brownsville
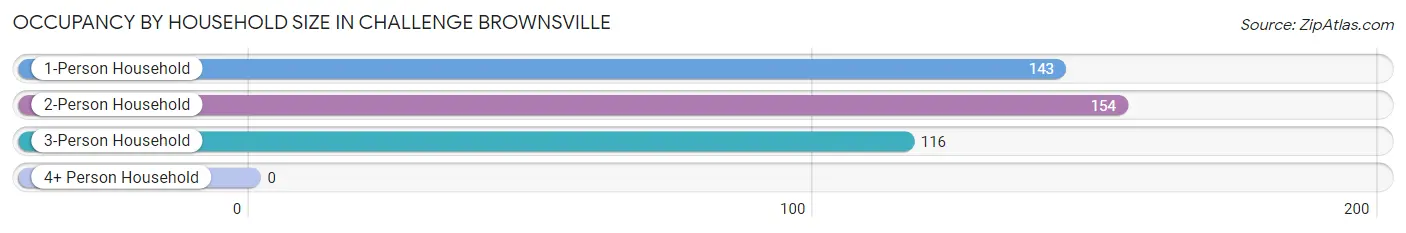
| Household Size | # Housing Units | % Housing Units |
| 1-Person Household | 143 | 34.6% |
| 2-Person Household | 154 | 37.3% |
| 3-Person Household | 116 | 28.1% |
| 4+ Person Household | 0 | 0.0% |
| Total Housing Units | 413 | 100.0% |
Occupancy by Ownership by Household Size in Challenge Brownsville
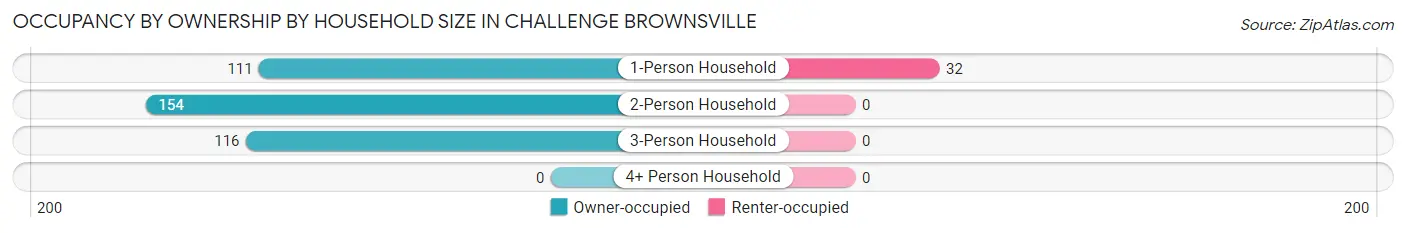
| Household Size | Owner-occupied | Renter-occupied |
| 1-Person Household | 111 (77.6%) | 32 (22.4%) |
| 2-Person Household | 154 (100.0%) | 0 (0.0%) |
| 3-Person Household | 116 (100.0%) | 0 (0.0%) |
| 4+ Person Household | 0 (0.0%) | 0 (0.0%) |
| Total Housing Units | 381 (92.2%) | 32 (7.7%) |
Occupancy by Educational Attainment in Challenge Brownsville
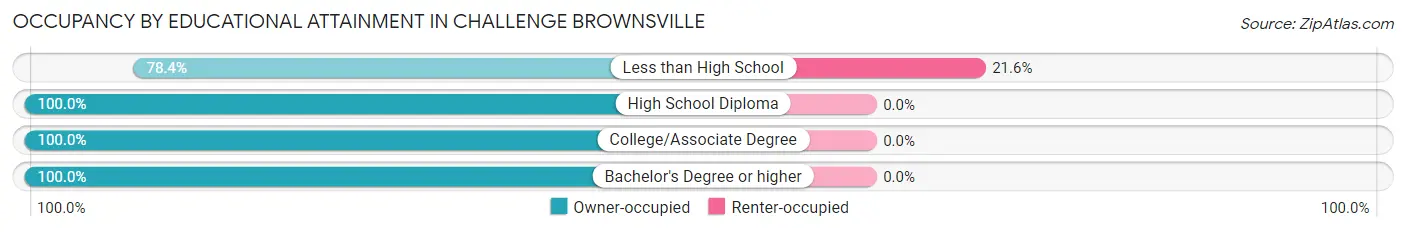
| Household Size | Owner-occupied | Renter-occupied |
| Less than High School | 116 (78.4%) | 32 (21.6%) |
| High School Diploma | 49 (100.0%) | 0 (0.0%) |
| College/Associate Degree | 174 (100.0%) | 0 (0.0%) |
| Bachelor's Degree or higher | 42 (100.0%) | 0 (0.0%) |
Occupancy by Age of Householder in Challenge Brownsville
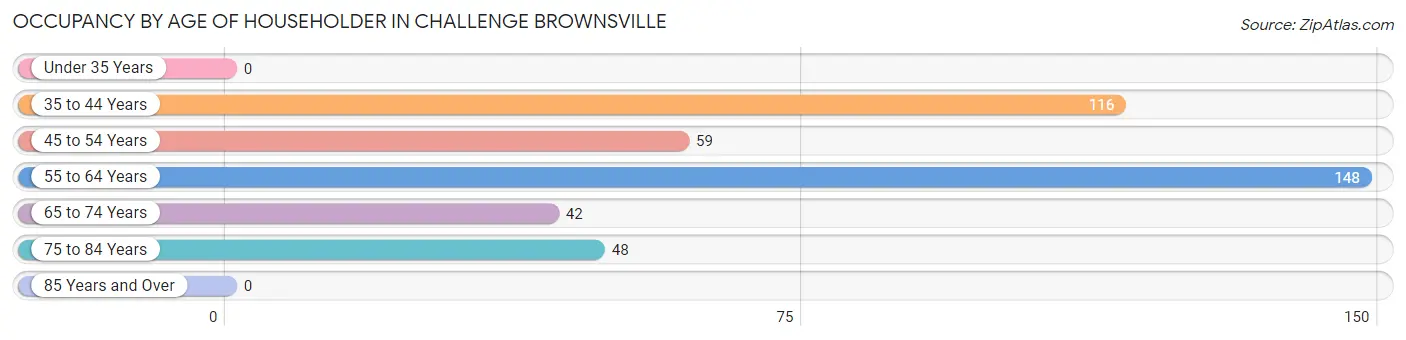
| Age Bracket | # Households | % Households |
| Under 35 Years | 0 | 0.0% |
| 35 to 44 Years | 116 | 28.1% |
| 45 to 54 Years | 59 | 14.3% |
| 55 to 64 Years | 148 | 35.8% |
| 65 to 74 Years | 42 | 10.2% |
| 75 to 84 Years | 48 | 11.6% |
| 85 Years and Over | 0 | 0.0% |
| Total | 413 | 100.0% |
Housing Finances in Challenge Brownsville
Median Income by Occupancy in Challenge Brownsville
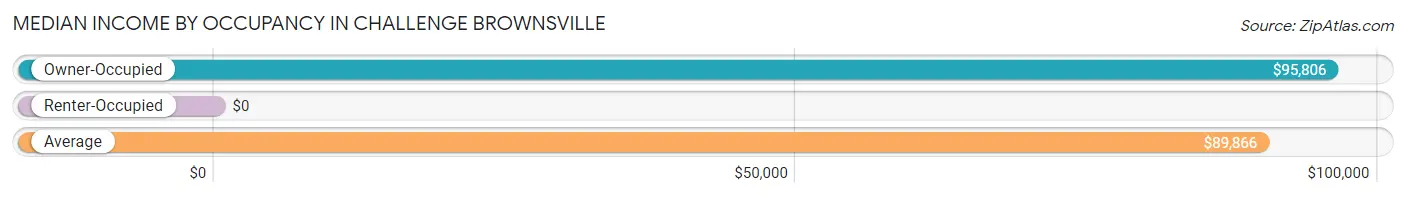
| Occupancy Type | # Households | Median Income |
| Owner-Occupied | 381 (92.2%) | $95,806 |
| Renter-Occupied | 32 (7.7%) | $0 |
| Average | 413 (100.0%) | $89,866 |
Occupancy by Householder Income Bracket in Challenge Brownsville
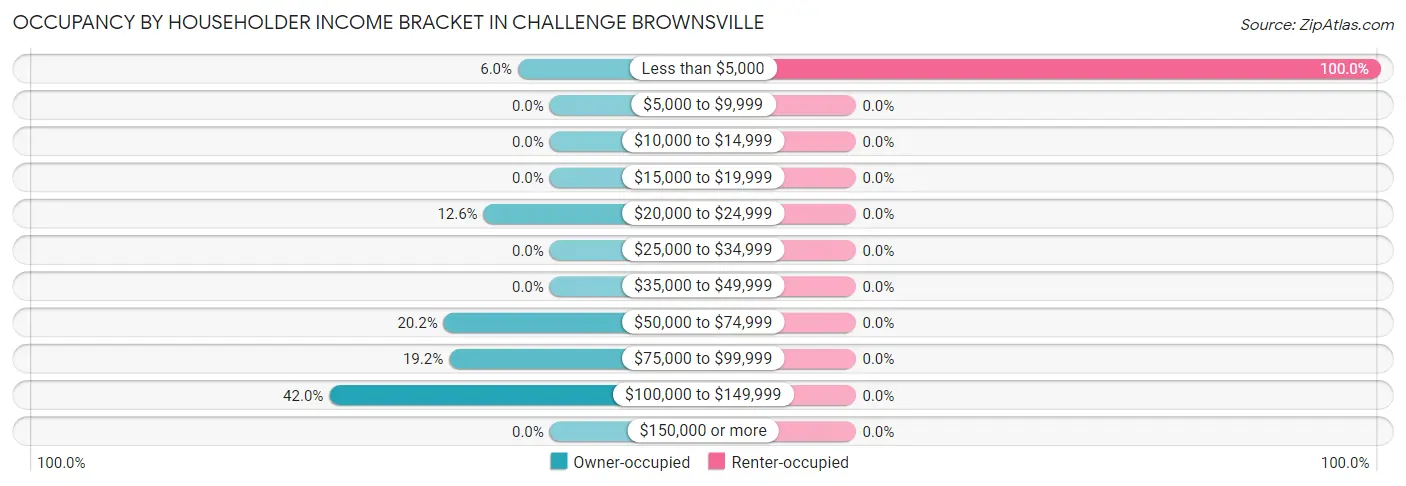
| Income Bracket | Owner-occupied | Renter-occupied |
| Less than $5,000 | 23 (6.0%) | 32 (100.0%) |
| $5,000 to $9,999 | 0 (0.0%) | 0 (0.0%) |
| $10,000 to $14,999 | 0 (0.0%) | 0 (0.0%) |
| $15,000 to $19,999 | 0 (0.0%) | 0 (0.0%) |
| $20,000 to $24,999 | 48 (12.6%) | 0 (0.0%) |
| $25,000 to $34,999 | 0 (0.0%) | 0 (0.0%) |
| $35,000 to $49,999 | 0 (0.0%) | 0 (0.0%) |
| $50,000 to $74,999 | 77 (20.2%) | 0 (0.0%) |
| $75,000 to $99,999 | 73 (19.2%) | 0 (0.0%) |
| $100,000 to $149,999 | 160 (42.0%) | 0 (0.0%) |
| $150,000 or more | 0 (0.0%) | 0 (0.0%) |
| Total | 381 (100.0%) | 32 (100.0%) |
Monthly Housing Cost Tiers in Challenge Brownsville
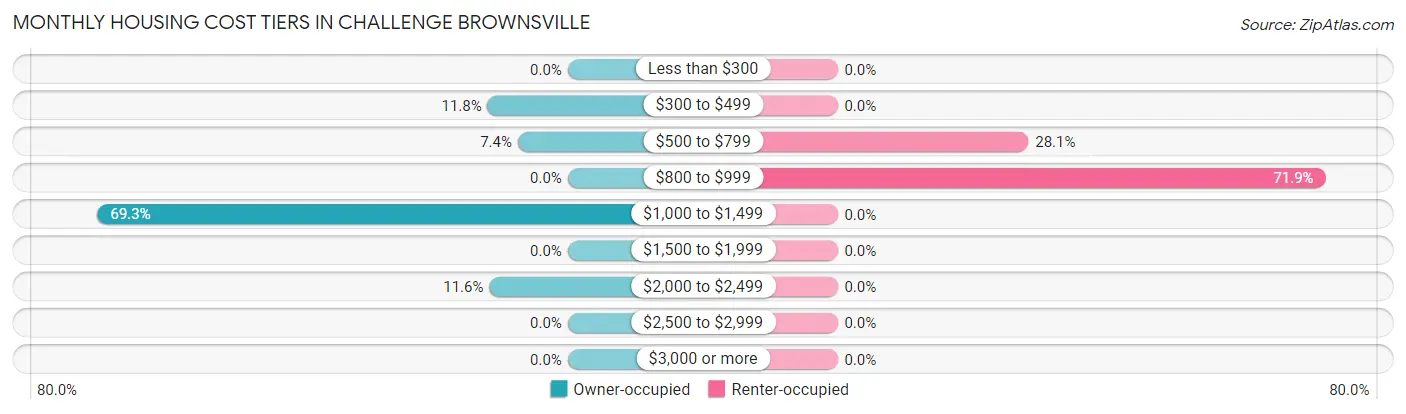
| Monthly Cost | Owner-occupied | Renter-occupied |
| Less than $300 | 0 (0.0%) | 0 (0.0%) |
| $300 to $499 | 45 (11.8%) | 0 (0.0%) |
| $500 to $799 | 28 (7.3%) | 9 (28.1%) |
| $800 to $999 | 0 (0.0%) | 23 (71.9%) |
| $1,000 to $1,499 | 264 (69.3%) | 0 (0.0%) |
| $1,500 to $1,999 | 0 (0.0%) | 0 (0.0%) |
| $2,000 to $2,499 | 44 (11.6%) | 0 (0.0%) |
| $2,500 to $2,999 | 0 (0.0%) | 0 (0.0%) |
| $3,000 or more | 0 (0.0%) | 0 (0.0%) |
| Total | 381 (100.0%) | 32 (100.0%) |
Physical Housing Characteristics in Challenge Brownsville
Housing Structures in Challenge Brownsville
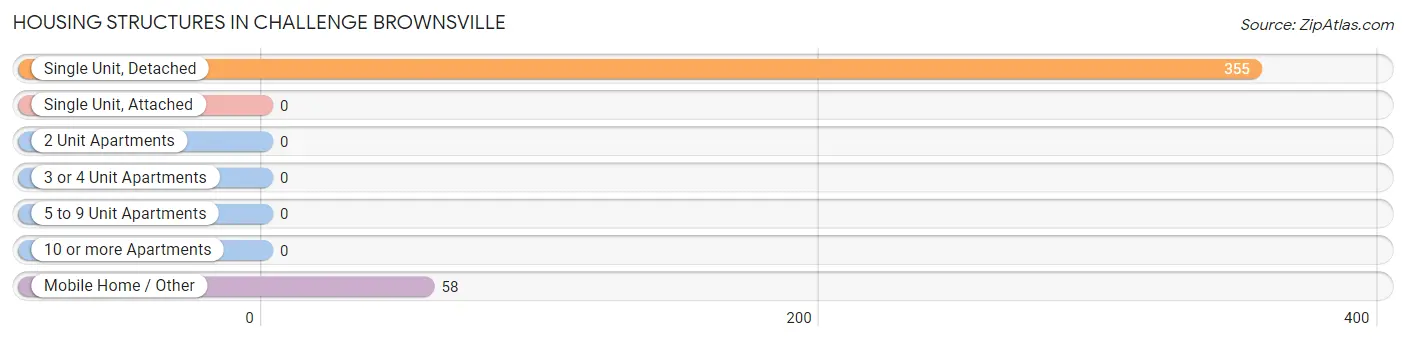
| Structure Type | # Housing Units | % Housing Units |
| Single Unit, Detached | 355 | 86.0% |
| Single Unit, Attached | 0 | 0.0% |
| 2 Unit Apartments | 0 | 0.0% |
| 3 or 4 Unit Apartments | 0 | 0.0% |
| 5 to 9 Unit Apartments | 0 | 0.0% |
| 10 or more Apartments | 0 | 0.0% |
| Mobile Home / Other | 58 | 14.0% |
| Total | 413 | 100.0% |
Housing Structures by Occupancy in Challenge Brownsville
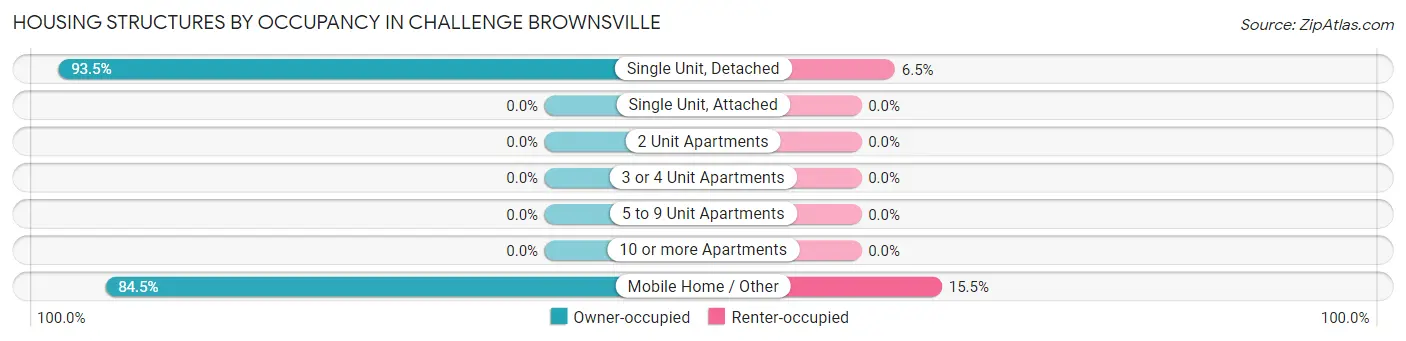
| Structure Type | Owner-occupied | Renter-occupied |
| Single Unit, Detached | 332 (93.5%) | 23 (6.5%) |
| Single Unit, Attached | 0 (0.0%) | 0 (0.0%) |
| 2 Unit Apartments | 0 (0.0%) | 0 (0.0%) |
| 3 or 4 Unit Apartments | 0 (0.0%) | 0 (0.0%) |
| 5 to 9 Unit Apartments | 0 (0.0%) | 0 (0.0%) |
| 10 or more Apartments | 0 (0.0%) | 0 (0.0%) |
| Mobile Home / Other | 49 (84.5%) | 9 (15.5%) |
| Total | 381 (92.2%) | 32 (7.7%) |
Housing Structures by Number of Rooms in Challenge Brownsville
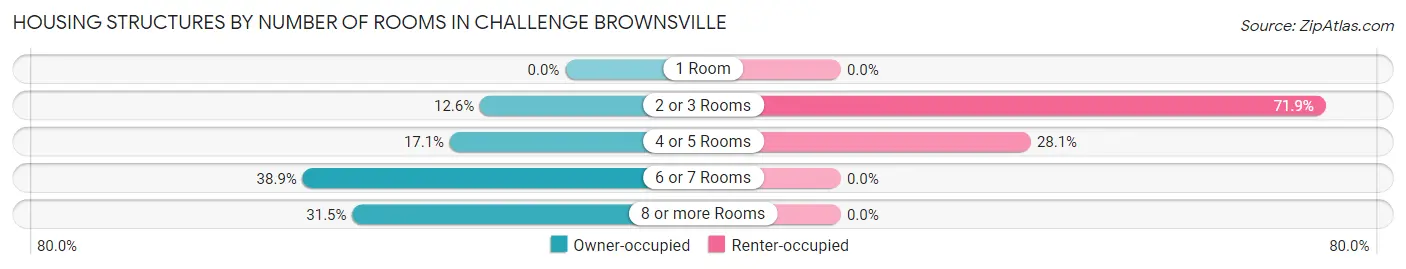
| Number of Rooms | Owner-occupied | Renter-occupied |
| 1 Room | 0 (0.0%) | 0 (0.0%) |
| 2 or 3 Rooms | 48 (12.6%) | 23 (71.9%) |
| 4 or 5 Rooms | 65 (17.1%) | 9 (28.1%) |
| 6 or 7 Rooms | 148 (38.9%) | 0 (0.0%) |
| 8 or more Rooms | 120 (31.5%) | 0 (0.0%) |
| Total | 381 (100.0%) | 32 (100.0%) |
Housing Structure by Heating Type in Challenge Brownsville
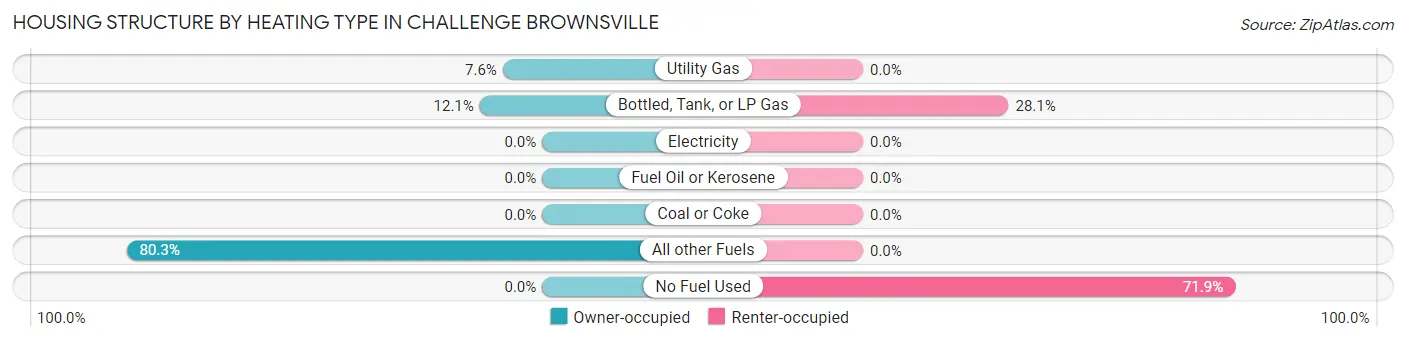
| Heating Type | Owner-occupied | Renter-occupied |
| Utility Gas | 29 (7.6%) | 0 (0.0%) |
| Bottled, Tank, or LP Gas | 46 (12.1%) | 9 (28.1%) |
| Electricity | 0 (0.0%) | 0 (0.0%) |
| Fuel Oil or Kerosene | 0 (0.0%) | 0 (0.0%) |
| Coal or Coke | 0 (0.0%) | 0 (0.0%) |
| All other Fuels | 306 (80.3%) | 0 (0.0%) |
| No Fuel Used | 0 (0.0%) | 23 (71.9%) |
| Total | 381 (100.0%) | 32 (100.0%) |
Household Vehicle Usage in Challenge Brownsville
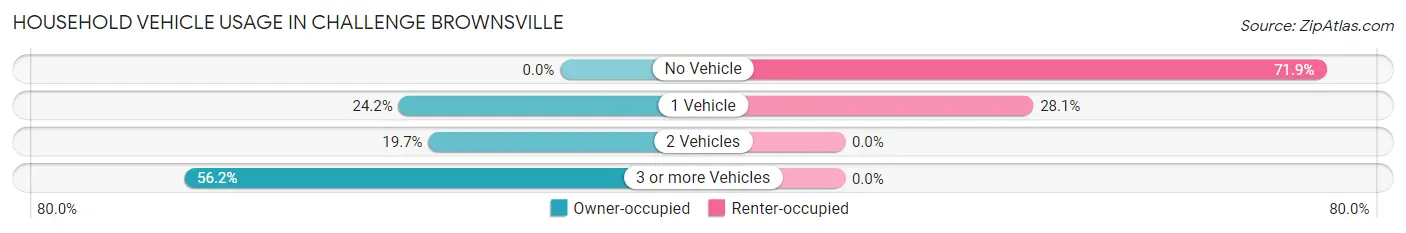
| Vehicles per Household | Owner-occupied | Renter-occupied |
| No Vehicle | 0 (0.0%) | 23 (71.9%) |
| 1 Vehicle | 92 (24.1%) | 9 (28.1%) |
| 2 Vehicles | 75 (19.7%) | 0 (0.0%) |
| 3 or more Vehicles | 214 (56.2%) | 0 (0.0%) |
| Total | 381 (100.0%) | 32 (100.0%) |
Real Estate & Mortgages in Challenge Brownsville
Real Estate and Mortgage Overview in Challenge Brownsville
| Characteristic | Without Mortgage | With Mortgage |
| Housing Units | 77 | 304 |
| Median Property Value | $171,400 | $344,400 |
| Median Household Income | $95,361 | $0 |
| Monthly Housing Costs | $486 | $0 |
| Real Estate Taxes | $1,264 | $0 |
Property Value by Mortgage Status in Challenge Brownsville
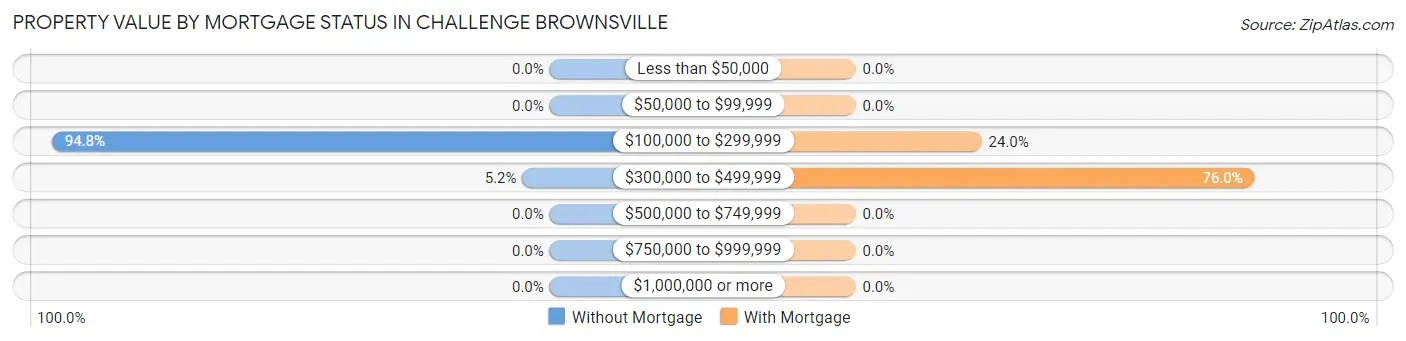
| Property Value | Without Mortgage | With Mortgage |
| Less than $50,000 | 0 (0.0%) | 0 (0.0%) |
| $50,000 to $99,999 | 0 (0.0%) | 0 (0.0%) |
| $100,000 to $299,999 | 73 (94.8%) | 73 (24.0%) |
| $300,000 to $499,999 | 4 (5.2%) | 231 (76.0%) |
| $500,000 to $749,999 | 0 (0.0%) | 0 (0.0%) |
| $750,000 to $999,999 | 0 (0.0%) | 0 (0.0%) |
| $1,000,000 or more | 0 (0.0%) | 0 (0.0%) |
| Total | 77 (100.0%) | 304 (100.0%) |
Household Income by Mortgage Status in Challenge Brownsville
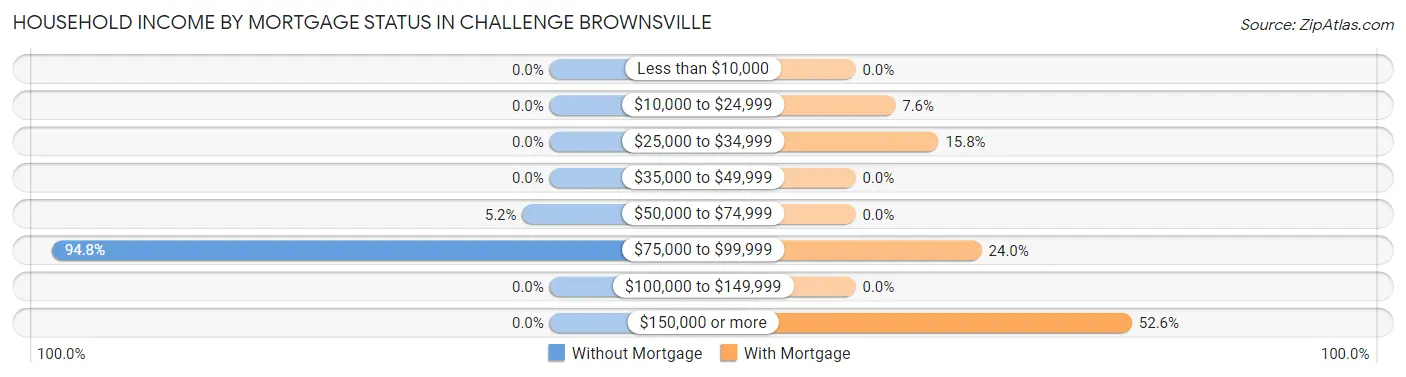
| Household Income | Without Mortgage | With Mortgage |
| Less than $10,000 | 0 (0.0%) | 0 (0.0%) |
| $10,000 to $24,999 | 0 (0.0%) | 23 (7.6%) |
| $25,000 to $34,999 | 0 (0.0%) | 48 (15.8%) |
| $35,000 to $49,999 | 0 (0.0%) | 0 (0.0%) |
| $50,000 to $74,999 | 4 (5.2%) | 0 (0.0%) |
| $75,000 to $99,999 | 73 (94.8%) | 73 (24.0%) |
| $100,000 to $149,999 | 0 (0.0%) | 0 (0.0%) |
| $150,000 or more | 0 (0.0%) | 160 (52.6%) |
| Total | 77 (100.0%) | 304 (100.0%) |
Property Value to Household Income Ratio in Challenge Brownsville
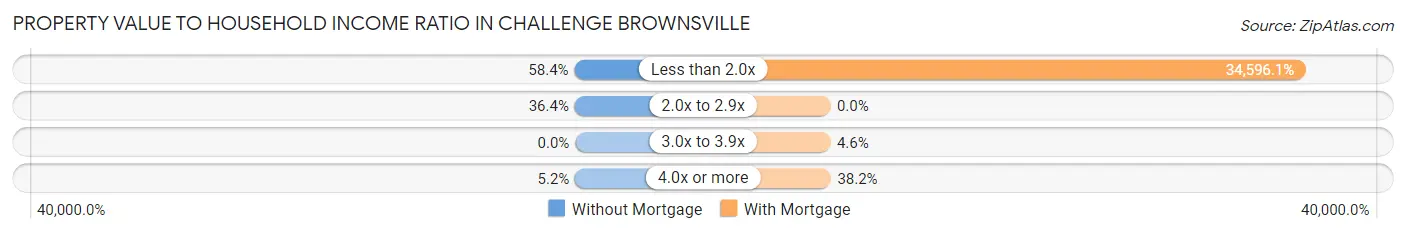
| Value-to-Income Ratio | Without Mortgage | With Mortgage |
| Less than 2.0x | 45 (58.4%) | 105,172 (34,596.1%) |
| 2.0x to 2.9x | 28 (36.4%) | 0 (0.0%) |
| 3.0x to 3.9x | 0 (0.0%) | 14 (4.6%) |
| 4.0x or more | 4 (5.2%) | 116 (38.2%) |
| Total | 77 (100.0%) | 304 (100.0%) |
Real Estate Taxes by Mortgage Status in Challenge Brownsville
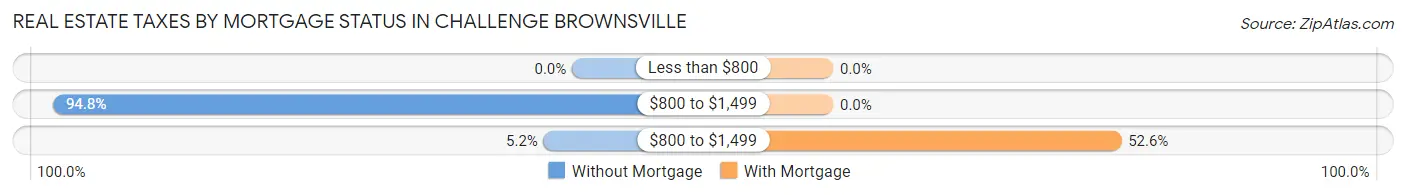
| Property Taxes | Without Mortgage | With Mortgage |
| Less than $800 | 0 (0.0%) | 0 (0.0%) |
| $800 to $1,499 | 73 (94.8%) | 0 (0.0%) |
| $800 to $1,499 | 4 (5.2%) | 160 (52.6%) |
| Total | 77 (100.0%) | 304 (100.0%) |
Health & Disability in Challenge Brownsville
Health Insurance Coverage by Age in Challenge Brownsville
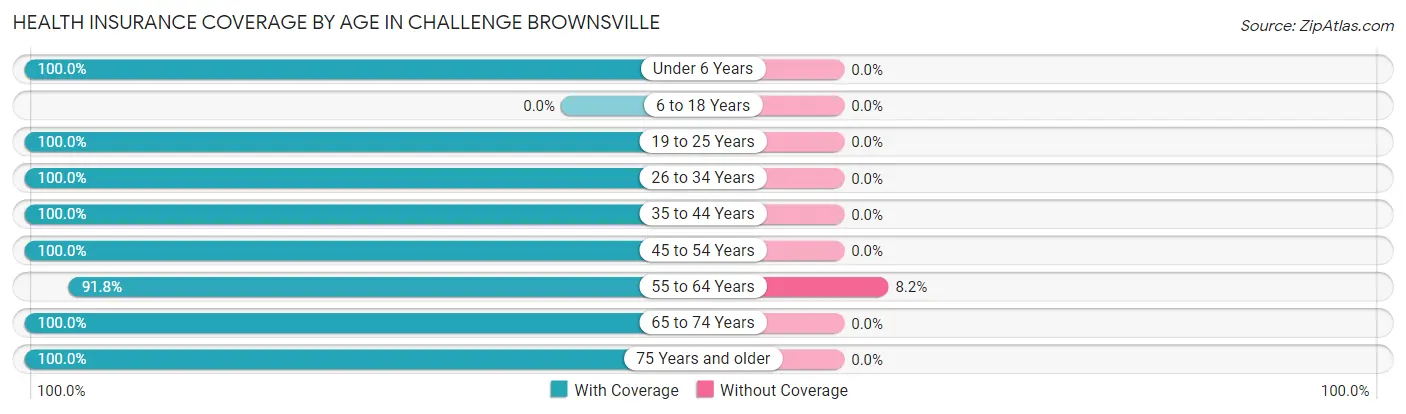
| Age Bracket | With Coverage | Without Coverage |
| Under 6 Years | 174 (100.0%) | 0 (0.0%) |
| 6 to 18 Years | 0 (0.0%) | 0 (0.0%) |
| 19 to 25 Years | 7 (100.0%) | 0 (0.0%) |
| 26 to 34 Years | 107 (100.0%) | 0 (0.0%) |
| 35 to 44 Years | 116 (100.0%) | 0 (0.0%) |
| 45 to 54 Years | 88 (100.0%) | 0 (0.0%) |
| 55 to 64 Years | 256 (91.8%) | 23 (8.2%) |
| 65 to 74 Years | 42 (100.0%) | 0 (0.0%) |
| 75 Years and older | 53 (100.0%) | 0 (0.0%) |
| Total | 843 (97.3%) | 23 (2.7%) |
Health Insurance Coverage by Citizenship Status in Challenge Brownsville
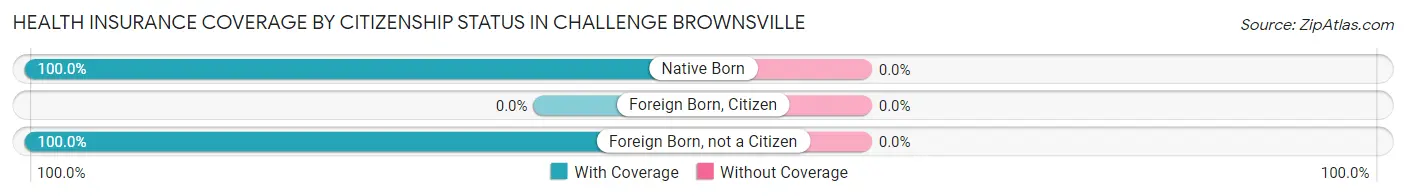
| Citizenship Status | With Coverage | Without Coverage |
| Native Born | 174 (100.0%) | 0 (0.0%) |
| Foreign Born, Citizen | 0 (0.0%) | 0 (0.0%) |
| Foreign Born, not a Citizen | 7 (100.0%) | 0 (0.0%) |
Health Insurance Coverage by Household Income in Challenge Brownsville
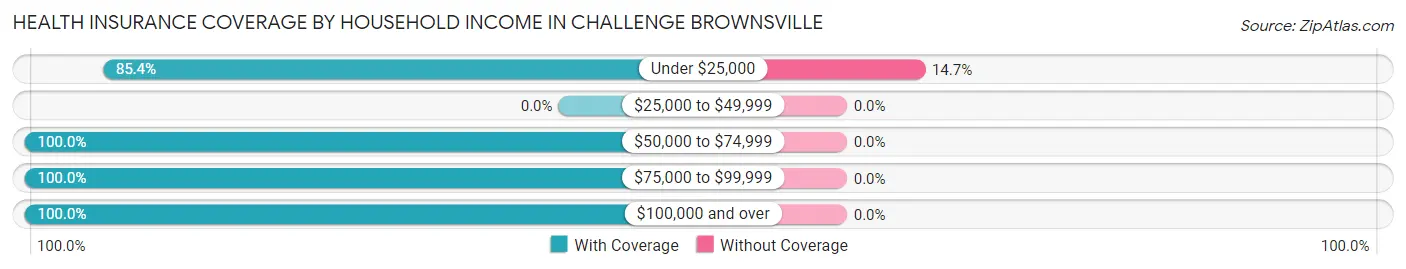
| Household Income | With Coverage | Without Coverage |
| Under $25,000 | 134 (85.4%) | 23 (14.6%) |
| $25,000 to $49,999 | 0 (0.0%) | 0 (0.0%) |
| $50,000 to $74,999 | 111 (100.0%) | 0 (0.0%) |
| $75,000 to $99,999 | 150 (100.0%) | 0 (0.0%) |
| $100,000 and over | 441 (100.0%) | 0 (0.0%) |
Public vs Private Health Insurance Coverage by Age in Challenge Brownsville
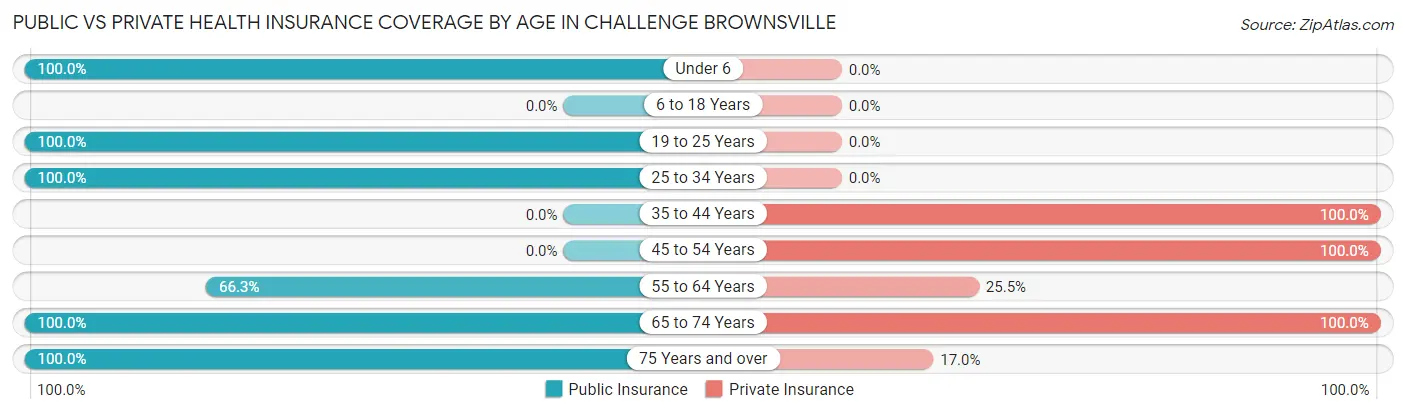
| Age Bracket | Public Insurance | Private Insurance |
| Under 6 | 174 (100.0%) | 0 (0.0%) |
| 6 to 18 Years | 0 (0.0%) | 0 (0.0%) |
| 19 to 25 Years | 7 (100.0%) | 0 (0.0%) |
| 25 to 34 Years | 107 (100.0%) | 0 (0.0%) |
| 35 to 44 Years | 0 (0.0%) | 116 (100.0%) |
| 45 to 54 Years | 0 (0.0%) | 88 (100.0%) |
| 55 to 64 Years | 185 (66.3%) | 71 (25.5%) |
| 65 to 74 Years | 42 (100.0%) | 42 (100.0%) |
| 75 Years and over | 53 (100.0%) | 9 (17.0%) |
| Total | 568 (65.6%) | 326 (37.6%) |
Disability Status by Sex by Age in Challenge Brownsville
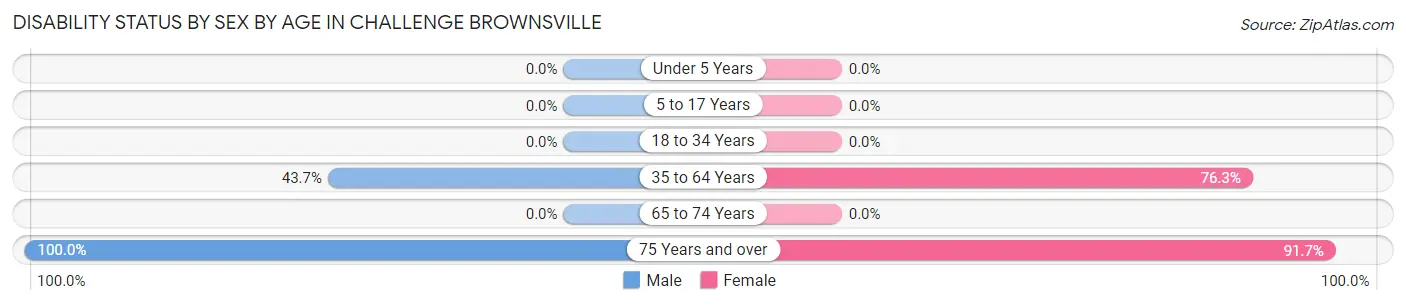
| Age Bracket | Male | Female |
| Under 5 Years | 0 (0.0%) | 0 (0.0%) |
| 5 to 17 Years | 0 (0.0%) | 0 (0.0%) |
| 18 to 34 Years | 0 (0.0%) | 0 (0.0%) |
| 35 to 64 Years | 108 (43.7%) | 180 (76.3%) |
| 65 to 74 Years | 0 (0.0%) | 0 (0.0%) |
| 75 Years and over | 5 (100.0%) | 44 (91.7%) |
Disability Class by Sex by Age in Challenge Brownsville
Disability Class: Hearing Difficulty
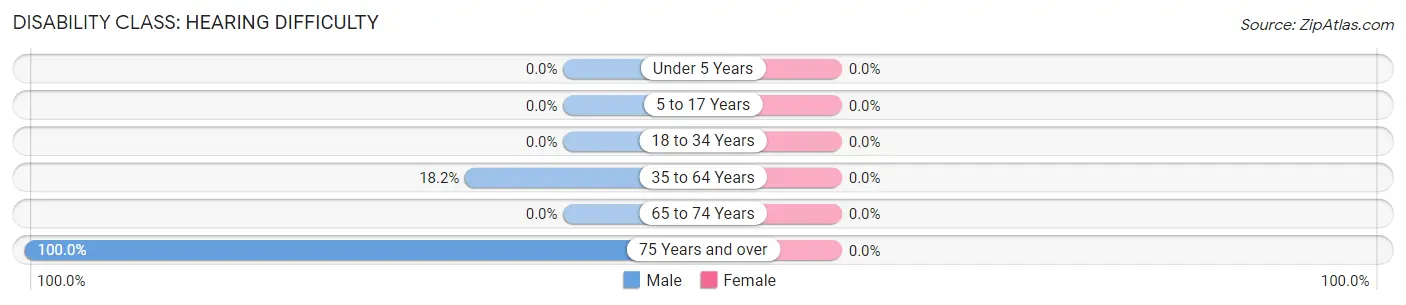
| Age Bracket | Male | Female |
| Under 5 Years | 0 (0.0%) | 0 (0.0%) |
| 5 to 17 Years | 0 (0.0%) | 0 (0.0%) |
| 18 to 34 Years | 0 (0.0%) | 0 (0.0%) |
| 35 to 64 Years | 45 (18.2%) | 0 (0.0%) |
| 65 to 74 Years | 0 (0.0%) | 0 (0.0%) |
| 75 Years and over | 5 (100.0%) | 0 (0.0%) |
Disability Class: Vision Difficulty
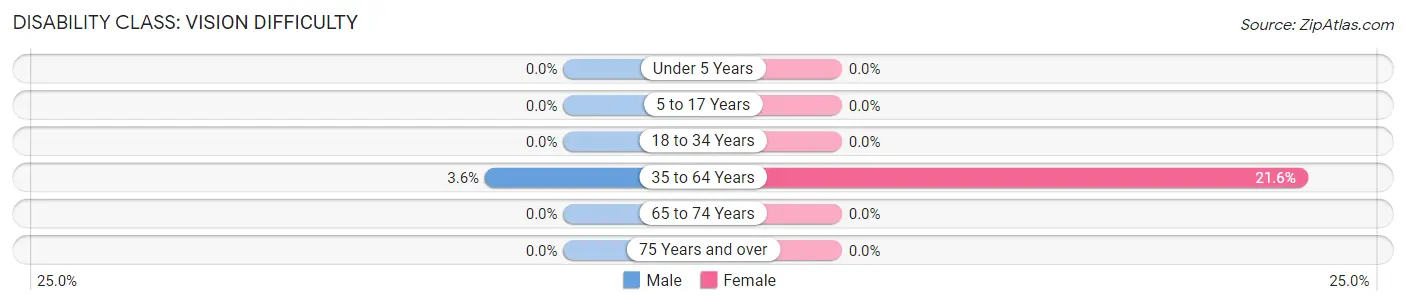
| Age Bracket | Male | Female |
| Under 5 Years | 0 (0.0%) | 0 (0.0%) |
| 5 to 17 Years | 0 (0.0%) | 0 (0.0%) |
| 18 to 34 Years | 0 (0.0%) | 0 (0.0%) |
| 35 to 64 Years | 9 (3.6%) | 51 (21.6%) |
| 65 to 74 Years | 0 (0.0%) | 0 (0.0%) |
| 75 Years and over | 0 (0.0%) | 0 (0.0%) |
Disability Class: Cognitive Difficulty
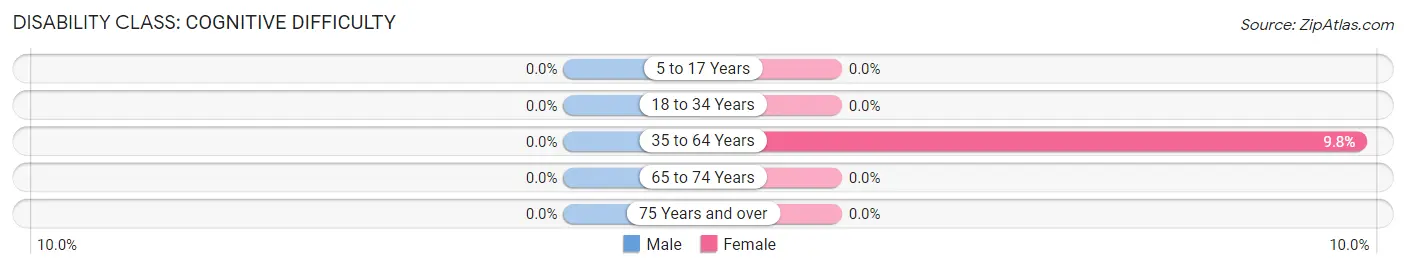
| Age Bracket | Male | Female |
| 5 to 17 Years | 0 (0.0%) | 0 (0.0%) |
| 18 to 34 Years | 0 (0.0%) | 0 (0.0%) |
| 35 to 64 Years | 0 (0.0%) | 23 (9.8%) |
| 65 to 74 Years | 0 (0.0%) | 0 (0.0%) |
| 75 Years and over | 0 (0.0%) | 0 (0.0%) |
Disability Class: Ambulatory Difficulty
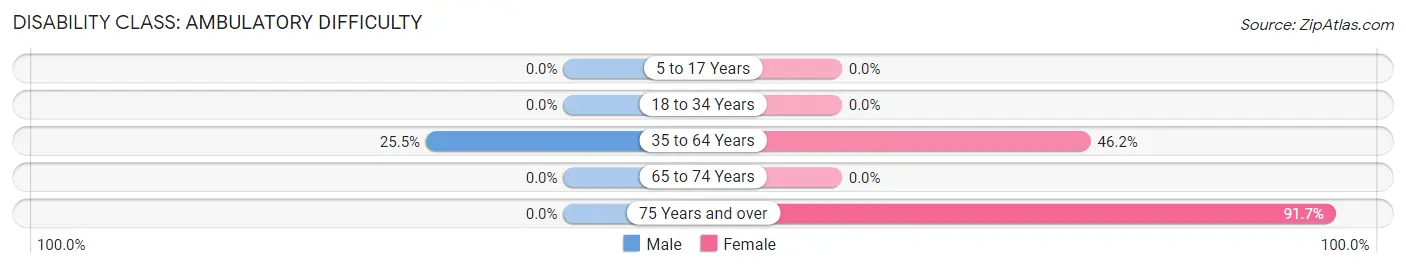
| Age Bracket | Male | Female |
| 5 to 17 Years | 0 (0.0%) | 0 (0.0%) |
| 18 to 34 Years | 0 (0.0%) | 0 (0.0%) |
| 35 to 64 Years | 63 (25.5%) | 109 (46.2%) |
| 65 to 74 Years | 0 (0.0%) | 0 (0.0%) |
| 75 Years and over | 0 (0.0%) | 44 (91.7%) |
Disability Class: Self-Care Difficulty
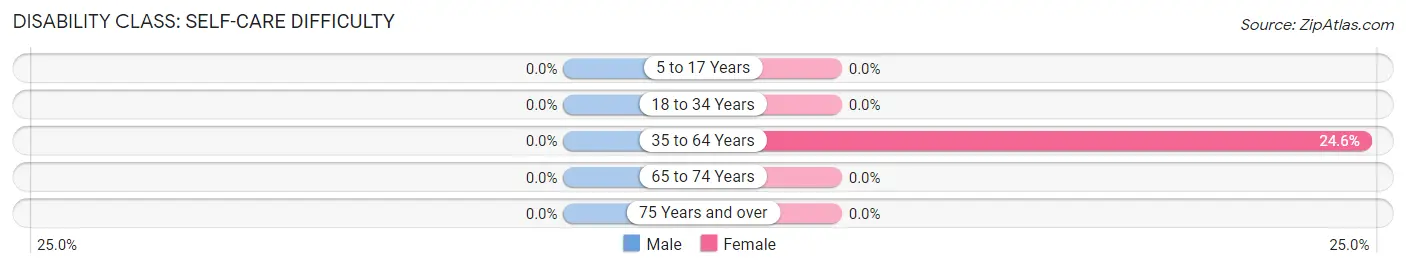
| Age Bracket | Male | Female |
| 5 to 17 Years | 0 (0.0%) | 0 (0.0%) |
| 18 to 34 Years | 0 (0.0%) | 0 (0.0%) |
| 35 to 64 Years | 0 (0.0%) | 58 (24.6%) |
| 65 to 74 Years | 0 (0.0%) | 0 (0.0%) |
| 75 Years and over | 0 (0.0%) | 0 (0.0%) |
Technology Access in Challenge Brownsville
Computing Device Access in Challenge Brownsville
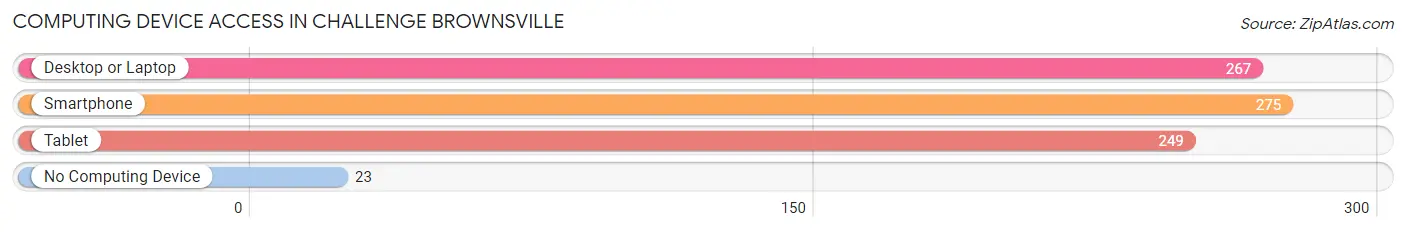
| Device Type | # Households | % Households |
| Desktop or Laptop | 267 | 64.6% |
| Smartphone | 275 | 66.6% |
| Tablet | 249 | 60.3% |
| No Computing Device | 23 | 5.6% |
| Total | 413 | 100.0% |
Internet Access in Challenge Brownsville
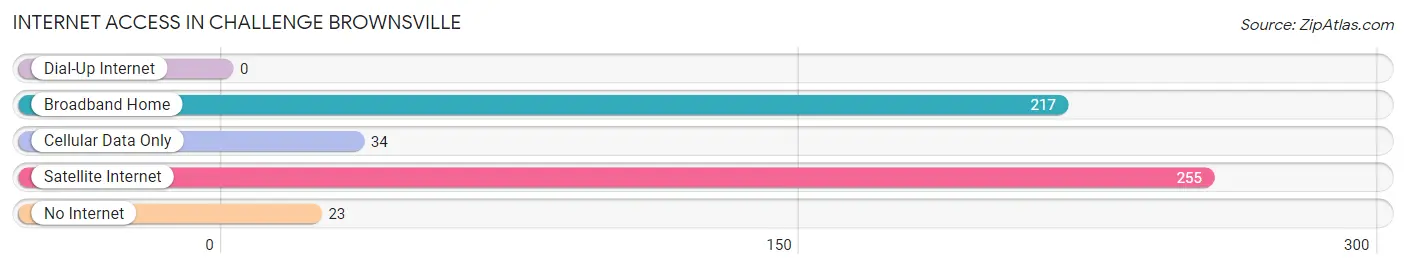
| Internet Type | # Households | % Households |
| Dial-Up Internet | 0 | 0.0% |
| Broadband Home | 217 | 52.5% |
| Cellular Data Only | 34 | 8.2% |
| Satellite Internet | 255 | 61.7% |
| No Internet | 23 | 5.6% |
| Total | 413 | 100.0% |
Challenge Brownsville Summary
Brownsville, California is a small unincorporated community located in the Sierra Nevada foothills of Tuolumne County. It is situated at an elevation of 2,000 feet and is surrounded by the Stanislaus National Forest. The population of Brownsville was estimated to be around 200 people in 2000.
History
Brownsville was founded in 1852 by a group of miners who were searching for gold in the area. The town was named after a local miner, William Brown, who was the first to discover gold in the area. The town quickly grew and by 1854, it had a population of over 500 people.
The town was a major hub for the gold mining industry in the area and was home to several saloons, stores, and hotels. In 1856, the town was incorporated and a post office was established.
In the late 1800s, the gold mining industry began to decline and the population of Brownsville began to dwindle. By the early 1900s, the town had become a ghost town.
In the 1950s, the town was revived when a group of local residents decided to restore the town and make it a tourist destination. The town was listed on the National Register of Historic Places in 1975.
Geography
Brownsville is located in the Sierra Nevada foothills of Tuolumne County. It is situated at an elevation of 2,000 feet and is surrounded by the Stanislaus National Forest. The town is located on the banks of the Tuolumne River and is approximately 25 miles east of Sonora.
The climate in Brownsville is mild and temperate. Summers are warm and dry, while winters are cool and wet. The average annual temperature is around 55 degrees Fahrenheit.
Economy
The economy of Brownsville is largely based on tourism. The town is a popular destination for outdoor activities such as fishing, camping, and hiking. The town also has several restaurants, shops, and galleries.
The town is also home to several small businesses, including a winery, a brewery, and a distillery. The town also has a small airport, which is used for private planes and helicopters.
Demographics
The population of Brownsville was estimated to be around 200 people in 2000. The racial makeup of the town was 95.5% White, 0.5% African American, 0.5% Native American, 0.5% Asian, and 3% from other races.
The median household income in Brownsville was $37,500 in 2000. The per capita income was $17,500. The median age of the population was 44 years.
Conclusion
Brownsville, California is a small unincorporated community located in the Sierra Nevada foothills of Tuolumne County. It is situated at an elevation of 2,000 feet and is surrounded by the Stanislaus National Forest. The town was founded in 1852 by a group of miners who were searching for gold in the area. The town was a major hub for the gold mining industry in the area and was home to several saloons, stores, and hotels. The economy of Brownsville is largely based on tourism and the town is a popular destination for outdoor activities such as fishing, camping, and hiking. The population of Brownsville was estimated to be around 200 people in 2000. The racial makeup of the town was 95.5% White, 0.5% African American, 0.5% Native American, 0.5% Asian, and 3% from other races. The median household income in Brownsville was $37,500 in 2000.
Common Questions
What is Per Capita Income in Challenge Brownsville?
Per Capita income in Challenge Brownsville is $35,542.
What is the Median Family Income in Challenge Brownsville?
Median Family Income in Challenge Brownsville is $96,444.
What is the Median Household income in Challenge Brownsville?
Median Household Income in Challenge Brownsville is $89,866.
What is Inequality or Gini Index in Challenge Brownsville?
Inequality or Gini Index in Challenge Brownsville is 0.30.
What is the Total Population of Challenge Brownsville?
Total Population of Challenge Brownsville is 866.
What is the Total Male Population of Challenge Brownsville?
Total Male Population of Challenge Brownsville is 301.
What is the Total Female Population of Challenge Brownsville?
Total Female Population of Challenge Brownsville is 565.
What is the Ratio of Males per 100 Females in Challenge Brownsville?
There are 53.27 Males per 100 Females in Challenge Brownsville.
What is the Ratio of Females per 100 Males in Challenge Brownsville?
There are 187.71 Females per 100 Males in Challenge Brownsville.
What is the Median Population Age in Challenge Brownsville?
Median Population Age in Challenge Brownsville is 53.5 Years.
What is the Average Family Size in Challenge Brownsville
Average Family Size in Challenge Brownsville is 2.3 People.
What is the Average Household Size in Challenge Brownsville
Average Household Size in Challenge Brownsville is 2.1 People.
How Large is the Labor Force in Challenge Brownsville?
There are 212 People in the Labor Forcein in Challenge Brownsville.
What is the Percentage of People in the Labor Force in Challenge Brownsville?
30.6% of People are in the Labor Force in Challenge Brownsville.
What is the Unemployment Rate in Challenge Brownsville?
Unemployment Rate in Challenge Brownsville is 3.3%.