Cities with the Highest Percentage of Immigrants from Ethiopia in California
RELATED REPORTS & OPTIONS
Ethiopia
California
Compare Cities
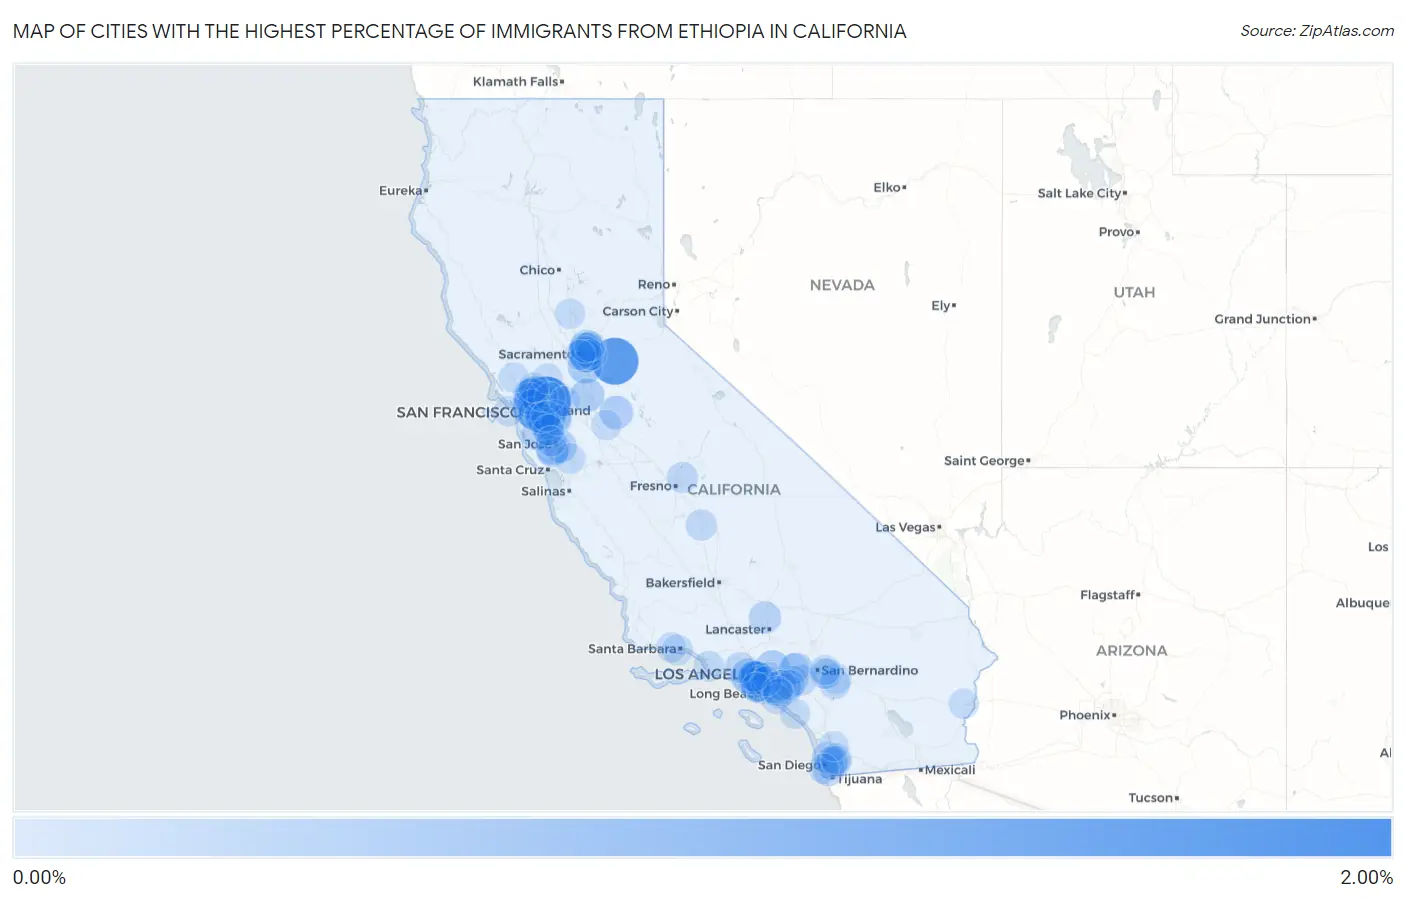
Map of Cities with the Highest Percentage of Immigrants from Ethiopia in California
0.00%
2.00%
Cities with the Highest Percentage of Immigrants from Ethiopia in California
| City | Ethiopia | vs State | vs National | |
| 1. | Contra Costa Centre | 1.60% | 0.063%(+1.54)#-1 | 0.083%(+1.51)#0 |
| 2. | Plymouth | 1.39% | 0.063%(+1.33)#0 | 0.083%(+1.30)#1 |
| 3. | Emeryville | 0.80% | 0.063%(+0.740)#1 | 0.083%(+0.719)#2 |
| 4. | Tara Hills | 0.54% | 0.063%(+0.476)#2 | 0.083%(+0.455)#3 |
| 5. | Fairview | 0.49% | 0.063%(+0.429)#3 | 0.083%(+0.408)#4 |
| 6. | Inglewood | 0.49% | 0.063%(+0.424)#4 | 0.083%(+0.404)#5 |
| 7. | Hawthorne | 0.47% | 0.063%(+0.409)#5 | 0.083%(+0.388)#6 |
| 8. | Oakland | 0.47% | 0.063%(+0.408)#149 | 0.083%(+0.388)#696 |
| 9. | Santa Monica | 0.47% | 0.063%(+0.405)#199 | 0.083%(+0.384)#905 |
| 10. | Cherryland | 0.45% | 0.063%(+0.389)#200 | 0.083%(+0.368)#906 |
| 11. | La Riviera | 0.45% | 0.063%(+0.384)#201 | 0.083%(+0.363)#907 |
| 12. | Rodeo | 0.44% | 0.063%(+0.377)#202 | 0.083%(+0.356)#908 |
| 13. | Elk Grove | 0.40% | 0.063%(+0.336)#203 | 0.083%(+0.315)#909 |
| 14. | Culver City | 0.40% | 0.063%(+0.334)#204 | 0.083%(+0.313)#910 |
| 15. | Campbell | 0.39% | 0.063%(+0.324)#205 | 0.083%(+0.303)#911 |
| 16. | East Pasadena | 0.38% | 0.063%(+0.321)#206 | 0.083%(+0.300)#912 |
| 17. | Carmichael | 0.37% | 0.063%(+0.303)#207 | 0.083%(+0.283)#913 |
| 18. | Ladera Heights | 0.36% | 0.063%(+0.295)#208 | 0.083%(+0.274)#914 |
| 19. | Oakdale | 0.33% | 0.063%(+0.266)#209 | 0.083%(+0.246)#915 |
| 20. | Lincoln Village | 0.31% | 0.063%(+0.248)#210 | 0.083%(+0.227)#916 |
| 21. | San Jose | 0.30% | 0.063%(+0.240)#211 | 0.083%(+0.220)#917 |
| 22. | Foothill Farms | 0.29% | 0.063%(+0.232)#212 | 0.083%(+0.212)#918 |
| 23. | Sonoma State University | 0.29% | 0.063%(+0.230)#213 | 0.083%(+0.210)#919 |
| 24. | Arden Arcade | 0.29% | 0.063%(+0.226)#214 | 0.083%(+0.205)#920 |
| 25. | Dublin | 0.26% | 0.063%(+0.198)#215 | 0.083%(+0.177)#921 |
| 26. | North Fair Oaks | 0.26% | 0.063%(+0.193)#216 | 0.083%(+0.172)#922 |
| 27. | Pinole | 0.24% | 0.063%(+0.175)#217 | 0.083%(+0.154)#923 |
| 28. | Upland | 0.23% | 0.063%(+0.167)#218 | 0.083%(+0.146)#924 |
| 29. | Rosemont | 0.23% | 0.063%(+0.164)#219 | 0.083%(+0.143)#925 |
| 30. | Rosamond | 0.22% | 0.063%(+0.160)#220 | 0.083%(+0.140)#926 |
| 31. | View Park Windsor Hills | 0.22% | 0.063%(+0.154)#221 | 0.083%(+0.133)#927 |
| 32. | Ashland | 0.22% | 0.063%(+0.153)#222 | 0.083%(+0.133)#928 |
| 33. | Alameda | 0.21% | 0.063%(+0.151)#223 | 0.083%(+0.131)#929 |
| 34. | National City | 0.21% | 0.063%(+0.150)#224 | 0.083%(+0.130)#930 |
| 35. | Placentia | 0.21% | 0.063%(+0.146)#225 | 0.083%(+0.125)#931 |
| 36. | Lemon Grove | 0.21% | 0.063%(+0.145)#226 | 0.083%(+0.124)#932 |
| 37. | Eastern Goleta Valley | 0.19% | 0.063%(+0.127)#227 | 0.083%(+0.106)#933 |
| 38. | Hercules | 0.19% | 0.063%(+0.126)#228 | 0.083%(+0.105)#934 |
| 39. | Richmond | 0.18% | 0.063%(+0.117)#229 | 0.083%(+0.097)#935 |
| 40. | Buena Park | 0.18% | 0.063%(+0.115)#230 | 0.083%(+0.094)#936 |
| 41. | San Diego | 0.18% | 0.063%(+0.114)#231 | 0.083%(+0.094)#937 |
| 42. | Los Gatos | 0.18% | 0.063%(+0.113)#232 | 0.083%(+0.092)#938 |
| 43. | Hayward | 0.17% | 0.063%(+0.106)#233 | 0.083%(+0.085)#939 |
| 44. | Camp Pendleton Mainside | 0.16% | 0.063%(+0.094)#234 | 0.083%(+0.073)#940 |
| 45. | Lakewood | 0.15% | 0.063%(+0.090)#235 | 0.083%(+0.069)#941 |
| 46. | Newark | 0.15% | 0.063%(+0.085)#236 | 0.083%(+0.064)#942 |
| 47. | Westmont | 0.15% | 0.063%(+0.085)#237 | 0.083%(+0.064)#943 |
| 48. | Tulare | 0.14% | 0.063%(+0.079)#238 | 0.083%(+0.058)#944 |
| 49. | La Mesa | 0.13% | 0.063%(+0.069)#239 | 0.083%(+0.048)#945 |
| 50. | Clovis | 0.13% | 0.063%(+0.067)#240 | 0.083%(+0.046)#946 |
| 51. | Eastvale | 0.13% | 0.063%(+0.067)#241 | 0.083%(+0.046)#947 |
| 52. | Berkeley | 0.13% | 0.063%(+0.066)#242 | 0.083%(+0.045)#948 |
| 53. | Pleasanton | 0.13% | 0.063%(+0.064)#243 | 0.083%(+0.044)#949 |
| 54. | Chino Hills | 0.13% | 0.063%(+0.064)#244 | 0.083%(+0.043)#950 |
| 55. | Calabasas | 0.12% | 0.063%(+0.059)#245 | 0.083%(+0.038)#951 |
| 56. | Carson | 0.12% | 0.063%(+0.058)#246 | 0.083%(+0.037)#952 |
| 57. | Morgan Hill | 0.12% | 0.063%(+0.057)#247 | 0.083%(+0.036)#953 |
| 58. | El Cajon | 0.12% | 0.063%(+0.054)#248 | 0.083%(+0.033)#954 |
| 59. | Commerce | 0.11% | 0.063%(+0.052)#249 | 0.083%(+0.031)#955 |
| 60. | Santa Barbara | 0.11% | 0.063%(+0.051)#250 | 0.083%(+0.031)#956 |
| 61. | Claremont | 0.11% | 0.063%(+0.051)#251 | 0.083%(+0.031)#957 |
| 62. | San Leandro | 0.11% | 0.063%(+0.050)#252 | 0.083%(+0.029)#958 |
| 63. | Los Angeles | 0.11% | 0.063%(+0.043)#253 | 0.083%(+0.022)#959 |
| 64. | Port Hueneme | 0.11% | 0.063%(+0.043)#254 | 0.083%(+0.022)#960 |
| 65. | Cherry Valley | 0.10% | 0.063%(+0.042)#255 | 0.083%(+0.021)#961 |
| 66. | Fremont | 0.10% | 0.063%(+0.041)#256 | 0.083%(+0.020)#962 |
| 67. | Rancho Cordova | 0.10% | 0.063%(+0.040)#257 | 0.083%(+0.019)#963 |
| 68. | Beaumont | 0.099% | 0.063%(+0.036)#258 | 0.083%(+0.016)#964 |
| 69. | Anaheim | 0.097% | 0.063%(+0.035)#259 | 0.083%(+0.014)#965 |
| 70. | Martinez | 0.097% | 0.063%(+0.034)#260 | 0.083%(+0.014)#966 |
| 71. | Fairfield | 0.094% | 0.063%(+0.031)#261 | 0.083%(+0.011)#967 |
| 72. | Concord | 0.094% | 0.063%(+0.031)#262 | 0.083%(+0.010)#968 |
| 73. | Castro Valley | 0.090% | 0.063%(+0.028)#263 | 0.083%(+0.007)#969 |
| 74. | Yuba City | 0.085% | 0.063%(+0.022)#264 | 0.083%(+0.002)#970 |
| 75. | Mentone | 0.082% | 0.063%(+0.020)#265 | 0.083%(-0.001)#971 |
| 76. | Fullerton | 0.082% | 0.063%(+0.019)#266 | 0.083%(-0.002)#972 |
| 77. | Huntington Beach | 0.082% | 0.063%(+0.019)#267 | 0.083%(-0.002)#973 |
| 78. | Brentwood | 0.081% | 0.063%(+0.018)#268 | 0.083%(-0.003)#974 |
| 79. | San Francisco | 0.080% | 0.063%(+0.017)#269 | 0.083%(-0.004)#975 |
| 80. | University Of California-Santa Barbara | 0.079% | 0.063%(+0.016)#270 | 0.083%(-0.005)#976 |
| 81. | Petaluma | 0.077% | 0.063%(+0.014)#271 | 0.083%(-0.006)#977 |
| 82. | North Highlands | 0.077% | 0.063%(+0.014)#272 | 0.083%(-0.006)#978 |
| 83. | Redlands | 0.076% | 0.063%(+0.014)#273 | 0.083%(-0.007)#979 |
| 84. | Highland | 0.076% | 0.063%(+0.013)#274 | 0.083%(-0.007)#980 |
| 85. | Casa De Oro Mount Helix | 0.075% | 0.063%(+0.012)#275 | 0.083%(-0.008)#981 |
| 86. | Dana Point | 0.073% | 0.063%(+0.010)#276 | 0.083%(-0.011)#982 |
| 87. | Citrus Heights | 0.072% | 0.063%(+0.010)#277 | 0.083%(-0.011)#983 |
| 88. | Santa Clara | 0.072% | 0.063%(+0.009)#278 | 0.083%(-0.011)#984 |
| 89. | Yorba Linda | 0.071% | 0.063%(+0.008)#279 | 0.083%(-0.013)#985 |
| 90. | Garden Grove | 0.070% | 0.063%(+0.008)#280 | 0.083%(-0.013)#986 |
| 91. | Poway | 0.070% | 0.063%(+0.007)#281 | 0.083%(-0.013)#987 |
| 92. | South Gate | 0.069% | 0.063%(+0.007)#282 | 0.083%(-0.014)#988 |
| 93. | Redondo Beach | 0.068% | 0.063%(+0.005)#283 | 0.083%(-0.015)#989 |
| 94. | Blythe | 0.067% | 0.063%(+0.004)#284 | 0.083%(-0.016)#990 |
| 95. | Vallejo | 0.066% | 0.063%(+0.004)#285 | 0.083%(-0.017)#991 |
| 96. | Modesto | 0.066% | 0.063%(+0.003)#286 | 0.083%(-0.018)#992 |
| 97. | Goleta | 0.064% | 0.063%(+0.002)#287 | 0.083%(-0.019)#993 |
| 98. | Coronado | 0.064% | 0.063%(+0.001)#288 | 0.083%(-0.020)#994 |
| 99. | Sacramento | 0.063% | 0.063%(+0.001)#289 | 0.083%(-0.020)#995 |
| 100. | Stanton | 0.063% | 0.063%(+0.000)#290 | 0.083%(-0.020)#996 |
Common Questions
What are the Top 10 Cities with the Highest Percentage of Immigrants from Ethiopia in California?
Top 10 Cities with the Highest Percentage of Immigrants from Ethiopia in California are:
#1
1.60%
#2
1.39%
#3
0.80%
#4
0.54%
#5
0.49%
#6
0.49%
#7
0.47%
#8
0.47%
#9
0.47%
#10
0.45%
What city has the Highest Percentage of Immigrants from Ethiopia in California?
Contra Costa Centre has the Highest Percentage of Immigrants from Ethiopia in California with 1.60%.
What is the Percentage of Immigrants from Ethiopia in the State of California?
Percentage of Immigrants from Ethiopia in California is 0.063%.
What is the Percentage of Immigrants from Ethiopia in the United States?
Percentage of Immigrants from Ethiopia in the United States is 0.083%.