Cities with the Highest Percentage of Creek Population in California
RELATED REPORTS & OPTIONS
Creek
California
Compare Cities
Map of Cities with the Highest Percentage of Creek Population in California
0.00%
30.00%
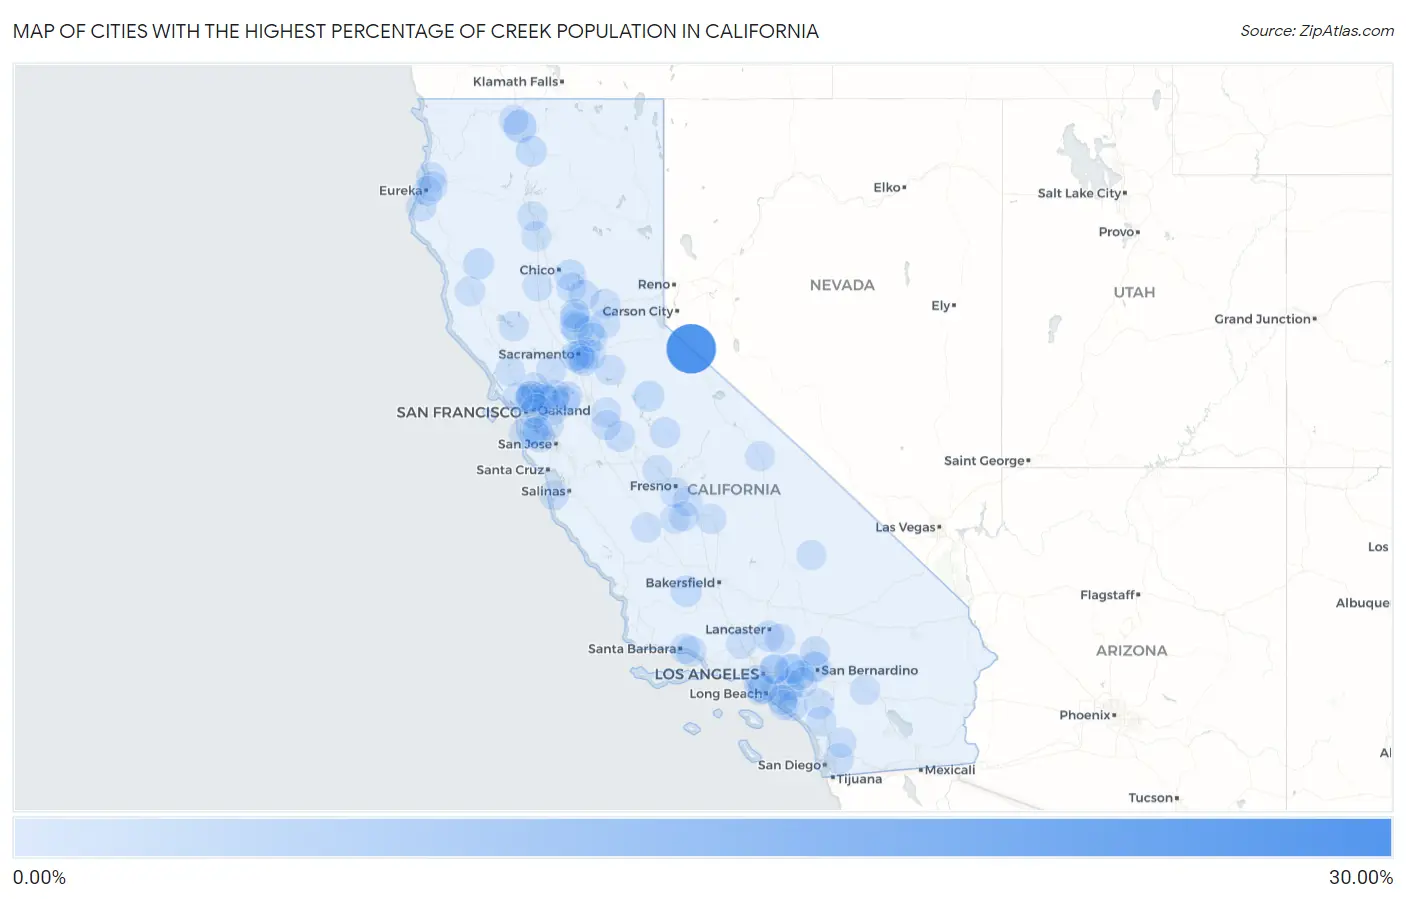
Cities with the Highest Percentage of Creek Population in California
| City | Creek | vs State | vs National | |
| 1. | Topaz | 25.31% | 0.019% (+25.3)#1 | 0.033% (+25.3)#5 |
| 2. | Grenada | 3.91% | 0.019% (+3.89)#2 | 0.033% (+3.88)#95 |
| 3. | North Fork | 2.10% | 0.019% (+2.09)#3 | 0.033% (+2.07)#174 |
| 4. | Trowbridge | 2.08% | 0.019% (+2.06)#4 | 0.033% (+2.05)#176 |
| 5. | Derby Acres | 1.68% | 0.019% (+1.66)#5 | 0.033% (+1.65)#216 |
| 6. | Butte Valley | 1.48% | 0.019% (+1.46)#6 | 0.033% (+1.45)#238 |
| 7. | Covelo | 1.25% | 0.019% (+1.23)#7 | 0.033% (+1.22)#273 |
| 8. | Mount Shasta | 1.17% | 0.019% (+1.16)#8 | 0.033% (+1.14)#290 |
| 9. | Soulsbyville | 1.17% | 0.019% (+1.15)#9 | 0.033% (+1.13)#297 |
| 10. | Delhi | 1.01% | 0.019% (+0.991)#10 | 0.033% (+0.977)#324 |
| 11. | Desert View Highlands | 0.98% | 0.019% (+0.958)#11 | 0.033% (+0.945)#332 |
| 12. | Mariposa | 0.85% | 0.019% (+0.830)#12 | 0.033% (+0.817)#371 |
| 13. | Clayton | 0.75% | 0.019% (+0.731)#13 | 0.033% (+0.717)#403 |
| 14. | Ferndale | 0.51% | 0.019% (+0.491)#14 | 0.033% (+0.477)#529 |
| 15. | Bangor | 0.50% | 0.019% (+0.483)#15 | 0.033% (+0.469)#536 |
| 16. | West Carson | 0.49% | 0.019% (+0.476)#16 | 0.033% (+0.462)#542 |
| 17. | Sage | 0.46% | 0.019% (+0.443)#17 | 0.033% (+0.429)#558 |
| 18. | Tara Hills | 0.44% | 0.019% (+0.423)#18 | 0.033% (+0.410)#570 |
| 19. | Carpinteria | 0.37% | 0.019% (+0.353)#19 | 0.033% (+0.339)#628 |
| 20. | Wildomar | 0.35% | 0.019% (+0.332)#20 | 0.033% (+0.318)#646 |
| 21. | Mckinleyville | 0.34% | 0.019% (+0.324)#21 | 0.033% (+0.310)#654 |
| 22. | Granite Hills | 0.33% | 0.019% (+0.313)#22 | 0.033% (+0.299)#668 |
| 23. | Ione | 0.32% | 0.019% (+0.298)#23 | 0.033% (+0.284)#685 |
| 24. | Brentwood | 0.31% | 0.019% (+0.293)#24 | 0.033% (+0.279)#688 |
| 25. | Sun Village | 0.30% | 0.019% (+0.278)#25 | 0.033% (+0.264)#704 |
| 26. | Montalvin Manor | 0.27% | 0.019% (+0.255)#26 | 0.033% (+0.241)#729 |
| 27. | Lemoore | 0.23% | 0.019% (+0.215)#27 | 0.033% (+0.201)#778 |
| 28. | Easton | 0.20% | 0.019% (+0.185)#28 | 0.033% (+0.171)#826 |
| 29. | Nevada City | 0.19% | 0.019% (+0.172)#29 | 0.033% (+0.158)#844 |
| 30. | Lincoln | 0.19% | 0.019% (+0.167)#30 | 0.033% (+0.153)#855 |
| 31. | Half Moon Bay | 0.17% | 0.019% (+0.153)#31 | 0.033% (+0.139)#874 |
| 32. | Cypress | 0.17% | 0.019% (+0.147)#32 | 0.033% (+0.134)#884 |
| 33. | Fallbrook | 0.16% | 0.019% (+0.145)#33 | 0.033% (+0.131)#893 |
| 34. | Escalon | 0.16% | 0.019% (+0.142)#34 | 0.033% (+0.128)#896 |
| 35. | Exeter | 0.15% | 0.019% (+0.136)#35 | 0.033% (+0.122)#904 |
| 36. | Pacific Grove | 0.15% | 0.019% (+0.134)#36 | 0.033% (+0.120)#908 |
| 37. | Red Bluff | 0.15% | 0.019% (+0.132)#37 | 0.033% (+0.118)#911 |
| 38. | Arden Arcade | 0.15% | 0.019% (+0.130)#38 | 0.033% (+0.116)#913 |
| 39. | Danville | 0.15% | 0.019% (+0.129)#39 | 0.033% (+0.115)#915 |
| 40. | Pittsburg | 0.14% | 0.019% (+0.120)#40 | 0.033% (+0.106)#943 |
| 41. | Anderson | 0.13% | 0.019% (+0.114)#41 | 0.033% (+0.101)#957 |
| 42. | Willows | 0.13% | 0.019% (+0.110)#42 | 0.033% (+0.096)#964 |
| 43. | Castaic | 0.13% | 0.019% (+0.110)#43 | 0.033% (+0.096)#967 |
| 44. | Plumas Lake | 0.12% | 0.019% (+0.102)#44 | 0.033% (+0.088)#985 |
| 45. | Yorba Linda | 0.12% | 0.019% (+0.099)#45 | 0.033% (+0.085)#996 |
| 46. | Searles Valley | 0.12% | 0.019% (+0.098)#46 | 0.033% (+0.084)#999 |
| 47. | Yreka | 0.11% | 0.019% (+0.096)#47 | 0.033% (+0.082)#1,008 |
| 48. | Meadow Vista | 0.11% | 0.019% (+0.093)#48 | 0.033% (+0.079)#1,016 |
| 49. | Rancho Cordova | 0.11% | 0.019% (+0.090)#49 | 0.033% (+0.076)#1,026 |
| 50. | Thermalito | 0.10% | 0.019% (+0.084)#50 | 0.033% (+0.071)#1,046 |
| 51. | Sacramento | 0.10% | 0.019% (+0.082)#51 | 0.033% (+0.068)#1,053 |
| 52. | Orange | 0.097% | 0.019% (+0.079)#52 | 0.033% (+0.065)#1,068 |
| 53. | Martinez | 0.097% | 0.019% (+0.078)#53 | 0.033% (+0.065)#1,069 |
| 54. | Kingsburg | 0.096% | 0.019% (+0.077)#54 | 0.033% (+0.064)#1,071 |
| 55. | Vallejo | 0.096% | 0.019% (+0.077)#55 | 0.033% (+0.063)#1,072 |
| 56. | Linda | 0.095% | 0.019% (+0.076)#56 | 0.033% (+0.062)#1,080 |
| 57. | Montecito | 0.094% | 0.019% (+0.075)#57 | 0.033% (+0.061)#1,081 |
| 58. | Clearlake | 0.090% | 0.019% (+0.072)#58 | 0.033% (+0.058)#1,091 |
| 59. | Lemon Hill | 0.088% | 0.019% (+0.069)#59 | 0.033% (+0.055)#1,094 |
| 60. | Ramona | 0.086% | 0.019% (+0.067)#60 | 0.033% (+0.053)#1,101 |
| 61. | Arcata | 0.081% | 0.019% (+0.062)#61 | 0.033% (+0.048)#1,112 |
| 62. | San Bernardino | 0.081% | 0.019% (+0.062)#62 | 0.033% (+0.048)#1,114 |
| 63. | Oakley | 0.080% | 0.019% (+0.062)#63 | 0.033% (+0.048)#1,115 |
| 64. | Coalinga | 0.080% | 0.019% (+0.061)#64 | 0.033% (+0.048)#1,119 |
| 65. | Eureka | 0.079% | 0.019% (+0.061)#65 | 0.033% (+0.047)#1,124 |
| 66. | Madera | 0.078% | 0.019% (+0.059)#66 | 0.033% (+0.045)#1,128 |
| 67. | Eastern Goleta Valley | 0.078% | 0.019% (+0.059)#67 | 0.033% (+0.045)#1,130 |
| 68. | West Sacramento | 0.076% | 0.019% (+0.057)#68 | 0.033% (+0.043)#1,141 |
| 69. | Olivehurst | 0.075% | 0.019% (+0.056)#69 | 0.033% (+0.042)#1,148 |
| 70. | Inglewood | 0.070% | 0.019% (+0.052)#70 | 0.033% (+0.038)#1,162 |
| 71. | Rocklin | 0.068% | 0.019% (+0.050)#71 | 0.033% (+0.036)#1,170 |
| 72. | Union City | 0.068% | 0.019% (+0.049)#72 | 0.033% (+0.035)#1,175 |
| 73. | Cathedral City | 0.067% | 0.019% (+0.049)#73 | 0.033% (+0.035)#1,176 |
| 74. | Big Pine | 0.064% | 0.019% (+0.045)#74 | 0.033% (+0.031)#1,192 |
| 75. | Stanford | 0.064% | 0.019% (+0.045)#75 | 0.033% (+0.031)#1,194 |
| 76. | Claremont | 0.060% | 0.019% (+0.041)#76 | 0.033% (+0.027)#1,214 |
| 77. | Aliso Viejo | 0.056% | 0.019% (+0.037)#77 | 0.033% (+0.023)#1,232 |
| 78. | Vacaville | 0.055% | 0.019% (+0.036)#78 | 0.033% (+0.023)#1,236 |
| 79. | Modesto | 0.055% | 0.019% (+0.036)#79 | 0.033% (+0.022)#1,237 |
| 80. | Alameda | 0.053% | 0.019% (+0.034)#80 | 0.033% (+0.020)#1,250 |
| 81. | Muscoy | 0.051% | 0.019% (+0.032)#81 | 0.033% (+0.018)#1,258 |
| 82. | Pleasant Hill | 0.046% | 0.019% (+0.028)#82 | 0.033% (+0.014)#1,291 |
| 83. | Brooktrails | 0.045% | 0.019% (+0.026)#83 | 0.033% (+0.012)#1,299 |
| 84. | Richmond | 0.045% | 0.019% (+0.026)#84 | 0.033% (+0.012)#1,300 |
| 85. | La Verne | 0.045% | 0.019% (+0.026)#85 | 0.033% (+0.012)#1,302 |
| 86. | Piedmont | 0.045% | 0.019% (+0.026)#86 | 0.033% (+0.012)#1,303 |
| 87. | Temple City | 0.044% | 0.019% (+0.026)#87 | 0.033% (+0.012)#1,307 |
| 88. | Norco | 0.043% | 0.019% (+0.025)#88 | 0.033% (+0.011)#1,316 |
| 89. | Redwood City | 0.043% | 0.019% (+0.025)#89 | 0.033% (+0.011)#1,317 |
| 90. | Arcadia | 0.043% | 0.019% (+0.024)#90 | 0.033% (+0.010)#1,320 |
| 91. | Ontario | 0.043% | 0.019% (+0.024)#91 | 0.033% (+0.010)#1,322 |
| 92. | Florin | 0.040% | 0.019% (+0.021)#92 | 0.033% (+0.007)#1,330 |
| 93. | Newport Beach | 0.040% | 0.019% (+0.021)#93 | 0.033% (+0.007)#1,332 |
| 94. | Hanford | 0.040% | 0.019% (+0.021)#94 | 0.033% (+0.007)#1,335 |
| 95. | Costa Mesa | 0.039% | 0.019% (+0.021)#95 | 0.033% (+0.007)#1,338 |
| 96. | San Carlos | 0.039% | 0.019% (+0.021)#96 | 0.033% (+0.007)#1,340 |
| 97. | San Anselmo | 0.039% | 0.019% (+0.021)#97 | 0.033% (+0.007)#1,342 |
| 98. | Rohnert Park | 0.038% | 0.019% (+0.020)#98 | 0.033% (+0.006)#1,349 |
| 99. | Carson | 0.038% | 0.019% (+0.019)#99 | 0.033% (+0.006)#1,352 |
| 100. | Hesperia | 0.036% | 0.019% (+0.017)#100 | 0.033% (+0.003)#1,368 |
Common Questions
What are the Top 10 Cities with the Highest Percentage of Creek Population in California?
Top 10 Cities with the Highest Percentage of Creek Population in California are:
#1
25.31%
#2
3.91%
#3
2.08%
#4
1.68%
#5
1.48%
#6
1.25%
#7
1.17%
#8
1.17%
#9
1.01%
#10
0.98%
What city has the Highest Percentage of Creek Population in California?
Topaz has the Highest Percentage of Creek Population in California with 25.31%.
What is the Percentage of Creek Population in the State of California?
Percentage of Creek Population in California is 0.019%.
What is the Percentage of Creek Population in the United States?
Percentage of Creek Population in the United States is 0.033%.