Cities with the Highest Percentage of Immigrants from Venezuela in California
RELATED REPORTS & OPTIONS
Venezuela
California
Compare Cities
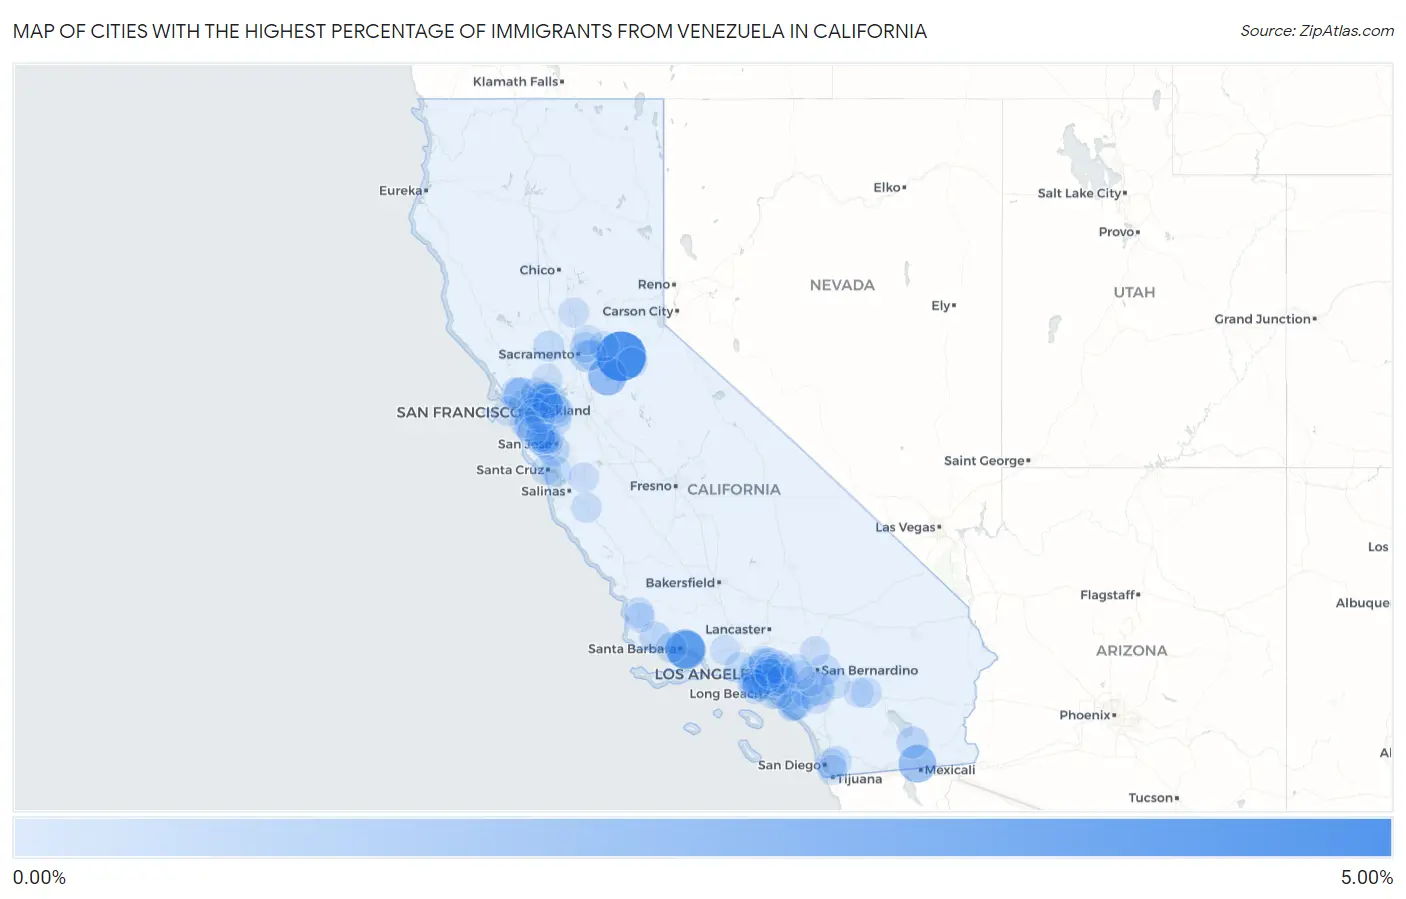
Map of Cities with the Highest Percentage of Immigrants from Venezuela in California
0.00%
5.00%
Cities with the Highest Percentage of Immigrants from Venezuela in California
| City | Venezuela | vs State | vs National | |
| 1. | River Pines | 4.72% | 0.043%(+4.68)#8 | 0.16%(+4.57)#458 |
| 2. | Montecito | 2.17% | 0.043%(+2.13)#32 | 0.16%(+2.01)#1,170 |
| 3. | Summerland | 2.12% | 0.043%(+2.08)#41 | 0.16%(+1.96)#1,286 |
| 4. | Camanche Village | 2.06% | 0.043%(+2.01)#46 | 0.16%(+1.90)#1,344 |
| 5. | Heber | 1.86% | 0.043%(+1.82)#59 | 0.16%(+1.70)#1,503 |
| 6. | Acalanes Ridge | 1.46% | 0.043%(+1.41)#100 | 0.16%(+1.30)#1,953 |
| 7. | Santa Venetia | 1.24% | 0.043%(+1.20)#101 | 0.16%(+1.08)#1,954 |
| 8. | Camino Tassajara | 0.82% | 0.043%(+0.774)#213 | 0.16%(+0.661)#2,898 |
| 9. | Mead Valley | 0.79% | 0.043%(+0.749)#238 | 0.16%(+0.635)#3,075 |
| 10. | Cambrian Park | 0.56% | 0.043%(+0.520)#239 | 0.16%(+0.406)#3,076 |
| 11. | Westmorland | 0.55% | 0.043%(+0.504)#240 | 0.16%(+0.390)#3,077 |
| 12. | Solvang | 0.48% | 0.043%(+0.437)#415 | 0.16%(+0.324)#4,592 |
| 13. | Altadena | 0.47% | 0.043%(+0.425)#416 | 0.16%(+0.311)#4,593 |
| 14. | Rosemont | 0.44% | 0.043%(+0.393)#417 | 0.16%(+0.279)#4,594 |
| 15. | Culver City | 0.42% | 0.043%(+0.373)#418 | 0.16%(+0.260)#4,595 |
| 16. | North Tustin | 0.39% | 0.043%(+0.347)#419 | 0.16%(+0.233)#4,596 |
| 17. | Huntington Park | 0.33% | 0.043%(+0.287)#420 | 0.16%(+0.173)#4,597 |
| 18. | Esparto | 0.31% | 0.043%(+0.262)#421 | 0.16%(+0.149)#4,598 |
| 19. | Concord | 0.30% | 0.043%(+0.261)#422 | 0.16%(+0.147)#4,599 |
| 20. | Beverly Hills | 0.29% | 0.043%(+0.250)#423 | 0.16%(+0.136)#4,600 |
| 21. | Alamo | 0.27% | 0.043%(+0.228)#424 | 0.16%(+0.115)#4,601 |
| 22. | La Habra Heights | 0.27% | 0.043%(+0.225)#436 | 0.16%(+0.111)#4,856 |
| 23. | Highland | 0.27% | 0.043%(+0.223)#437 | 0.16%(+0.109)#4,857 |
| 24. | Tiburon | 0.26% | 0.043%(+0.220)#438 | 0.16%(+0.107)#4,858 |
| 25. | La Crescenta Montrose | 0.25% | 0.043%(+0.206)#439 | 0.16%(+0.092)#4,859 |
| 26. | Rio Del Mar | 0.24% | 0.043%(+0.201)#440 | 0.16%(+0.087)#4,860 |
| 27. | Calabasas | 0.24% | 0.043%(+0.199)#441 | 0.16%(+0.086)#4,861 |
| 28. | Goleta | 0.24% | 0.043%(+0.199)#442 | 0.16%(+0.085)#4,862 |
| 29. | Rancho Cordova | 0.24% | 0.043%(+0.198)#443 | 0.16%(+0.085)#4,863 |
| 30. | Rancho Mirage | 0.24% | 0.043%(+0.194)#444 | 0.16%(+0.081)#4,864 |
| 31. | Lucas Valley Marinwood | 0.24% | 0.043%(+0.194)#445 | 0.16%(+0.080)#4,865 |
| 32. | West Covina | 0.23% | 0.043%(+0.182)#446 | 0.16%(+0.069)#4,866 |
| 33. | Casa De Oro Mount Helix | 0.22% | 0.043%(+0.181)#447 | 0.16%(+0.068)#4,867 |
| 34. | Emeryville | 0.22% | 0.043%(+0.175)#448 | 0.16%(+0.061)#4,868 |
| 35. | Laguna Hills | 0.21% | 0.043%(+0.172)#449 | 0.16%(+0.058)#4,869 |
| 36. | Brisbane | 0.21% | 0.043%(+0.167)#450 | 0.16%(+0.053)#4,870 |
| 37. | Mission Viejo | 0.21% | 0.043%(+0.164)#451 | 0.16%(+0.050)#4,871 |
| 38. | Hawthorne | 0.21% | 0.043%(+0.164)#452 | 0.16%(+0.050)#4,872 |
| 39. | Glendale | 0.21% | 0.043%(+0.163)#453 | 0.16%(+0.050)#4,873 |
| 40. | North Highlands | 0.21% | 0.043%(+0.163)#454 | 0.16%(+0.049)#4,874 |
| 41. | Loyola | 0.18% | 0.043%(+0.140)#455 | 0.16%(+0.027)#4,875 |
| 42. | Piedmont | 0.18% | 0.043%(+0.136)#494 | 0.16%(+0.022)#5,479 |
| 43. | Palo Alto | 0.17% | 0.043%(+0.129)#495 | 0.16%(+0.016)#5,480 |
| 44. | Bellflower | 0.17% | 0.043%(+0.129)#496 | 0.16%(+0.016)#5,481 |
| 45. | Menlo Park | 0.17% | 0.043%(+0.128)#497 | 0.16%(+0.014)#5,482 |
| 46. | Pleasanton | 0.17% | 0.043%(+0.125)#498 | 0.16%(+0.011)#5,483 |
| 47. | West Rancho Dominguez | 0.17% | 0.043%(+0.124)#525 | 0.16%(+0.010)#5,859 |
| 48. | Soledad | 0.16% | 0.043%(+0.118)#526 | 0.16%(+0.005)#5,860 |
| 49. | Brea | 0.16% | 0.043%(+0.118)#527 | 0.16%(+0.005)#5,861 |
| 50. | Pleasant Hill | 0.16% | 0.043%(+0.116)#528 | 0.16%(+0.003)#5,862 |
| 51. | Lemon Grove | 0.16% | 0.043%(+0.113)#529 | 0.16%(-0.000)#5,863 |
| 52. | Alondra Park | 0.16% | 0.043%(+0.113)#530 | 0.16%(-0.000)#5,864 |
| 53. | Inglewood | 0.15% | 0.043%(+0.109)#531 | 0.16%(-0.004)#5,865 |
| 54. | Aliso Viejo | 0.15% | 0.043%(+0.109)#532 | 0.16%(-0.005)#5,866 |
| 55. | Duarte | 0.15% | 0.043%(+0.109)#533 | 0.16%(-0.005)#5,867 |
| 56. | Seal Beach | 0.14% | 0.043%(+0.101)#534 | 0.16%(-0.013)#5,868 |
| 57. | Crockett | 0.14% | 0.043%(+0.097)#535 | 0.16%(-0.017)#5,869 |
| 58. | San Bruno | 0.14% | 0.043%(+0.093)#536 | 0.16%(-0.020)#5,870 |
| 59. | Santa Maria | 0.14% | 0.043%(+0.093)#537 | 0.16%(-0.021)#5,871 |
| 60. | Buckhorn | 0.13% | 0.043%(+0.082)#538 | 0.16%(-0.032)#5,872 |
| 61. | Martinez | 0.12% | 0.043%(+0.081)#539 | 0.16%(-0.033)#5,873 |
| 62. | El Dorado Hills | 0.12% | 0.043%(+0.079)#540 | 0.16%(-0.035)#5,874 |
| 63. | Burlingame | 0.12% | 0.043%(+0.073)#541 | 0.16%(-0.041)#5,875 |
| 64. | Cupertino | 0.12% | 0.043%(+0.072)#542 | 0.16%(-0.041)#5,876 |
| 65. | San Francisco | 0.12% | 0.043%(+0.072)#543 | 0.16%(-0.042)#5,877 |
| 66. | Fairfield | 0.11% | 0.043%(+0.071)#544 | 0.16%(-0.043)#5,878 |
| 67. | Sunnyvale | 0.11% | 0.043%(+0.071)#545 | 0.16%(-0.043)#5,879 |
| 68. | Roseville | 0.11% | 0.043%(+0.070)#546 | 0.16%(-0.043)#5,880 |
| 69. | San Marino | 0.11% | 0.043%(+0.069)#547 | 0.16%(-0.044)#5,881 |
| 70. | Garden Grove | 0.11% | 0.043%(+0.068)#548 | 0.16%(-0.046)#5,882 |
| 71. | Temescal Valley | 0.11% | 0.043%(+0.067)#549 | 0.16%(-0.047)#5,883 |
| 72. | La Canada Flintridge | 0.11% | 0.043%(+0.065)#550 | 0.16%(-0.049)#5,884 |
| 73. | South Whittier | 0.11% | 0.043%(+0.063)#551 | 0.16%(-0.050)#5,885 |
| 74. | Maywood | 0.10% | 0.043%(+0.061)#552 | 0.16%(-0.053)#5,886 |
| 75. | Mountain View | 0.10% | 0.043%(+0.060)#553 | 0.16%(-0.053)#5,887 |
| 76. | South Monrovia Island | 0.10% | 0.043%(+0.059)#554 | 0.16%(-0.054)#5,888 |
| 77. | Alhambra | 0.10% | 0.043%(+0.058)#555 | 0.16%(-0.056)#5,889 |
| 78. | Torrance | 0.10% | 0.043%(+0.057)#556 | 0.16%(-0.056)#5,890 |
| 79. | El Segundo | 0.100% | 0.043%(+0.056)#557 | 0.16%(-0.057)#5,891 |
| 80. | Santa Cruz | 0.099% | 0.043%(+0.056)#558 | 0.16%(-0.057)#5,892 |
| 81. | Alameda | 0.099% | 0.043%(+0.056)#559 | 0.16%(-0.058)#5,893 |
| 82. | Stanford | 0.099% | 0.043%(+0.055)#560 | 0.16%(-0.058)#5,894 |
| 83. | Hesperia | 0.098% | 0.043%(+0.055)#561 | 0.16%(-0.059)#5,895 |
| 84. | Rowland Heights | 0.097% | 0.043%(+0.054)#562 | 0.16%(-0.059)#5,896 |
| 85. | Fillmore | 0.097% | 0.043%(+0.054)#563 | 0.16%(-0.060)#5,897 |
| 86. | Monterey Park | 0.094% | 0.043%(+0.051)#564 | 0.16%(-0.062)#5,898 |
| 87. | Lake Elsinore | 0.094% | 0.043%(+0.051)#565 | 0.16%(-0.062)#5,899 |
| 88. | Palm Springs | 0.093% | 0.043%(+0.050)#566 | 0.16%(-0.063)#5,900 |
| 89. | Chula Vista | 0.092% | 0.043%(+0.049)#567 | 0.16%(-0.064)#5,901 |
| 90. | Upland | 0.090% | 0.043%(+0.047)#568 | 0.16%(-0.067)#5,902 |
| 91. | Riverside | 0.089% | 0.043%(+0.046)#569 | 0.16%(-0.068)#5,903 |
| 92. | Beaumont | 0.088% | 0.043%(+0.045)#570 | 0.16%(-0.069)#5,904 |
| 93. | Marysville | 0.087% | 0.043%(+0.044)#658 | 0.16%(-0.070)#7,519 |
| 94. | Orcutt | 0.087% | 0.043%(+0.044)#659 | 0.16%(-0.070)#7,520 |
| 95. | Hollister | 0.086% | 0.043%(+0.042)#660 | 0.16%(-0.071)#7,521 |
| 96. | Blackhawk | 0.085% | 0.043%(+0.042)#661 | 0.16%(-0.072)#7,522 |
| 97. | San Leandro | 0.084% | 0.043%(+0.040)#662 | 0.16%(-0.073)#7,523 |
| 98. | Belmont | 0.083% | 0.043%(+0.039)#663 | 0.16%(-0.074)#7,524 |
| 99. | Ontario | 0.082% | 0.043%(+0.039)#664 | 0.16%(-0.075)#7,525 |
| 100. | Walnut Creek | 0.082% | 0.043%(+0.038)#665 | 0.16%(-0.075)#7,526 |
Common Questions
What are the Top 10 Cities with the Highest Percentage of Immigrants from Venezuela in California?
Top 10 Cities with the Highest Percentage of Immigrants from Venezuela in California are:
#1
4.72%
#2
2.17%
#3
2.12%
#4
2.06%
#5
1.86%
#6
1.46%
#7
1.24%
#8
0.82%
#9
0.79%
#10
0.56%
What city has the Highest Percentage of Immigrants from Venezuela in California?
River Pines has the Highest Percentage of Immigrants from Venezuela in California with 4.72%.
What is the Percentage of Immigrants from Venezuela in the State of California?
Percentage of Immigrants from Venezuela in California is 0.043%.
What is the Percentage of Immigrants from Venezuela in the United States?
Percentage of Immigrants from Venezuela in the United States is 0.16%.