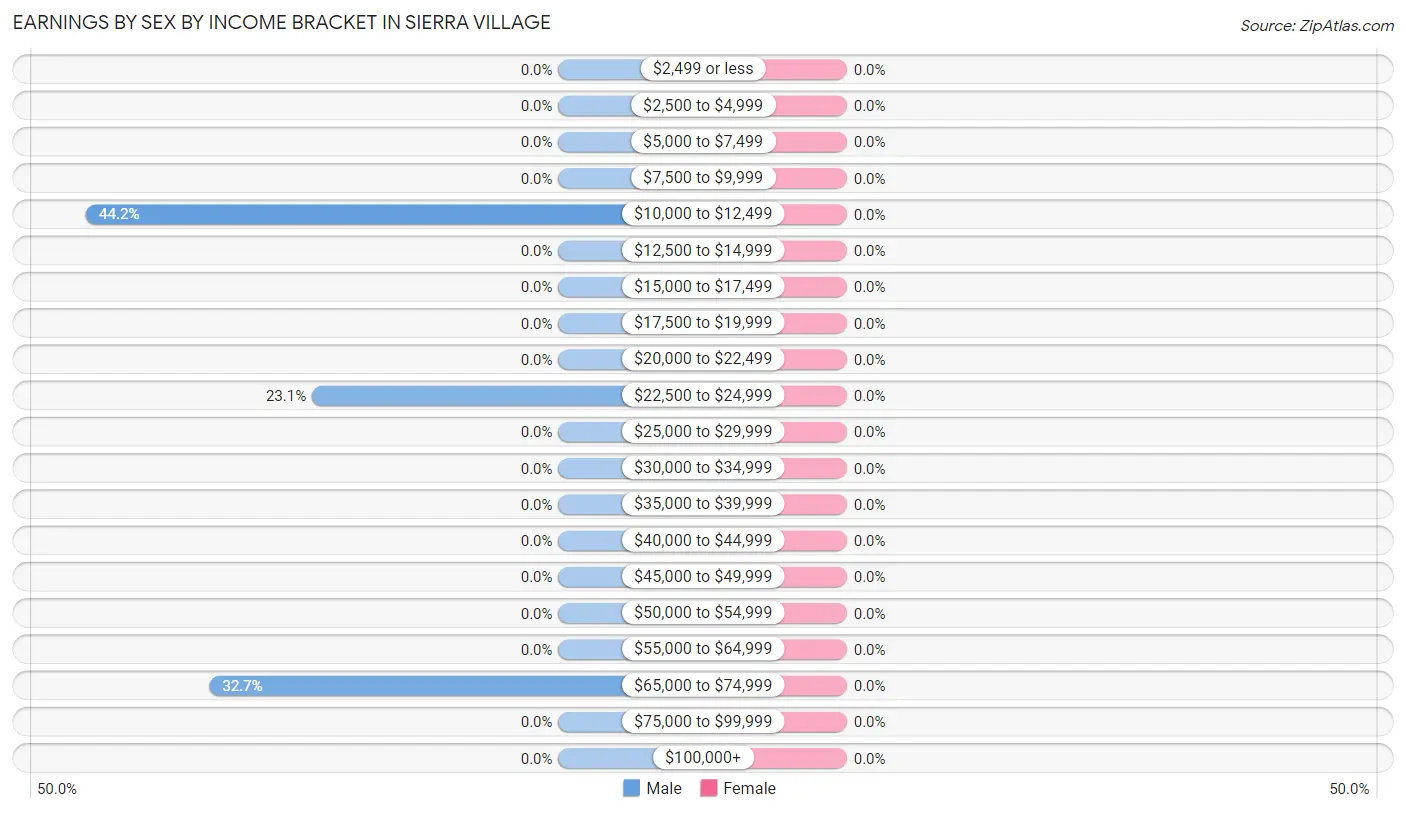
Earnings by Sex by Income Bracket in Sierra Village
Income
Male
Female
$2,499 or less
0 (0.0%)
0 (0.0%)
$2,500 to $4,999
0 (0.0%)
0 (0.0%)
$5,000 to $7,499
0 (0.0%)
0 (0.0%)
$7,500 to $9,999
0 (0.0%)
0 (0.0%)
$10,000 to $12,499
23 (44.2%)
0 (0.0%)
$12,500 to $14,999
0 (0.0%)
0 (0.0%)
$15,000 to $17,499
0 (0.0%)
0 (0.0%)
$17,500 to $19,999
0 (0.0%)
0 (0.0%)
$20,000 to $22,499
0 (0.0%)
0 (0.0%)
$22,500 to $24,999
12 (23.1%)
0 (0.0%)
$25,000 to $29,999
0 (0.0%)
0 (0.0%)
$30,000 to $34,999
0 (0.0%)
0 (0.0%)
$35,000 to $39,999
0 (0.0%)
0 (0.0%)
$40,000 to $44,999
0 (0.0%)
0 (0.0%)
$45,000 to $49,999
0 (0.0%)
0 (0.0%)
$50,000 to $54,999
0 (0.0%)
0 (0.0%)
$55,000 to $64,999
0 (0.0%)
0 (0.0%)
$65,000 to $74,999
17 (32.7%)
0 (0.0%)
$75,000 to $99,999
0 (0.0%)
0 (0.0%)
$100,000+
0 (0.0%)
0 (0.0%)
Total
52 (100.0%)
0 (0.0%)
Earnings by Sex by Educational Attainment in Sierra Village
Educational Attainment
Male Income
Female Income
Less than High School
-
-
High School Diploma
-
-
College or Associate's Degree
-
-
Bachelor's Degree
-
-
Graduate Degree
-
-
Total
-
-
Family Income in Sierra Village
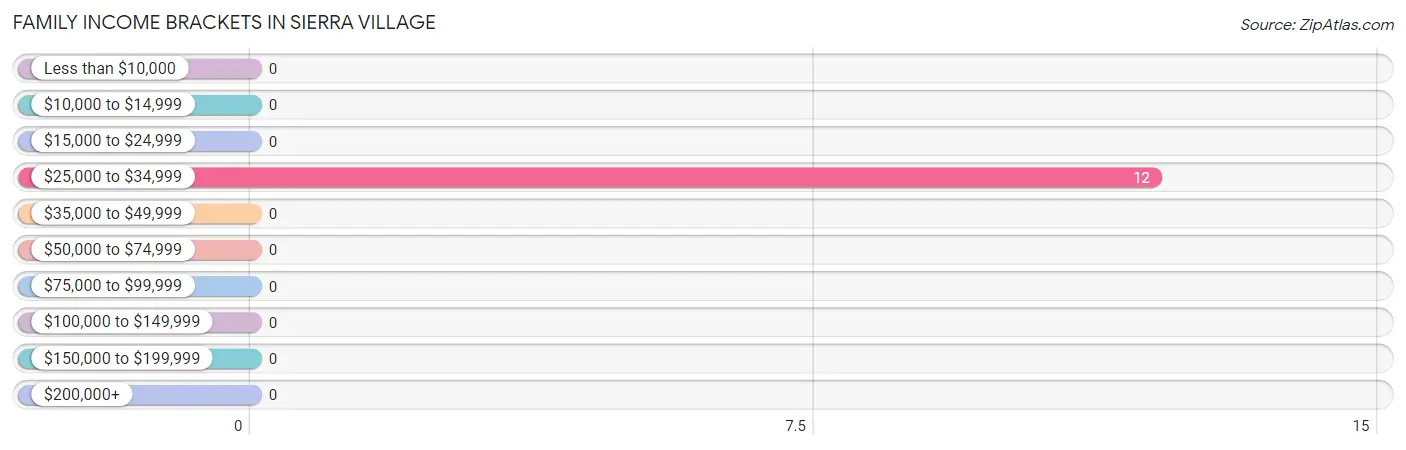
Family Income Brackets in Sierra Village
According to the Sierra Village family income data, there are 12 families falling into the $25,000 to $34,999 income range, which is the most common income bracket and makes up 100.0% of all families.
Income Bracket
# Families
% Families
Less than $10,000
0
0.0%
$10,000 to $14,999
0
0.0%
$15,000 to $24,999
0
0.0%
$25,000 to $34,999
12
100.0%
$35,000 to $49,999
0
0.0%
$50,000 to $74,999
0
0.0%
$75,000 to $99,999
0
0.0%
$100,000 to $149,999
0
0.0%
$150,000 to $199,999
0
0.0%
$200,000+
0
0.0%
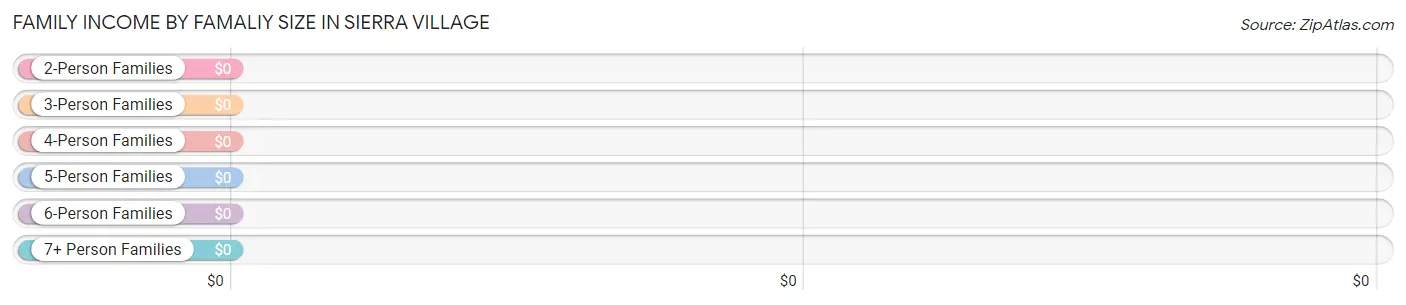
Family Income by Famaliy Size in Sierra Village
Income Bracket
# Families
Median Income
2-Person Families
12 (100.0%)
$0
3-Person Families
0 (0.0%)
$0
4-Person Families
0 (0.0%)
$0
5-Person Families
0 (0.0%)
$0
6-Person Families
0 (0.0%)
$0
7+ Person Families
0 (0.0%)
$0
Total
12 (100.0%)
$0
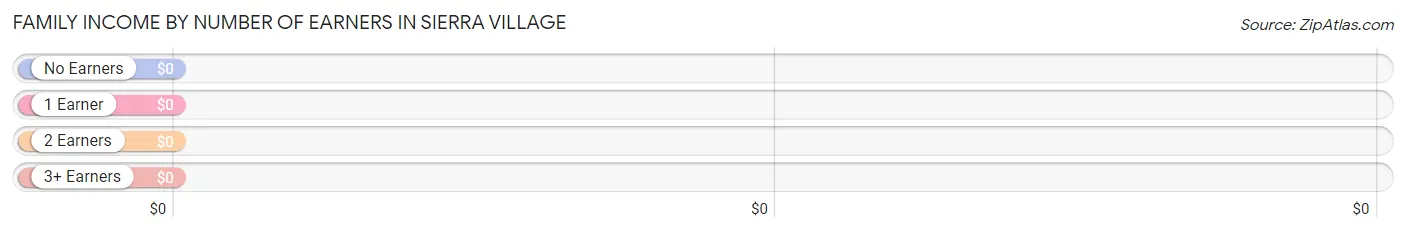
Family Income by Number of Earners in Sierra Village
Number of Earners
# Families
Median Income
No Earners
0 (0.0%)
$0
1 Earner
12 (100.0%)
$0
2 Earners
0 (0.0%)
$0
3+ Earners
0 (0.0%)
$0
Total
12 (100.0%)
$0
Household Income in Sierra Village
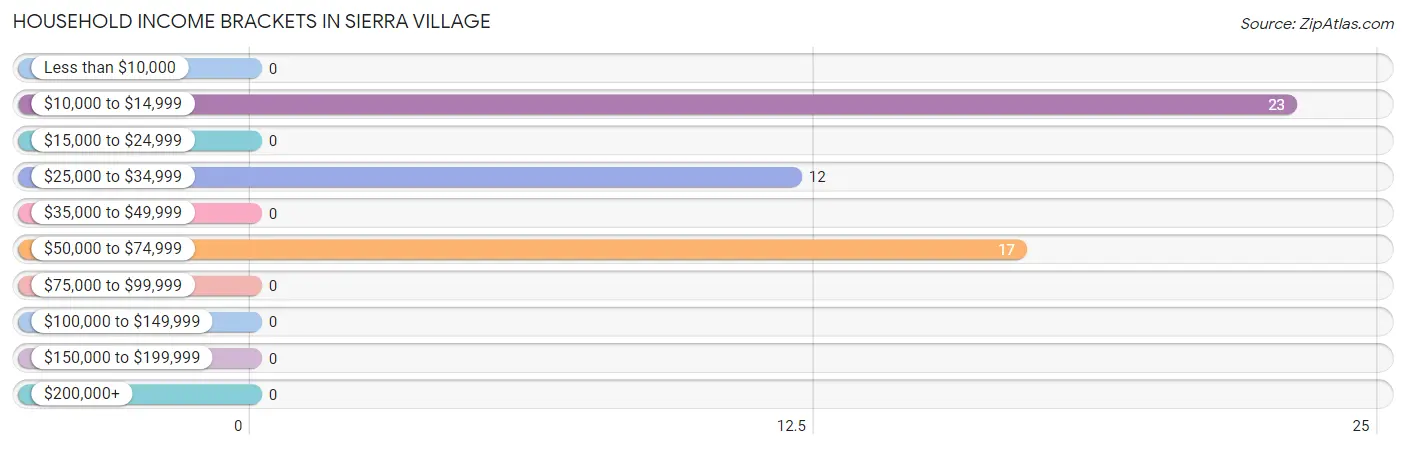
Household Income Brackets in Sierra Village
With 23 households falling in the category, the $10,000 to $14,999 income range is the most frequent in Sierra Village, accounting for 44.2% of all households.
Income Bracket
# Households
% Households
Less than $10,000
0
0.0%
$10,000 to $14,999
23
44.2%
$15,000 to $24,999
0
0.0%
$25,000 to $34,999
12
23.1%
$35,000 to $49,999
0
0.0%
$50,000 to $74,999
17
32.7%
$75,000 to $99,999
0
0.0%
$100,000 to $149,999
0
0.0%
$150,000 to $199,999
0
0.0%
$200,000+
0
0.0%
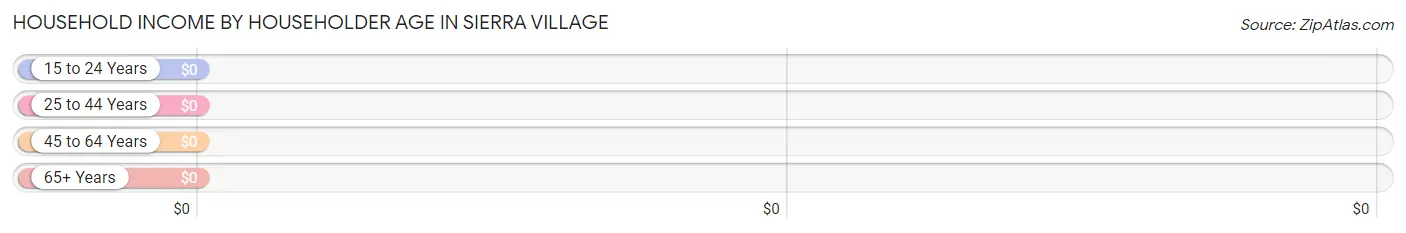
Household Income by Householder Age in Sierra Village
Income Bracket
# Households
Median Income
15 to 24 Years
0 (0.0%)
$0
25 to 44 Years
17 (32.7%)
$0
45 to 64 Years
35 (67.3%)
$0
65+ Years
0 (0.0%)
$0
Total
52 (100.0%)
$0
Poverty in Sierra Village
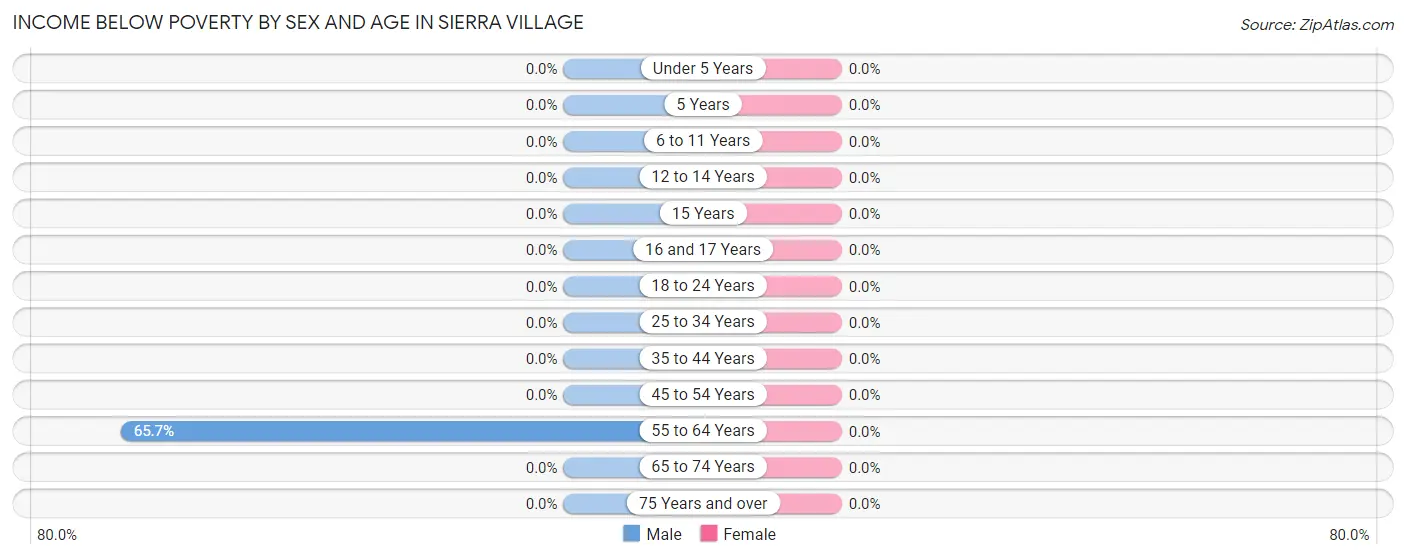
Income Below Poverty by Sex and Age in Sierra Village
Age Bracket
Male
Female
Under 5 Years
0 (0.0%)
0 (0.0%)
5 Years
0 (0.0%)
0 (0.0%)
6 to 11 Years
0 (0.0%)
0 (0.0%)
12 to 14 Years
0 (0.0%)
0 (0.0%)
15 Years
0 (0.0%)
0 (0.0%)
16 and 17 Years
0 (0.0%)
0 (0.0%)
18 to 24 Years
0 (0.0%)
0 (0.0%)
25 to 34 Years
0 (0.0%)
0 (0.0%)
35 to 44 Years
0 (0.0%)
0 (0.0%)
45 to 54 Years
0 (0.0%)
0 (0.0%)
55 to 64 Years
23 (65.7%)
0 (0.0%)
65 to 74 Years
0 (0.0%)
0 (0.0%)
75 Years and over
0 (0.0%)
0 (0.0%)
Total
23 (25.6%)
0 (0.0%)
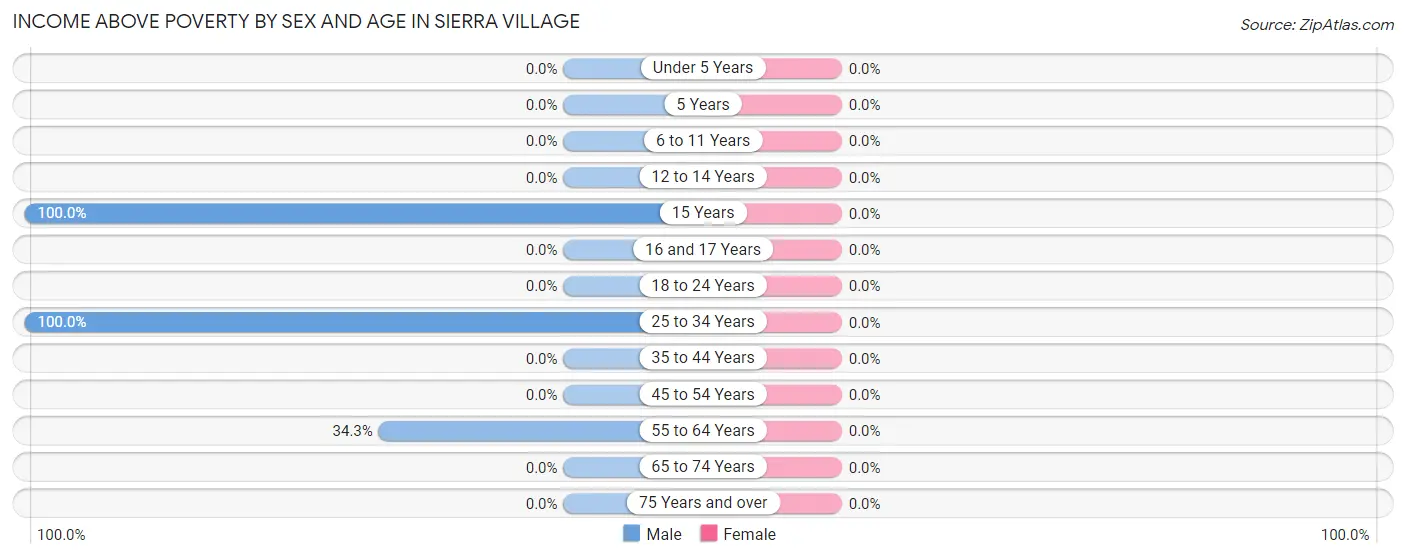
Income Above Poverty by Sex and Age in Sierra Village
Age Bracket
Male
Female
Under 5 Years
0 (0.0%)
0 (0.0%)
5 Years
0 (0.0%)
0 (0.0%)
6 to 11 Years
0 (0.0%)
0 (0.0%)
12 to 14 Years
0 (0.0%)
0 (0.0%)
15 Years
38 (100.0%)
0 (0.0%)
16 and 17 Years
0 (0.0%)
0 (0.0%)
18 to 24 Years
0 (0.0%)
0 (0.0%)
25 to 34 Years
17 (100.0%)
0 (0.0%)
35 to 44 Years
0 (0.0%)
0 (0.0%)
45 to 54 Years
0 (0.0%)
0 (0.0%)
55 to 64 Years
12 (34.3%)
0 (0.0%)
65 to 74 Years
0 (0.0%)
0 (0.0%)
75 Years and over
0 (0.0%)
0 (0.0%)
Total
67 (74.4%)
0 (0.0%)
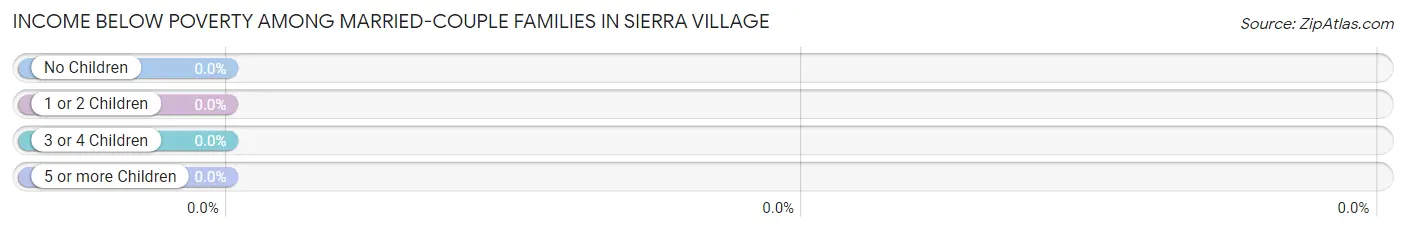
Income Below Poverty Among Married-Couple Families in Sierra Village
Children
Above Poverty
Below Poverty
No Children
0 (0.0%)
0 (0.0%)
1 or 2 Children
0 (0.0%)
0 (0.0%)
3 or 4 Children
0 (0.0%)
0 (0.0%)
5 or more Children
0 (0.0%)
0 (0.0%)
Total
0 (0.0%)
0 (0.0%)
Income Below Poverty Among Single-Parent Households in Sierra Village
Children
Single Father
Single Mother
No Children
0 (0.0%)
0 (0.0%)
1 or 2 Children
0 (0.0%)
0 (0.0%)
3 or 4 Children
0 (0.0%)
0 (0.0%)
5 or more Children
0 (0.0%)
0 (0.0%)
Total
0 (0.0%)
0 (0.0%)
Income Below Poverty Among Married-Couple vs Single-Parent Households in Sierra Village
Children
Married-Couple Families
Single-Parent Households
No Children
0 (0.0%)
0 (0.0%)
1 or 2 Children
0 (0.0%)
0 (0.0%)
3 or 4 Children
0 (0.0%)
0 (0.0%)
5 or more Children
0 (0.0%)
0 (0.0%)
Total
0 (0.0%)
0 (0.0%)
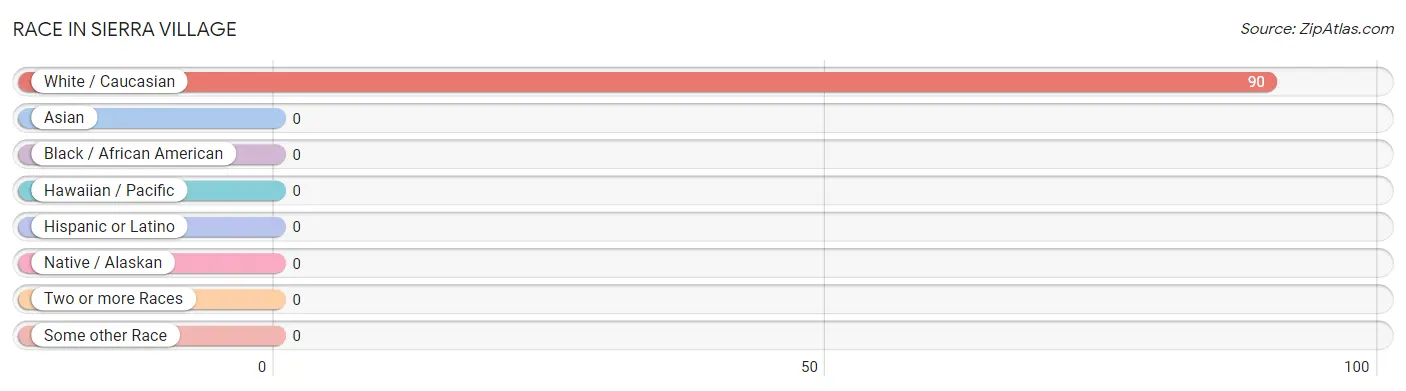
Race in Sierra Village
The most populous races in Sierra Village are , and White / Caucasian (90 | 100.0%).
Race
# Population
% Population
Asian
0
0.0%
Black / African American
0
0.0%
Hawaiian / Pacific
0
0.0%
Hispanic or Latino
0
0.0%
Native / Alaskan
0
0.0%
White / Caucasian
90
100.0%
Two or more Races
0
0.0%
Some other Race
0
0.0%
Total
90
100.0%
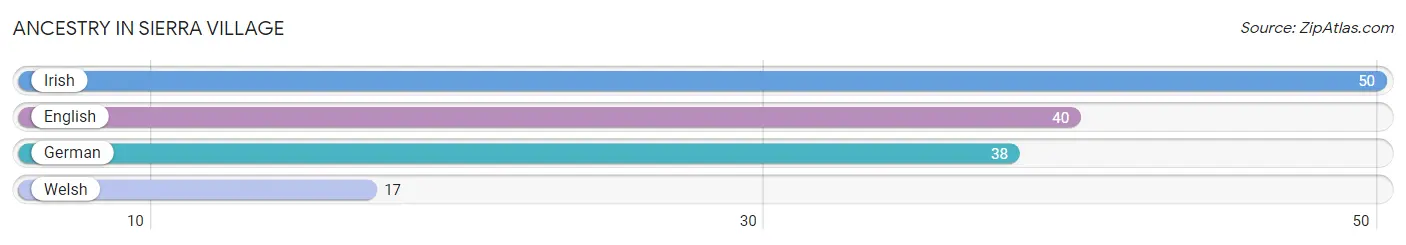
Ancestry in Sierra Village
The most populous ancestries reported in Sierra Village are Irish (50 | 55.6%), English (40 | 44.4%), German (38 | 42.2%), and Welsh (17 | 18.9%), together accounting for 161.1% of all Sierra Village residents.
Ancestry
# Population
% Population
English
40
44.4%
German
38
42.2%
Irish
50
55.6%
Welsh
17
18.9%
View All 4 Rows
Immigrants in Sierra Village
Immigration Origin
# Population
% Population
View All 0 Rows
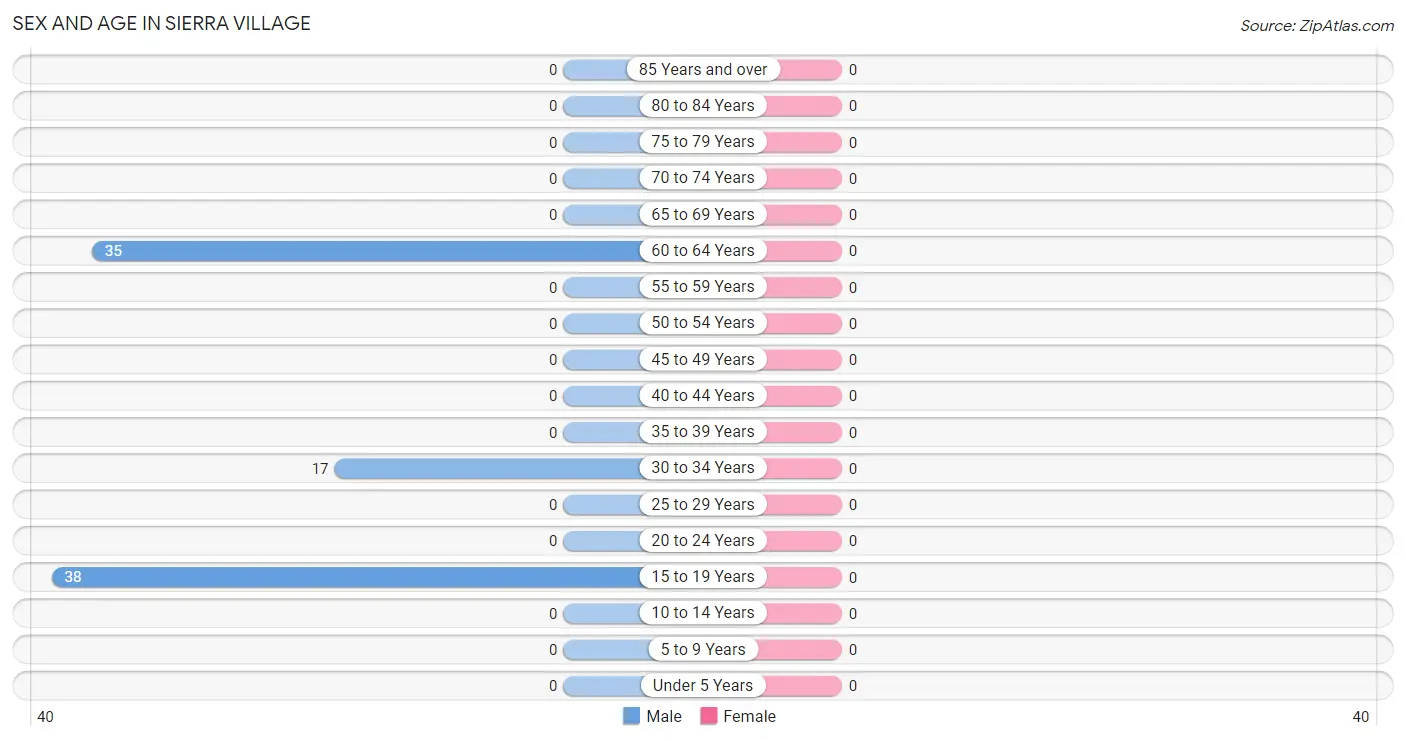
Sex and Age in Sierra Village
Sex and Age in Sierra Village
Age Bracket
Male
Female
Under 5 Years
0 (0.0%)
0 (0.0%)
5 to 9 Years
0 (0.0%)
0 (0.0%)
10 to 14 Years
0 (0.0%)
0 (0.0%)
15 to 19 Years
38 (42.2%)
0 (0.0%)
20 to 24 Years
0 (0.0%)
0 (0.0%)
25 to 29 Years
0 (0.0%)
0 (0.0%)
30 to 34 Years
17 (18.9%)
0 (0.0%)
35 to 39 Years
0 (0.0%)
0 (0.0%)
40 to 44 Years
0 (0.0%)
0 (0.0%)
45 to 49 Years
0 (0.0%)
0 (0.0%)
50 to 54 Years
0 (0.0%)
0 (0.0%)
55 to 59 Years
0 (0.0%)
0 (0.0%)
60 to 64 Years
35 (38.9%)
0 (0.0%)
65 to 69 Years
0 (0.0%)
0 (0.0%)
70 to 74 Years
0 (0.0%)
0 (0.0%)
75 to 79 Years
0 (0.0%)
0 (0.0%)
80 to 84 Years
0 (0.0%)
0 (0.0%)
85 Years and over
0 (0.0%)
0 (0.0%)
Total
90 (100.0%)
0 (0.0%)
Families and Households in Sierra Village
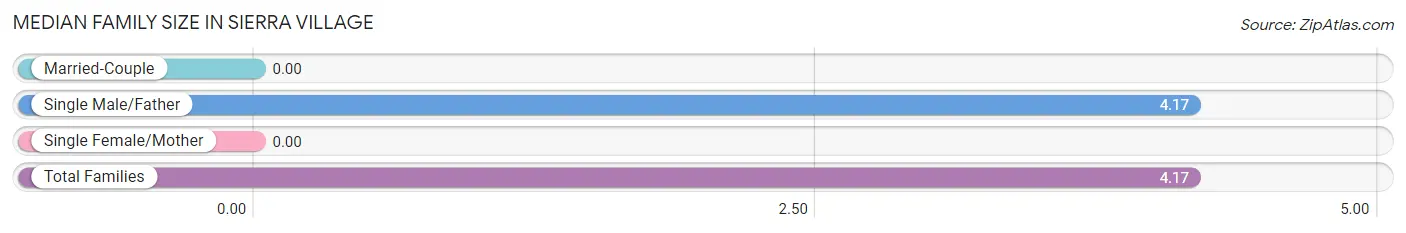
Median Family Size in Sierra Village
Family Type
# Families
Family Size
Married-Couple
0 (0.0%)
-
Single Male/Father
12 (100.0%)
4.17
Single Female/Mother
0 (0.0%)
-
Total Families
12 (100.0%)
4.17
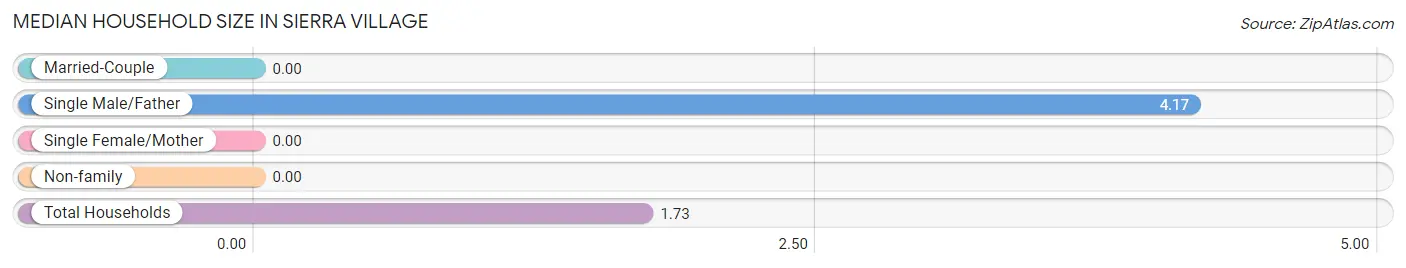
Median Household Size in Sierra Village
Household Type
# Households
Household Size
Married-Couple
0 (0.0%)
-
Single Male/Father
12 (23.1%)
4.17
Single Female/Mother
0 (0.0%)
-
Non-family
40 (76.9%)
-
Total Households
52 (100.0%)
1.73
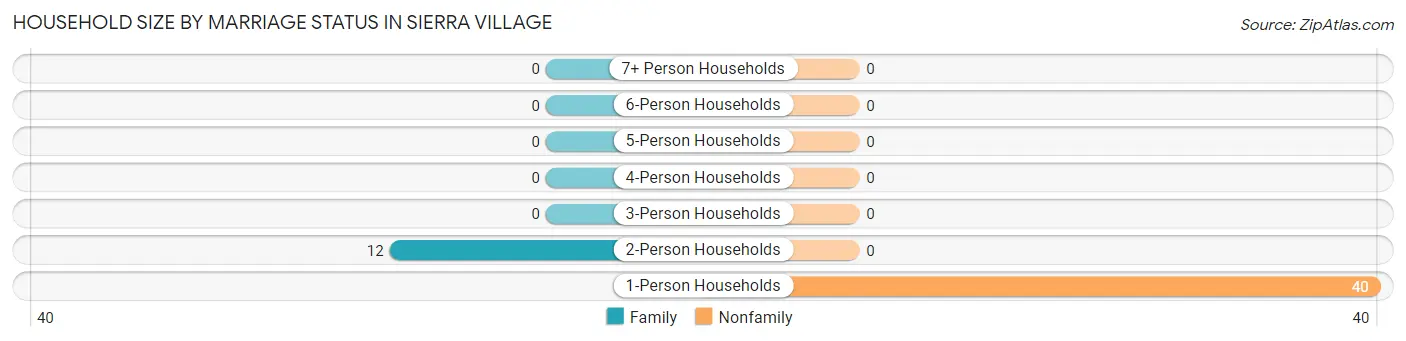
Household Size by Marriage Status in Sierra Village
Out of a total of 52 households in Sierra Village, 12 (23.1%) are family households, while 40 (76.9%) are nonfamily households. The most numerous type of family households are 2-person households, comprising 12, and the most common type of nonfamily households are 1-person households, comprising 40.
Household Size
Family Households
Nonfamily Households
1-Person Households
-
40 (76.9%)
2-Person Households
12 (23.1%)
0 (0.0%)
3-Person Households
0 (0.0%)
0 (0.0%)
4-Person Households
0 (0.0%)
0 (0.0%)
5-Person Households
0 (0.0%)
0 (0.0%)
6-Person Households
0 (0.0%)
0 (0.0%)
7+ Person Households
0 (0.0%)
0 (0.0%)
Total
12 (23.1%)
40 (76.9%)
Female Fertility in Sierra Village
Fertility by Age in Sierra Village
Age Bracket
Women with Births
Births / 1,000 Women
15 to 19 years
0 (0.0%)
0.0
20 to 34 years
0 (0.0%)
0.0
35 to 50 years
0 (0.0%)
0.0
Total
0 (0.0%)
0.0
Fertility by Age by Marriage Status in Sierra Village
Age Bracket
Married
Unmarried
15 to 19 years
0 (0.0%)
0 (0.0%)
20 to 34 years
0 (0.0%)
0 (0.0%)
35 to 50 years
0 (0.0%)
0 (0.0%)
Total
0 (0.0%)
0 (0.0%)
Fertility by Education in Sierra Village
Educational Attainment
Women with Births
Births / 1,000 Women
Less than High School
0 (0.0%)
0.0
High School Diploma
0 (0.0%)
0.0
College or Associate's Degree
0 (0.0%)
0.0
Bachelor's Degree
0 (0.0%)
0.0
Graduate Degree
0 (0.0%)
0.0
Total
0 (0.0%)
0.0
Fertility by Education by Marriage Status in Sierra Village
Educational Attainment
Married
Unmarried
Less than High School
0 (0.0%)
0 (0.0%)
High School Diploma
0 (0.0%)
0 (0.0%)
College or Associate's Degree
0 (0.0%)
0 (0.0%)
Bachelor's Degree
0 (0.0%)
0 (0.0%)
Graduate Degree
0 (0.0%)
0 (0.0%)
Total
0 (0.0%)
0 (0.0%)
Employment Characteristics in Sierra Village
Employment by Class of Employer in Sierra Village
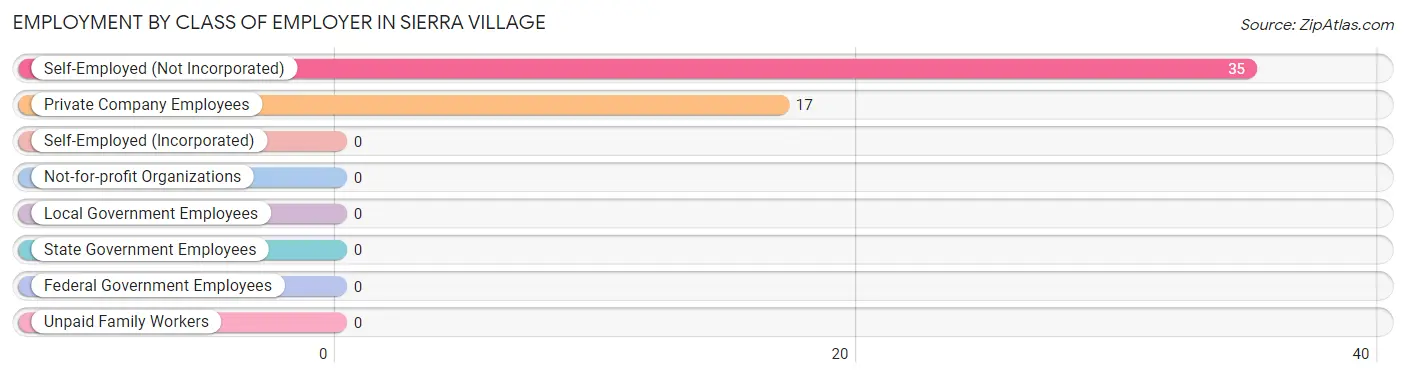
Among the 52 employed individuals in Sierra Village, self-employed (not incorporated) (35 | 67.3%), and private company employees (17 | 32.7%) make up the most common classes of employment.
Employer Class
# Employees
% Employees
Private Company Employees
17
32.7%
Self-Employed (Incorporated)
0
0.0%
Self-Employed (Not Incorporated)
35
67.3%
Not-for-profit Organizations
0
0.0%
Local Government Employees
0
0.0%
State Government Employees
0
0.0%
Federal Government Employees
0
0.0%
Unpaid Family Workers
0
0.0%
Total
52
100.0%
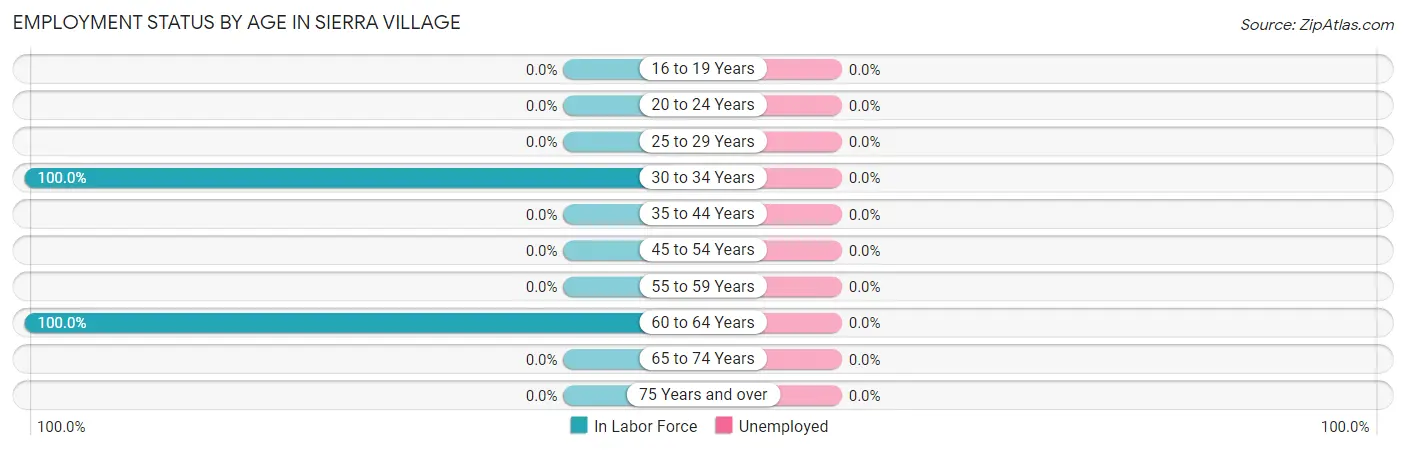
Employment Status by Age in Sierra Village
Age Bracket
In Labor Force
Unemployed
16 to 19 Years
0 (0.0%)
0 (0.0%)
20 to 24 Years
0 (0.0%)
0 (0.0%)
25 to 29 Years
0 (0.0%)
0 (0.0%)
30 to 34 Years
17 (100.0%)
0 (0.0%)
35 to 44 Years
0 (0.0%)
0 (0.0%)
45 to 54 Years
0 (0.0%)
0 (0.0%)
55 to 59 Years
0 (0.0%)
0 (0.0%)
60 to 64 Years
35 (100.0%)
0 (0.0%)
65 to 74 Years
0 (0.0%)
0 (0.0%)
75 Years and over
0 (0.0%)
0 (0.0%)
Total
52 (100.0%)
0 (0.0%)
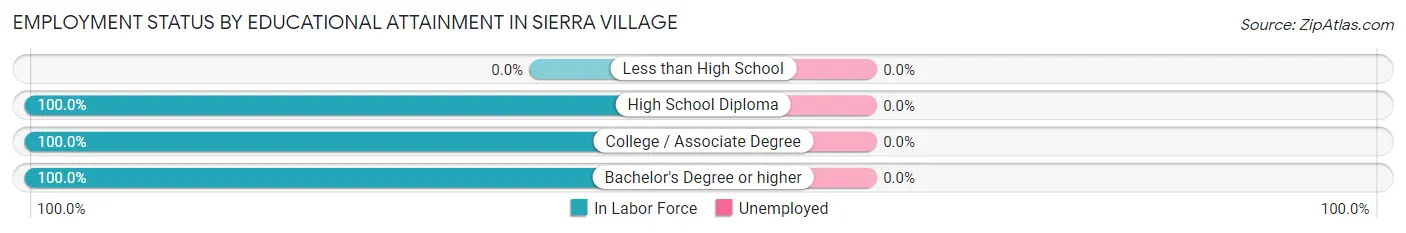
Employment Status by Educational Attainment in Sierra Village
Educational Attainment
In Labor Force
Unemployed
Less than High School
0 (0.0%)
0 (0.0%)
High School Diploma
17 (100.0%)
0 (0.0%)
College / Associate Degree
23 (100.0%)
0 (0.0%)
Bachelor's Degree or higher
12 (100.0%)
0 (0.0%)
Total
52 (100.0%)
0 (0.0%)
Employment Occupations by Sex in Sierra Village
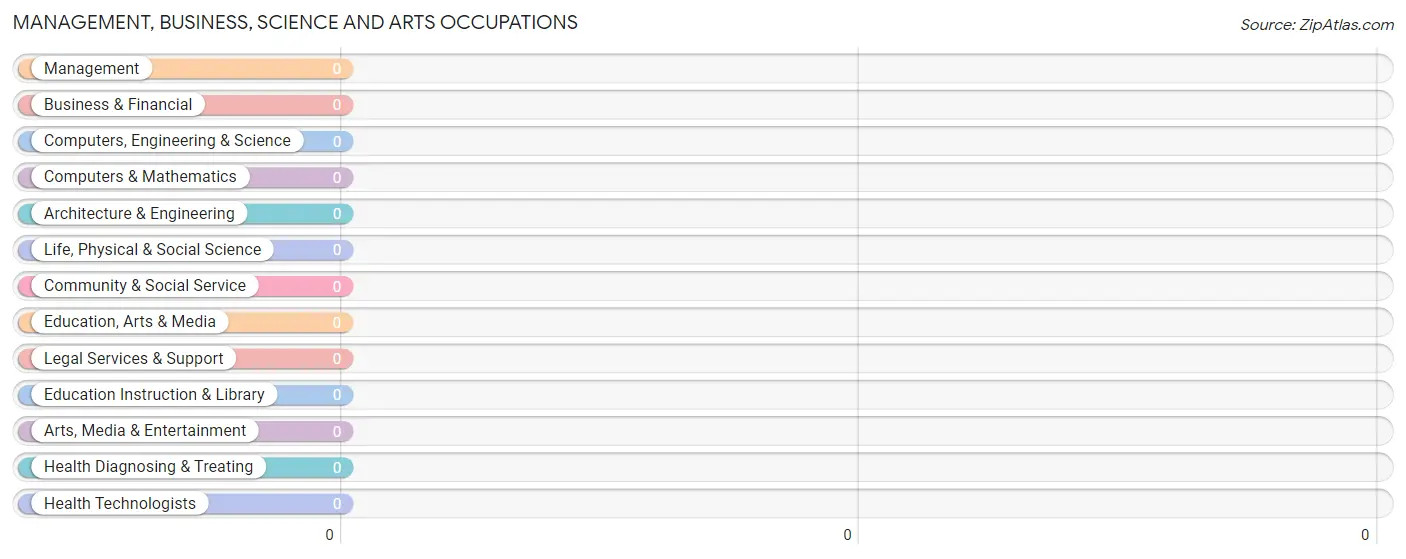
Management, Business, Science and Arts Occupations
Management, Business, Science and Arts Occupations by Sex
Occupation
Male
Female
Management
0 (0.0%)
0 (0.0%)
Business & Financial
0 (0.0%)
0 (0.0%)
Computers, Engineering & Science
0 (0.0%)
0 (0.0%)
Computers & Mathematics
0 (0.0%)
0 (0.0%)
Architecture & Engineering
0 (0.0%)
0 (0.0%)
Life, Physical & Social Science
0 (0.0%)
0 (0.0%)
Community & Social Service
0 (0.0%)
0 (0.0%)
Education, Arts & Media
0 (0.0%)
0 (0.0%)
Legal Services & Support
0 (0.0%)
0 (0.0%)
Education Instruction & Library
0 (0.0%)
0 (0.0%)
Arts, Media & Entertainment
0 (0.0%)
0 (0.0%)
Health Diagnosing & Treating
0 (0.0%)
0 (0.0%)
Health Technologists
0 (0.0%)
0 (0.0%)
Total (Category)
0 (0.0%)
0 (0.0%)
Total (Overall)
52 (100.0%)
0 (0.0%)
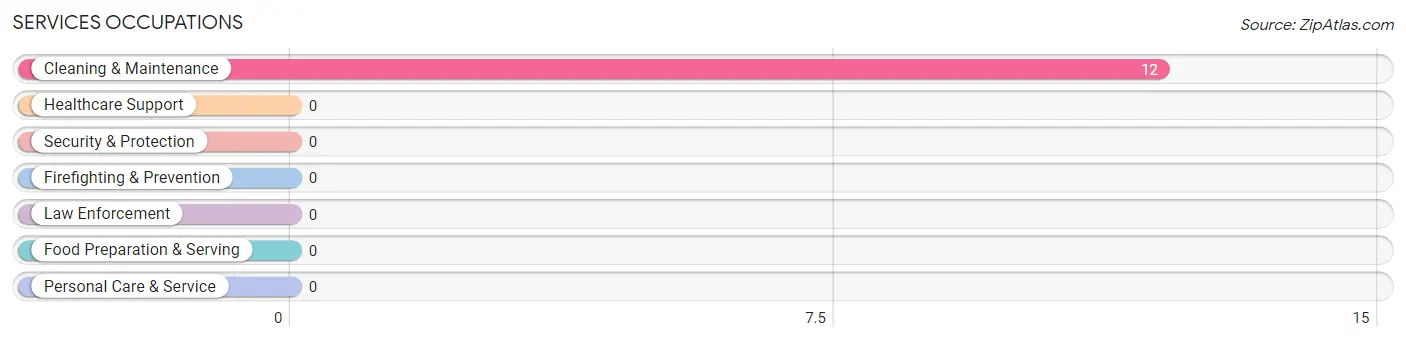
Services Occupations
The most common Services occupations in Sierra Village are , and Cleaning & Maintenance (12 | 23.1%).
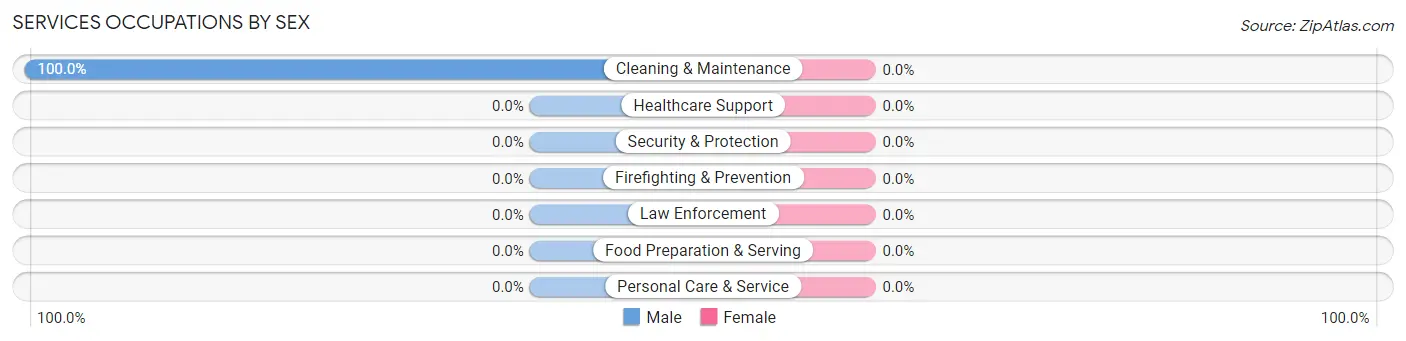
Services Occupations by Sex
Occupation
Male
Female
Healthcare Support
0 (0.0%)
0 (0.0%)
Security & Protection
0 (0.0%)
0 (0.0%)
Firefighting & Prevention
0 (0.0%)
0 (0.0%)
Law Enforcement
0 (0.0%)
0 (0.0%)
Food Preparation & Serving
0 (0.0%)
0 (0.0%)
Cleaning & Maintenance
12 (100.0%)
0 (0.0%)
Personal Care & Service
0 (0.0%)
0 (0.0%)
Total (Category)
12 (100.0%)
0 (0.0%)
Total (Overall)
52 (100.0%)
0 (0.0%)
Sales and Office Occupations
Sales and Office Occupations by Sex
Occupation
Male
Female
Sales & Related
0 (0.0%)
0 (0.0%)
Office & Administration
0 (0.0%)
0 (0.0%)
Total (Category)
0 (0.0%)
0 (0.0%)
Total (Overall)
52 (100.0%)
0 (0.0%)
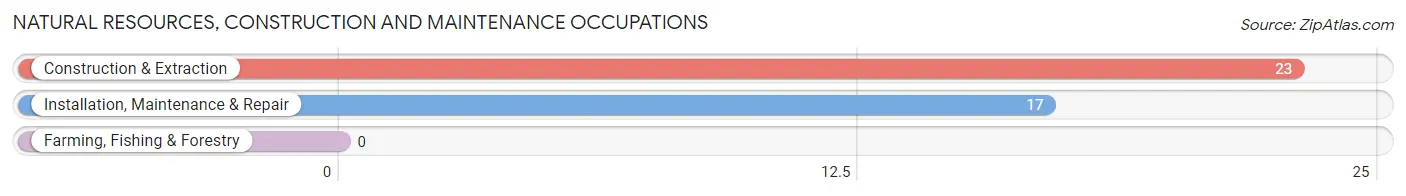
Natural Resources, Construction and Maintenance Occupations
The most common Natural Resources, Construction and Maintenance occupations in Sierra Village are Construction & Extraction (23 | 44.2%), and Installation, Maintenance & Repair (17 | 32.7%).
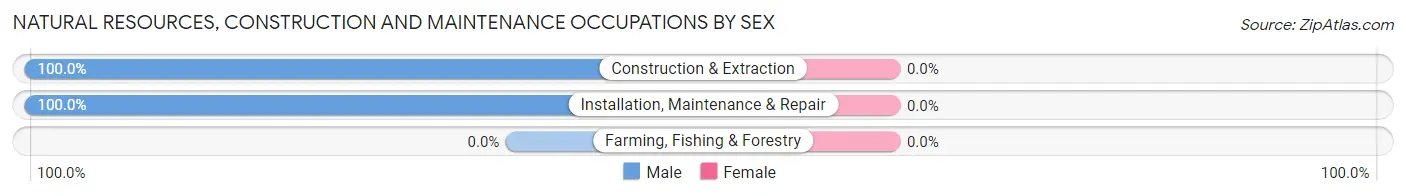
Natural Resources, Construction and Maintenance Occupations by Sex
Occupation
Male
Female
Farming, Fishing & Forestry
0 (0.0%)
0 (0.0%)
Construction & Extraction
23 (100.0%)
0 (0.0%)
Installation, Maintenance & Repair
17 (100.0%)
0 (0.0%)
Total (Category)
40 (100.0%)
0 (0.0%)
Total (Overall)
52 (100.0%)
0 (0.0%)
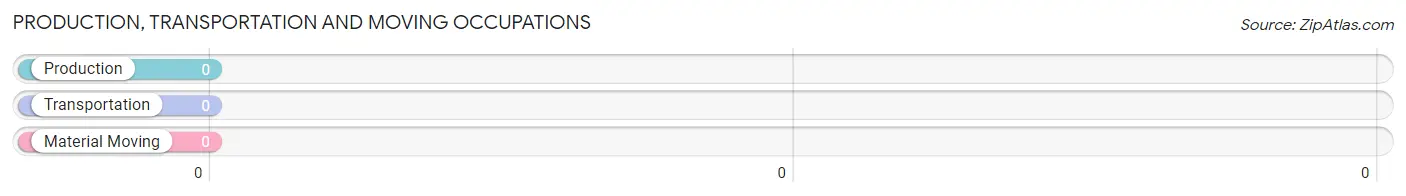
Production, Transportation and Moving Occupations
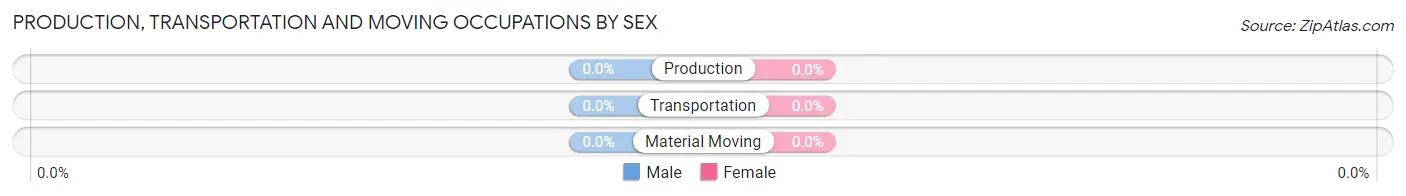
Production, Transportation and Moving Occupations by Sex
Occupation
Male
Female
Production
0 (0.0%)
0 (0.0%)
Transportation
0 (0.0%)
0 (0.0%)
Material Moving
0 (0.0%)
0 (0.0%)
Total (Category)
0 (0.0%)
0 (0.0%)
Total (Overall)
52 (100.0%)
0 (0.0%)
Employment Industries by Sex in Sierra Village
Employment Industries in Sierra Village
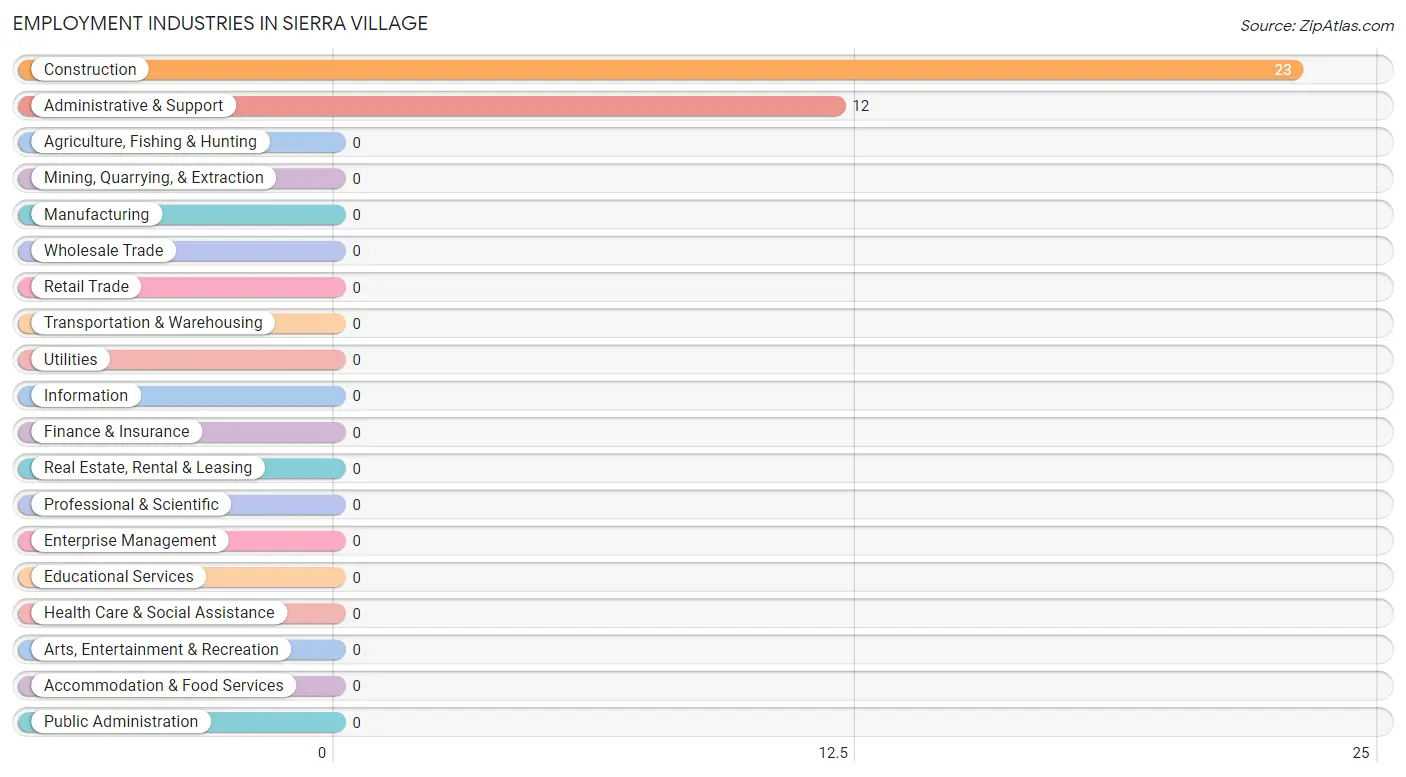
The major employment industries in Sierra Village include Construction (23 | 44.2%), and Administrative & Support (12 | 23.1%).
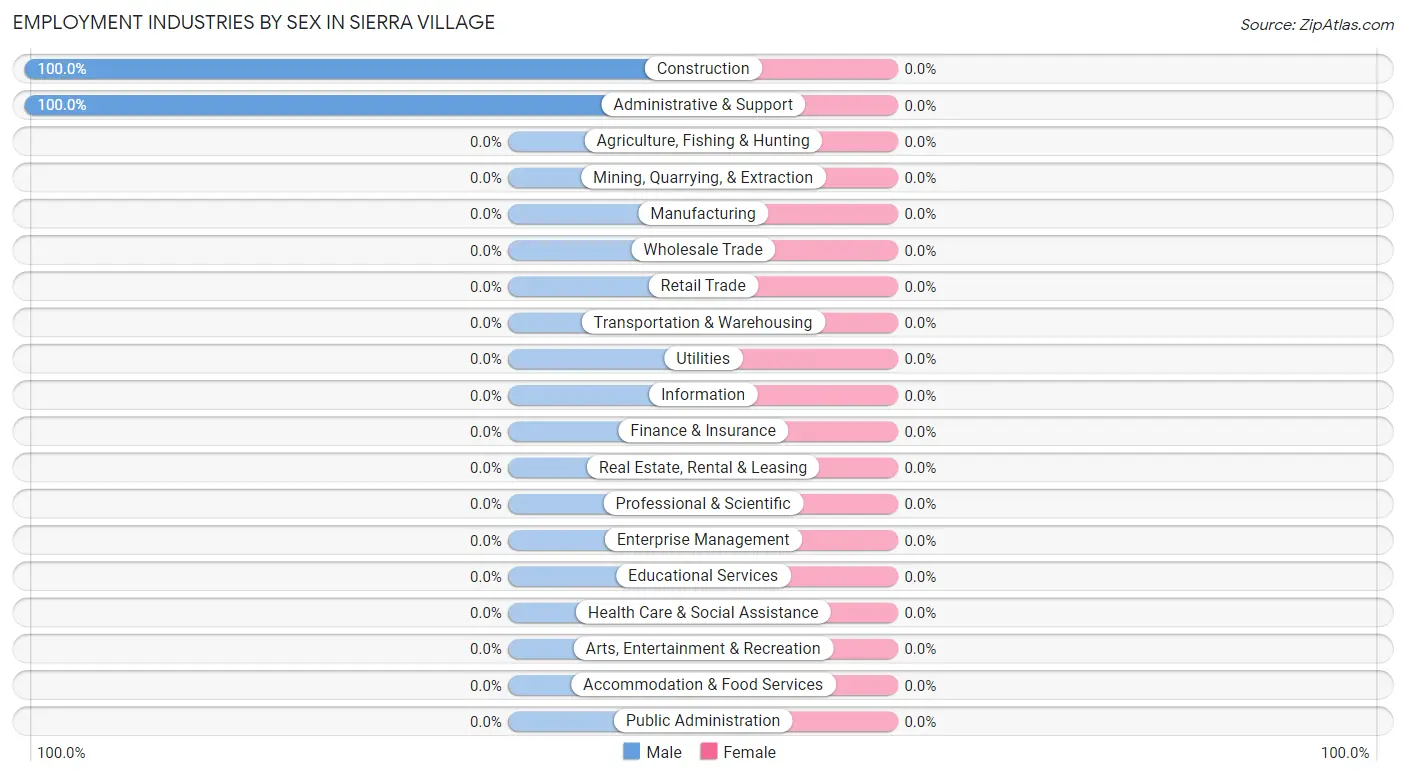
Employment Industries by Sex in Sierra Village
Industry
Male
Female
Agriculture, Fishing & Hunting
0 (0.0%)
0 (0.0%)
Mining, Quarrying, & Extraction
0 (0.0%)
0 (0.0%)
Construction
23 (100.0%)
0 (0.0%)
Manufacturing
0 (0.0%)
0 (0.0%)
Wholesale Trade
0 (0.0%)
0 (0.0%)
Retail Trade
0 (0.0%)
0 (0.0%)
Transportation & Warehousing
0 (0.0%)
0 (0.0%)
Utilities
0 (0.0%)
0 (0.0%)
Information
0 (0.0%)
0 (0.0%)
Finance & Insurance
0 (0.0%)
0 (0.0%)
Real Estate, Rental & Leasing
0 (0.0%)
0 (0.0%)
Professional & Scientific
0 (0.0%)
0 (0.0%)
Enterprise Management
0 (0.0%)
0 (0.0%)
Administrative & Support
12 (100.0%)
0 (0.0%)
Educational Services
0 (0.0%)
0 (0.0%)
Health Care & Social Assistance
0 (0.0%)
0 (0.0%)
Arts, Entertainment & Recreation
0 (0.0%)
0 (0.0%)
Accommodation & Food Services
0 (0.0%)
0 (0.0%)
Public Administration
0 (0.0%)
0 (0.0%)
Total
52 (100.0%)
0 (0.0%)
Education in Sierra Village
School Enrollment in Sierra Village
School Level
# Students
% Students
Nursery / Preschool
0
0.0%
Kindergarten
0
0.0%
Elementary School
0
0.0%
Middle School
0
0.0%
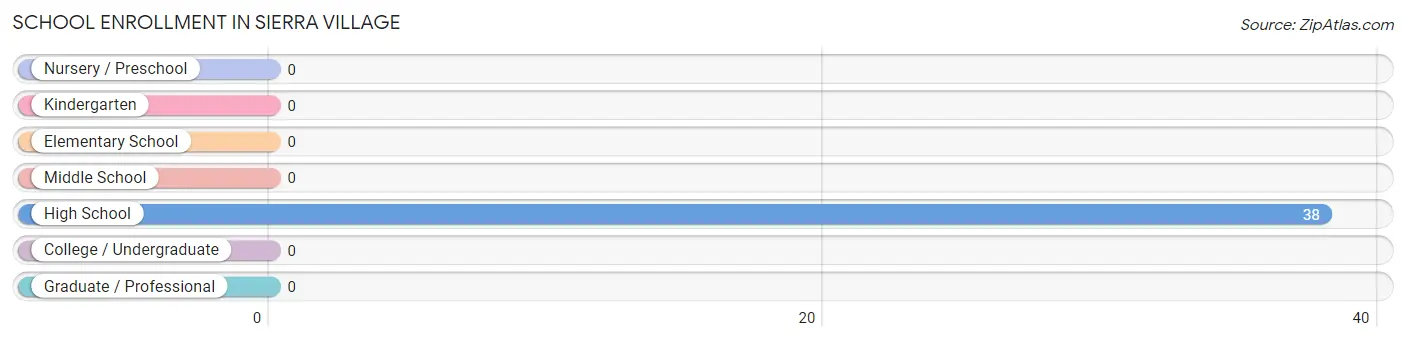
High School
38
100.0%
College / Undergraduate
0
0.0%
Graduate / Professional
0
0.0%
Total
38
100.0%
School Enrollment by Age by Funding Source in Sierra Village
Age Bracket
Public School
Private School
3 to 4 Year Olds
0 (0.0%)
0 (0.0%)
5 to 9 Year Old
0 (0.0%)
0 (0.0%)
10 to 14 Year Olds
0 (0.0%)
0 (0.0%)
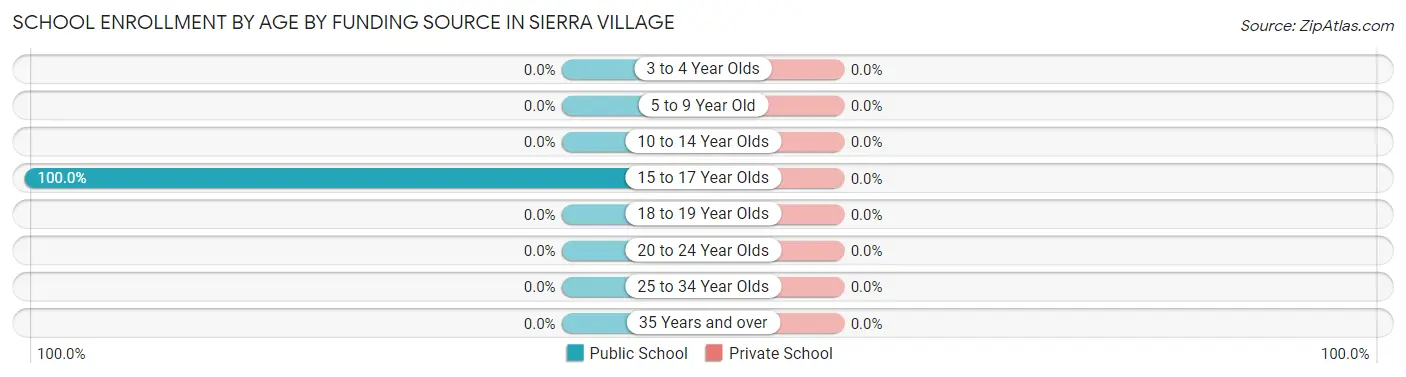
15 to 17 Year Olds
38 (100.0%)
0 (0.0%)
18 to 19 Year Olds
0 (0.0%)
0 (0.0%)
20 to 24 Year Olds
0 (0.0%)
0 (0.0%)
25 to 34 Year Olds
0 (0.0%)
0 (0.0%)
35 Years and over
0 (0.0%)
0 (0.0%)
Total
38 (100.0%)
0 (0.0%)
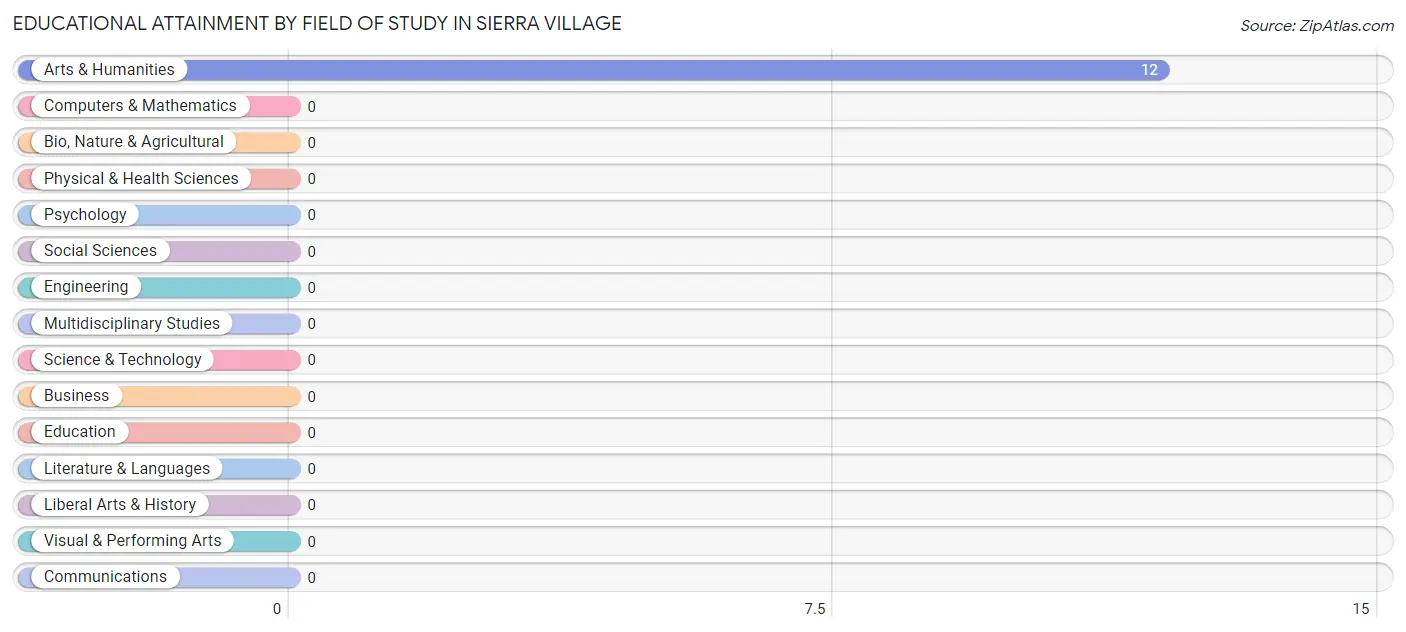
Educational Attainment by Field of Study in Sierra Village
, and arts & humanities (12 | 100.0%) are the most common fields of study among 12 individuals in Sierra Village who have obtained a bachelor's degree or higher.
Field of Study
# Graduates
% Graduates
Computers & Mathematics
0
0.0%
Bio, Nature & Agricultural
0
0.0%
Physical & Health Sciences
0
0.0%
Psychology
0
0.0%
Social Sciences
0
0.0%
Engineering
0
0.0%
Multidisciplinary Studies
0
0.0%
Science & Technology
0
0.0%
Business
0
0.0%
Education
0
0.0%
Literature & Languages
0
0.0%
Liberal Arts & History
0
0.0%
Visual & Performing Arts
0
0.0%
Communications
0
0.0%
Arts & Humanities
12
100.0%
Total
12
100.0%
Transportation & Commute in Sierra Village
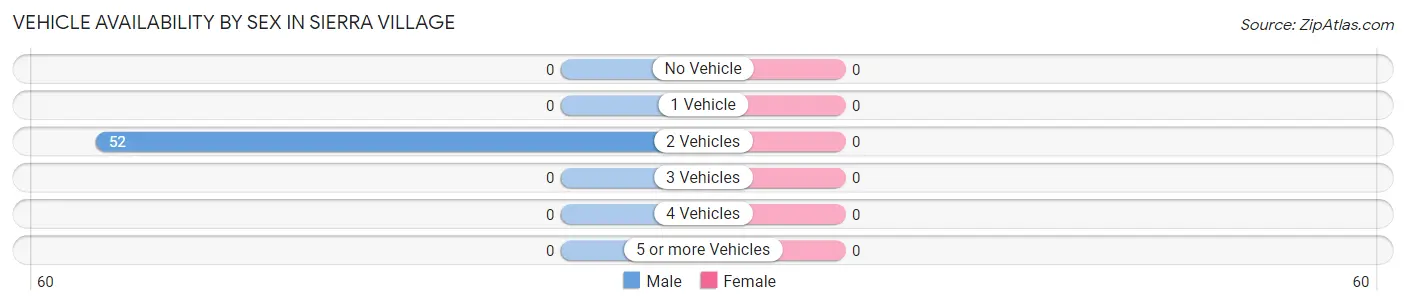
Vehicle Availability by Sex in Sierra Village
Vehicles Available
Male
Female
No Vehicle
0 (0.0%)
0 (0.0%)
1 Vehicle
0 (0.0%)
0 (0.0%)
2 Vehicles
52 (100.0%)
0 (0.0%)
3 Vehicles
0 (0.0%)
0 (0.0%)
4 Vehicles
0 (0.0%)
0 (0.0%)
5 or more Vehicles
0 (0.0%)
0 (0.0%)
Total
52 (100.0%)
0 (0.0%)
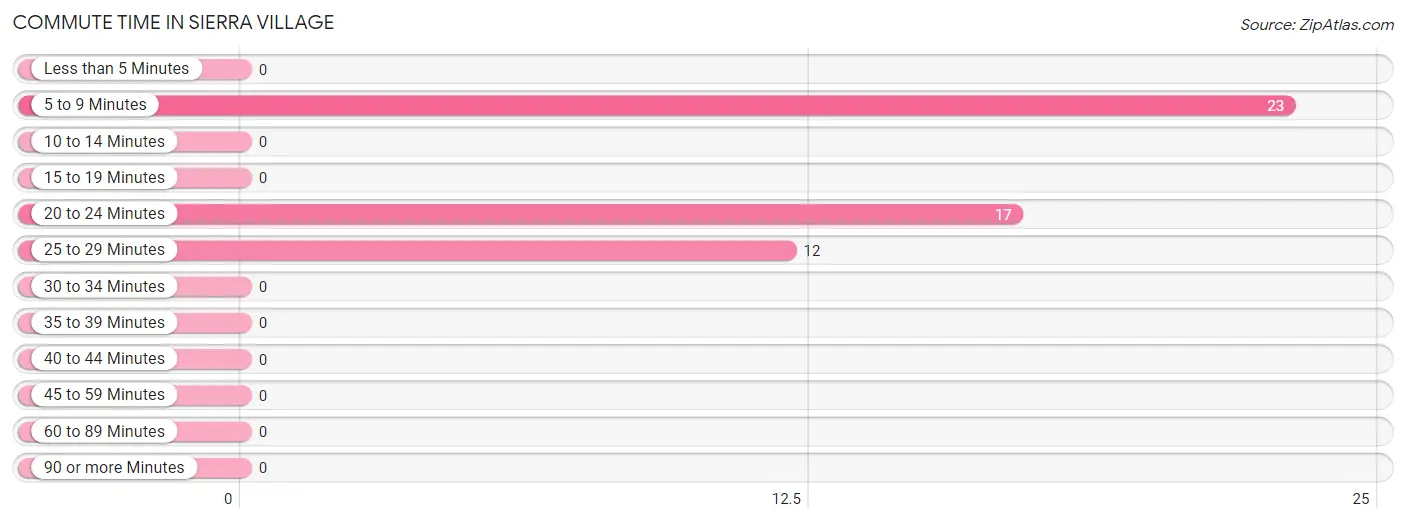
Commute Time in Sierra Village
The most frequently occuring commute durations in Sierra Village are 5 to 9 minutes (23 commuters, 44.2%), 20 to 24 minutes (17 commuters, 32.7%), and 25 to 29 minutes (12 commuters, 23.1%).
Commute Time
# Commuters
% Commuters
Less than 5 Minutes
0
0.0%
5 to 9 Minutes
23
44.2%
10 to 14 Minutes
0
0.0%
15 to 19 Minutes
0
0.0%
20 to 24 Minutes
17
32.7%
25 to 29 Minutes
12
23.1%
30 to 34 Minutes
0
0.0%
35 to 39 Minutes
0
0.0%
40 to 44 Minutes
0
0.0%
45 to 59 Minutes
0
0.0%
60 to 89 Minutes
0
0.0%
90 or more Minutes
0
0.0%
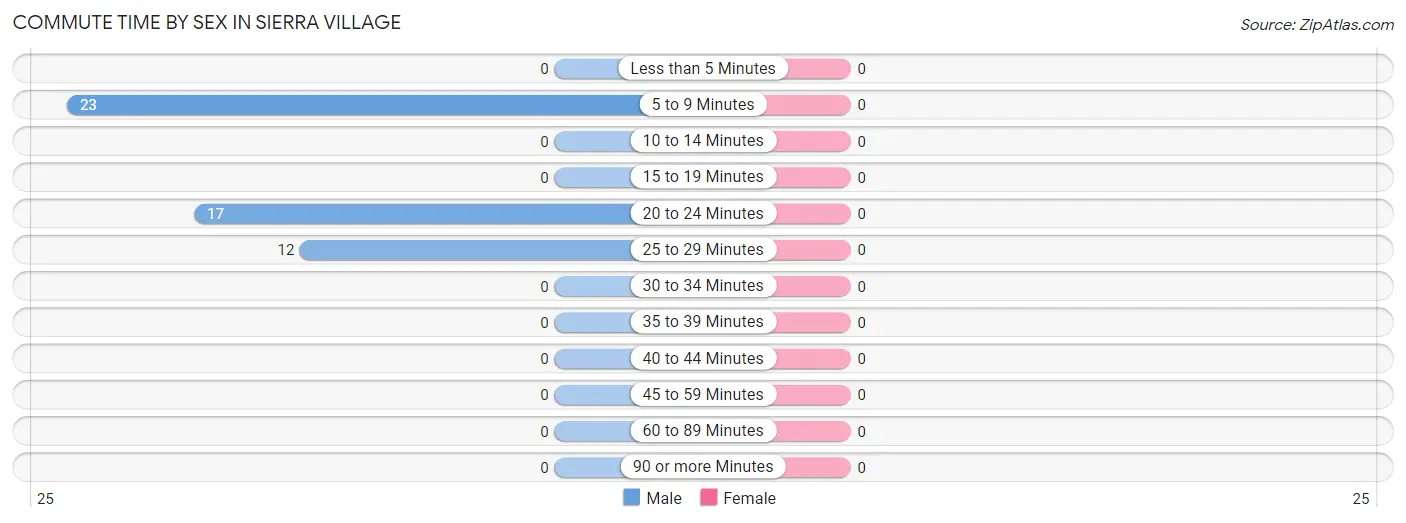
Commute Time by Sex in Sierra Village
Commute Time
Male
Female
Less than 5 Minutes
0 (0.0%)
0 (0.0%)
5 to 9 Minutes
23 (44.2%)
0 (0.0%)
10 to 14 Minutes
0 (0.0%)
0 (0.0%)
15 to 19 Minutes
0 (0.0%)
0 (0.0%)
20 to 24 Minutes
17 (32.7%)
0 (0.0%)
25 to 29 Minutes
12 (23.1%)
0 (0.0%)
30 to 34 Minutes
0 (0.0%)
0 (0.0%)
35 to 39 Minutes
0 (0.0%)
0 (0.0%)
40 to 44 Minutes
0 (0.0%)
0 (0.0%)
45 to 59 Minutes
0 (0.0%)
0 (0.0%)
60 to 89 Minutes
0 (0.0%)
0 (0.0%)
90 or more Minutes
0 (0.0%)
0 (0.0%)
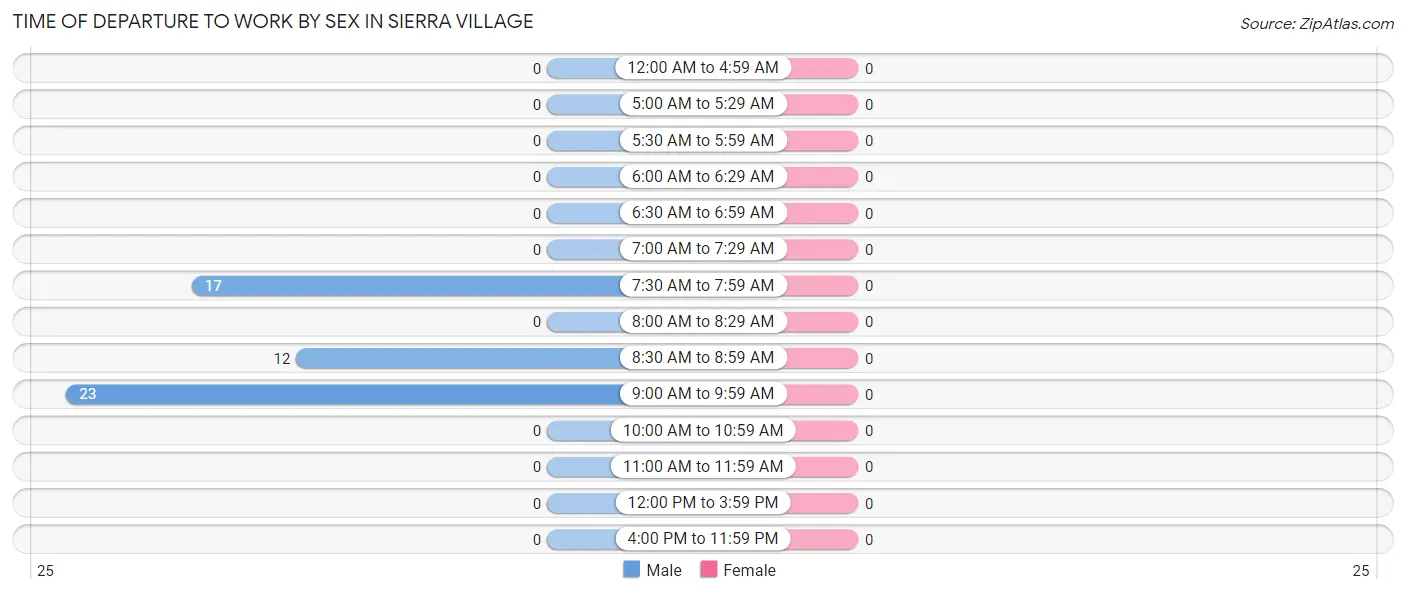
Time of Departure to Work by Sex in Sierra Village
Time of Departure
Male
Female
12:00 AM to 4:59 AM
0 (0.0%)
0 (0.0%)
5:00 AM to 5:29 AM
0 (0.0%)
0 (0.0%)
5:30 AM to 5:59 AM
0 (0.0%)
0 (0.0%)
6:00 AM to 6:29 AM
0 (0.0%)
0 (0.0%)
6:30 AM to 6:59 AM
0 (0.0%)
0 (0.0%)
7:00 AM to 7:29 AM
0 (0.0%)
0 (0.0%)
7:30 AM to 7:59 AM
17 (32.7%)
0 (0.0%)
8:00 AM to 8:29 AM
0 (0.0%)
0 (0.0%)
8:30 AM to 8:59 AM
12 (23.1%)
0 (0.0%)
9:00 AM to 9:59 AM
23 (44.2%)
0 (0.0%)
10:00 AM to 10:59 AM
0 (0.0%)
0 (0.0%)
11:00 AM to 11:59 AM
0 (0.0%)
0 (0.0%)
12:00 PM to 3:59 PM
0 (0.0%)
0 (0.0%)
4:00 PM to 11:59 PM
0 (0.0%)
0 (0.0%)
Total
52 (100.0%)
0 (0.0%)
Housing Occupancy in Sierra Village
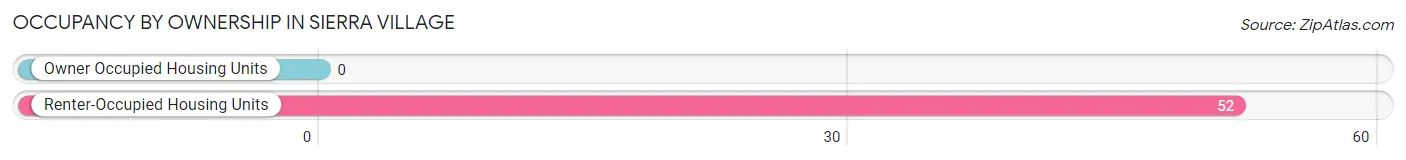
Occupancy by Ownership in Sierra Village
Of the total 52 dwellings in Sierra Village, owner-occupied units account for 0 (0.0%), while renter-occupied units make up 52 (100.0%).
Occupancy
# Housing Units
% Housing Units
Owner Occupied Housing Units
0
0.0%
Renter-Occupied Housing Units
52
100.0%
Total Occupied Housing Units
52
100.0%
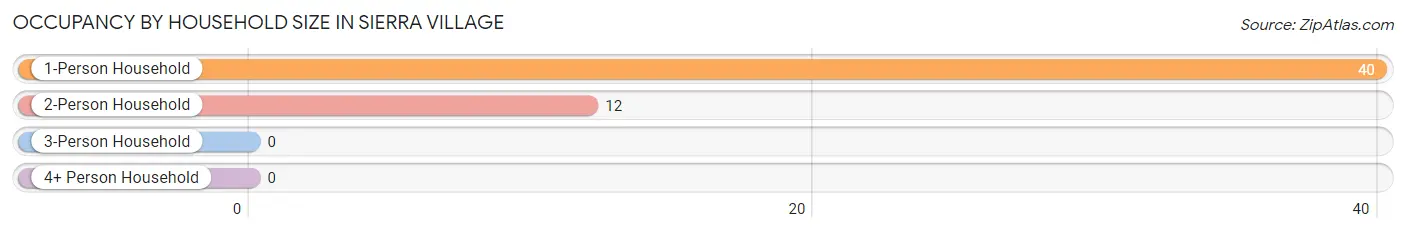
Occupancy by Household Size in Sierra Village
Household Size
# Housing Units
% Housing Units
1-Person Household
40
76.9%
2-Person Household
12
23.1%
3-Person Household
0
0.0%
4+ Person Household
0
0.0%
Total Housing Units
52
100.0%
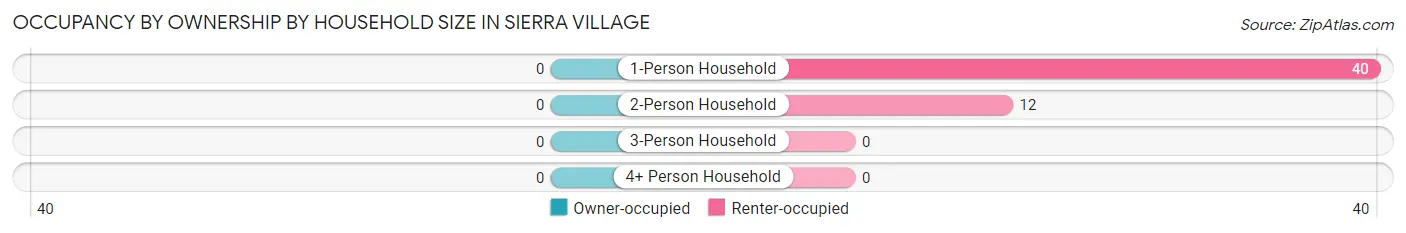
Occupancy by Ownership by Household Size in Sierra Village
Household Size
Owner-occupied
Renter-occupied
1-Person Household
0 (0.0%)
40 (100.0%)
2-Person Household
0 (0.0%)
12 (100.0%)
3-Person Household
0 (0.0%)
0 (0.0%)
4+ Person Household
0 (0.0%)
0 (0.0%)
Total Housing Units
0 (0.0%)
52 (100.0%)
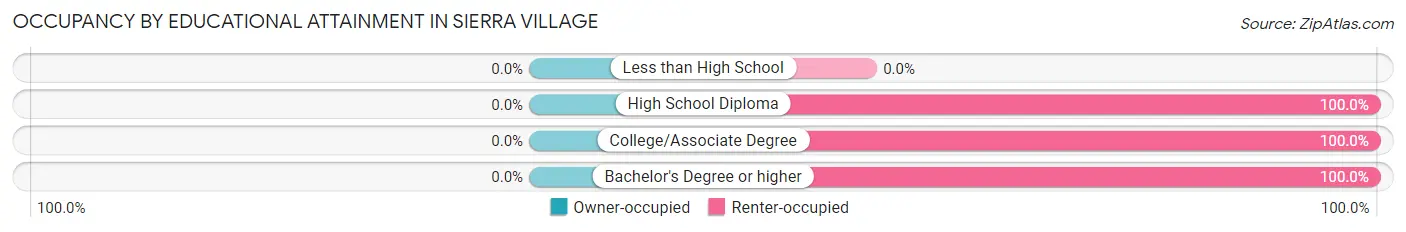
Occupancy by Educational Attainment in Sierra Village
Household Size
Owner-occupied
Renter-occupied
Less than High School
0 (0.0%)
0 (0.0%)
High School Diploma
0 (0.0%)
17 (100.0%)
College/Associate Degree
0 (0.0%)
23 (100.0%)
Bachelor's Degree or higher
0 (0.0%)
12 (100.0%)
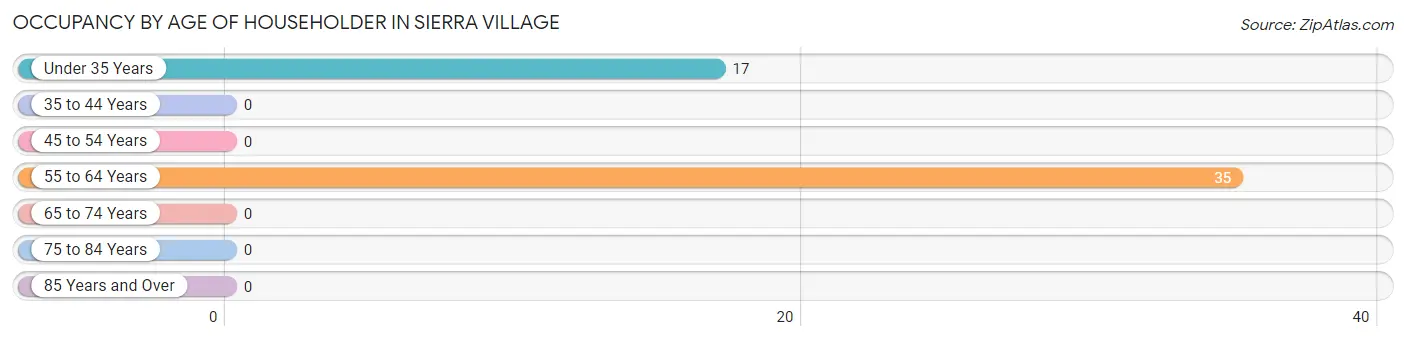
Occupancy by Age of Householder in Sierra Village
Age Bracket
# Households
% Households
Under 35 Years
17
32.7%
35 to 44 Years
0
0.0%
45 to 54 Years
0
0.0%
55 to 64 Years
35
67.3%
65 to 74 Years
0
0.0%
75 to 84 Years
0
0.0%
85 Years and Over
0
0.0%
Total
52
100.0%
Housing Finances in Sierra Village
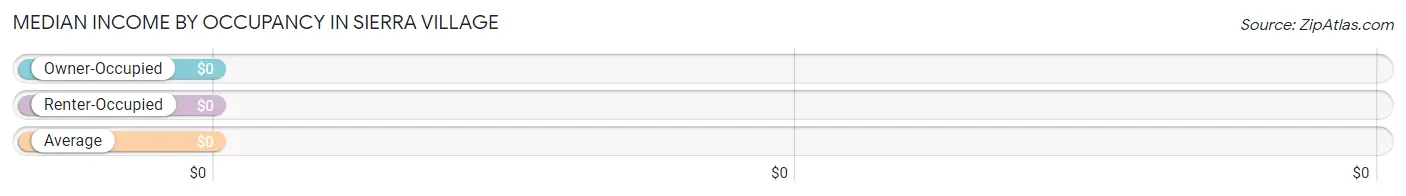
Median Income by Occupancy in Sierra Village
Occupancy Type
# Households
Median Income
Owner-Occupied
0 (0.0%)
$0
Renter-Occupied
52 (100.0%)
$0
Average
52 (100.0%)
$0
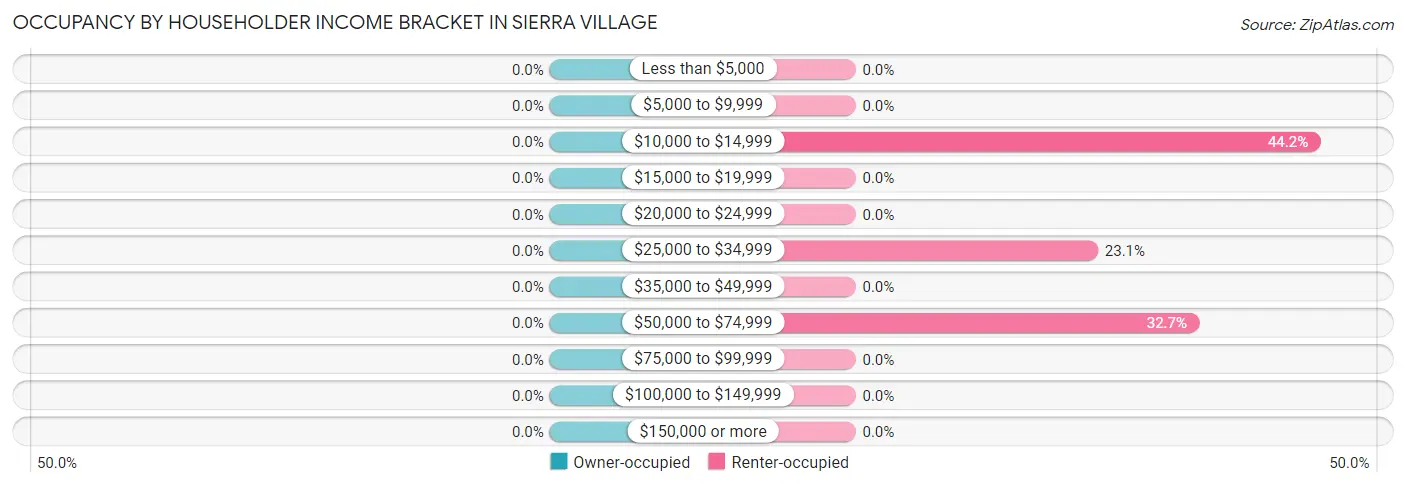
Occupancy by Householder Income Bracket in Sierra Village
Income Bracket
Owner-occupied
Renter-occupied
Less than $5,000
0 (0.0%)
0 (0.0%)
$5,000 to $9,999
0 (0.0%)
0 (0.0%)
$10,000 to $14,999
0 (0.0%)
23 (44.2%)
$15,000 to $19,999
0 (0.0%)
0 (0.0%)
$20,000 to $24,999
0 (0.0%)
0 (0.0%)
$25,000 to $34,999
0 (0.0%)
12 (23.1%)
$35,000 to $49,999
0 (0.0%)
0 (0.0%)
$50,000 to $74,999
0 (0.0%)
17 (32.7%)
$75,000 to $99,999
0 (0.0%)
0 (0.0%)
$100,000 to $149,999
0 (0.0%)
0 (0.0%)
$150,000 or more
0 (0.0%)
0 (0.0%)
Total
0 (0.0%)
52 (100.0%)
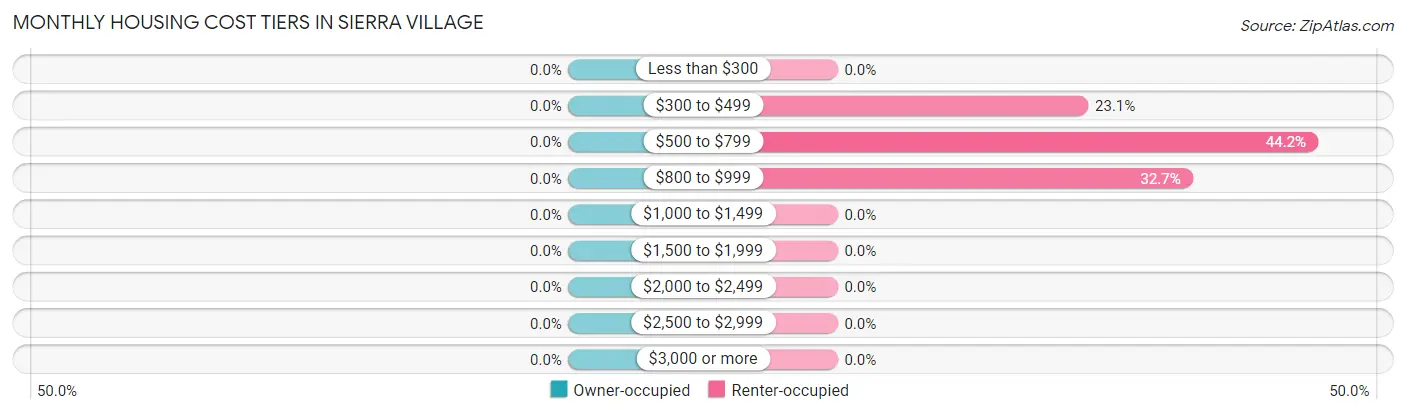
Monthly Housing Cost Tiers in Sierra Village
Monthly Cost
Owner-occupied
Renter-occupied
Less than $300
0 (0.0%)
0 (0.0%)
$300 to $499
0 (0.0%)
12 (23.1%)
$500 to $799
0 (0.0%)
23 (44.2%)
$800 to $999
0 (0.0%)
17 (32.7%)
$1,000 to $1,499
0 (0.0%)
0 (0.0%)
$1,500 to $1,999
0 (0.0%)
0 (0.0%)
$2,000 to $2,499
0 (0.0%)
0 (0.0%)
$2,500 to $2,999
0 (0.0%)
0 (0.0%)
$3,000 or more
0 (0.0%)
0 (0.0%)
Total
0 (0.0%)
52 (100.0%)
Physical Housing Characteristics in Sierra Village
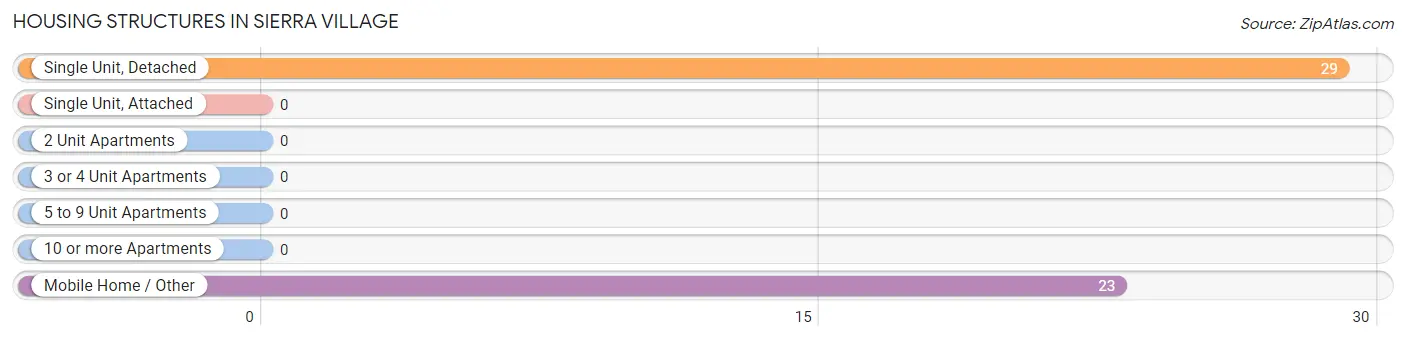
Housing Structures in Sierra Village
Structure Type
# Housing Units
% Housing Units
Single Unit, Detached
29
55.8%
Single Unit, Attached
0
0.0%
2 Unit Apartments
0
0.0%
3 or 4 Unit Apartments
0
0.0%
5 to 9 Unit Apartments
0
0.0%
10 or more Apartments
0
0.0%
Mobile Home / Other
23
44.2%
Total
52
100.0%
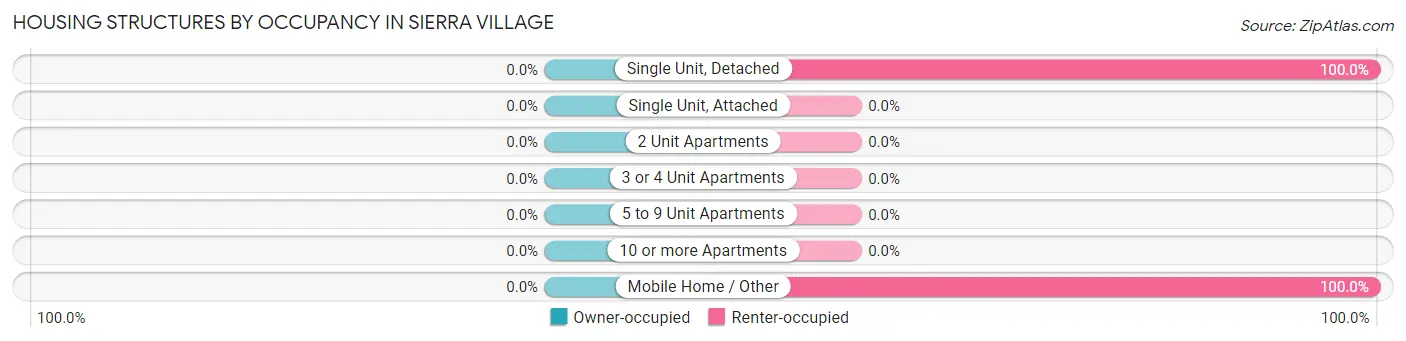
Housing Structures by Occupancy in Sierra Village
Structure Type
Owner-occupied
Renter-occupied
Single Unit, Detached
0 (0.0%)
29 (100.0%)
Single Unit, Attached
0 (0.0%)
0 (0.0%)
2 Unit Apartments
0 (0.0%)
0 (0.0%)
3 or 4 Unit Apartments
0 (0.0%)
0 (0.0%)
5 to 9 Unit Apartments
0 (0.0%)
0 (0.0%)
10 or more Apartments
0 (0.0%)
0 (0.0%)
Mobile Home / Other
0 (0.0%)
23 (100.0%)
Total
0 (0.0%)
52 (100.0%)
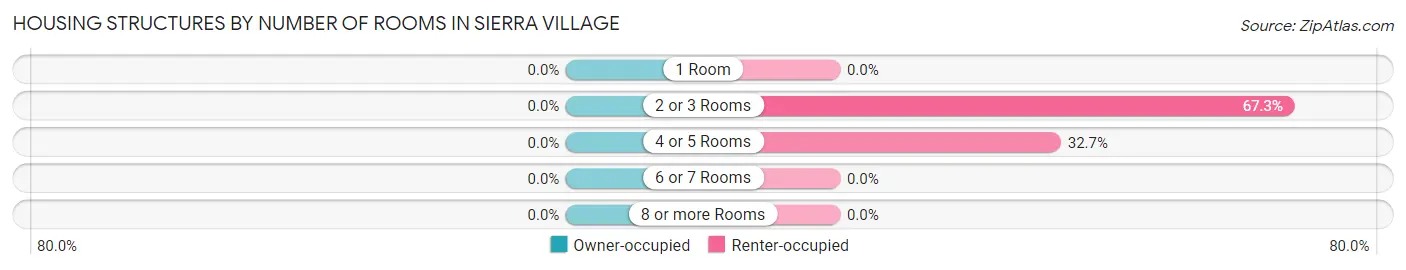
Housing Structures by Number of Rooms in Sierra Village
Number of Rooms
Owner-occupied
Renter-occupied
1 Room
0 (0.0%)
0 (0.0%)
2 or 3 Rooms
0 (0.0%)
35 (67.3%)
4 or 5 Rooms
0 (0.0%)
17 (32.7%)
6 or 7 Rooms
0 (0.0%)
0 (0.0%)
8 or more Rooms
0 (0.0%)
0 (0.0%)
Total
0 (0.0%)
52 (100.0%)
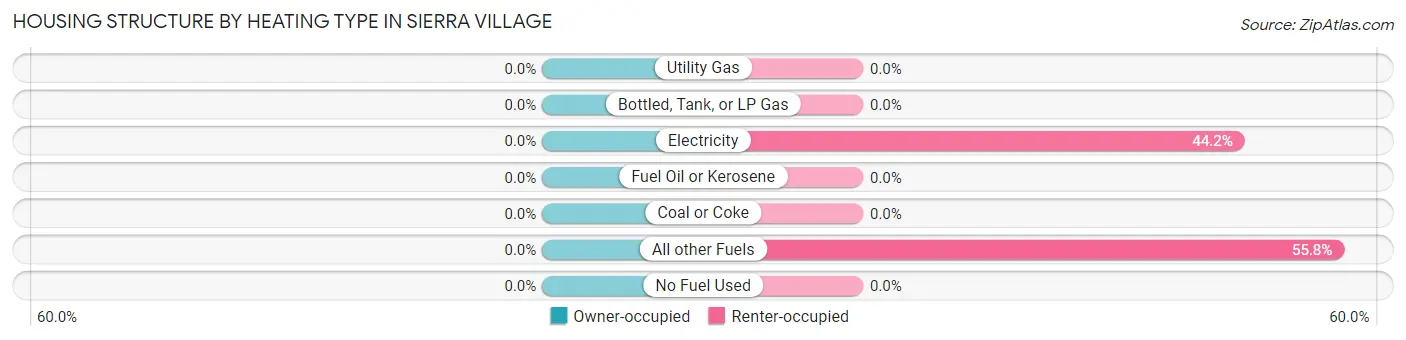
Housing Structure by Heating Type in Sierra Village
Heating Type
Owner-occupied
Renter-occupied
Utility Gas
0 (0.0%)
0 (0.0%)
Bottled, Tank, or LP Gas
0 (0.0%)
0 (0.0%)
Electricity
0 (0.0%)
23 (44.2%)
Fuel Oil or Kerosene
0 (0.0%)
0 (0.0%)
Coal or Coke
0 (0.0%)
0 (0.0%)
All other Fuels
0 (0.0%)
29 (55.8%)
No Fuel Used
0 (0.0%)
0 (0.0%)
Total
0 (0.0%)
52 (100.0%)
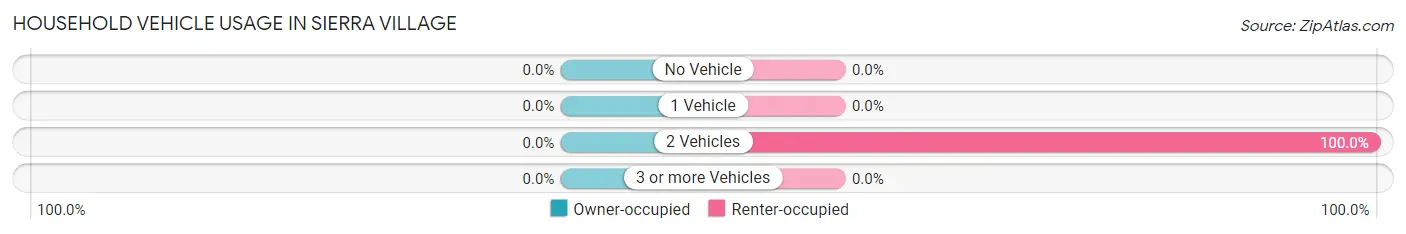
Household Vehicle Usage in Sierra Village
Vehicles per Household
Owner-occupied
Renter-occupied
No Vehicle
0 (0.0%)
0 (0.0%)
1 Vehicle
0 (0.0%)
0 (0.0%)
2 Vehicles
0 (0.0%)
52 (100.0%)
3 or more Vehicles
0 (0.0%)
0 (0.0%)
Total
0 (0.0%)
52 (100.0%)
Real Estate & Mortgages in Sierra Village
Real Estate and Mortgage Overview in Sierra Village
Characteristic
Without Mortgage
With Mortgage
Housing Units
0
0
Median Property Value
-
-
Median Household Income
-
-
Monthly Housing Costs
-
-
Real Estate Taxes
-
-
Property Value by Mortgage Status in Sierra Village
Property Value
Without Mortgage
With Mortgage
Less than $50,000
0 (0.0%)
0 (0.0%)
$50,000 to $99,999
0 (0.0%)
0 (0.0%)
$100,000 to $299,999
0 (0.0%)
0 (0.0%)
$300,000 to $499,999
0 (0.0%)
0 (0.0%)
$500,000 to $749,999
0 (0.0%)
0 (0.0%)
$750,000 to $999,999
0 (0.0%)
0 (0.0%)
$1,000,000 or more
0 (0.0%)
0 (0.0%)
Total
0 (0.0%)
0 (0.0%)
Household Income by Mortgage Status in Sierra Village
Household Income
Without Mortgage
With Mortgage
Less than $10,000
0 (0.0%)
0 (0.0%)
$10,000 to $24,999
0 (0.0%)
0 (0.0%)
$25,000 to $34,999
0 (0.0%)
0 (0.0%)
$35,000 to $49,999
0 (0.0%)
0 (0.0%)
$50,000 to $74,999
0 (0.0%)
0 (0.0%)
$75,000 to $99,999
0 (0.0%)
0 (0.0%)
$100,000 to $149,999
0 (0.0%)
0 (0.0%)
$150,000 or more
0 (0.0%)
0 (0.0%)
Total
0 (0.0%)
0 (0.0%)
Property Value to Household Income Ratio in Sierra Village
Value-to-Income Ratio
Without Mortgage
With Mortgage
Less than 2.0x
0 (0.0%)
0 (0.0%)
2.0x to 2.9x
0 (0.0%)
0 (0.0%)
3.0x to 3.9x
0 (0.0%)
0 (0.0%)
4.0x or more
0 (0.0%)
0 (0.0%)
Total
0 (0.0%)
0 (0.0%)
Real Estate Taxes by Mortgage Status in Sierra Village
Property Taxes
Without Mortgage
With Mortgage
Less than $800
0 (0.0%)
0 (0.0%)
$800 to $1,499
0 (0.0%)
0 (0.0%)
$800 to $1,499
0 (0.0%)
0 (0.0%)
Total
0 (0.0%)
0 (0.0%)
Health & Disability in Sierra Village
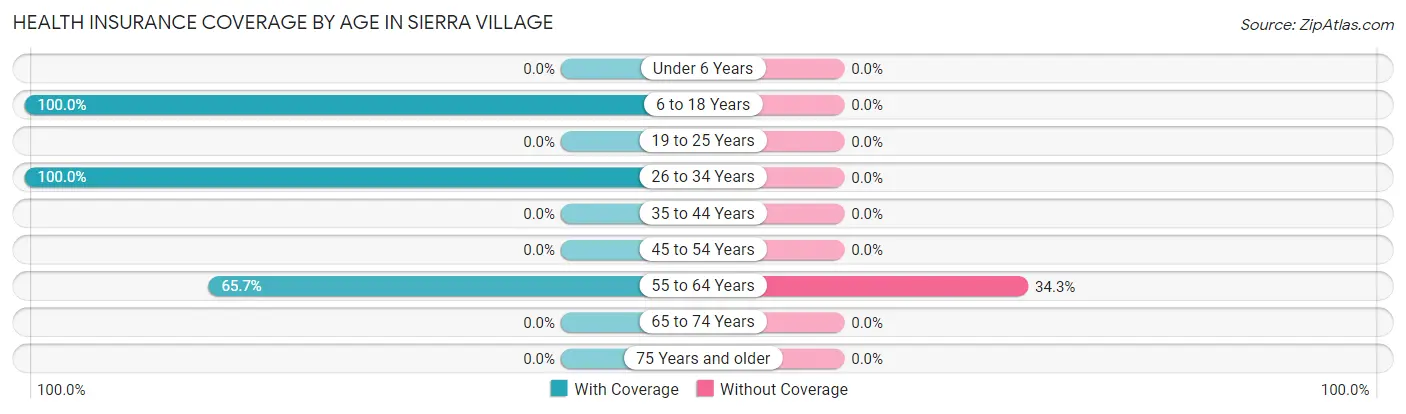
Health Insurance Coverage by Age in Sierra Village
Age Bracket
With Coverage
Without Coverage
Under 6 Years
0 (0.0%)
0 (0.0%)
6 to 18 Years
38 (100.0%)
0 (0.0%)
19 to 25 Years
0 (0.0%)
0 (0.0%)
26 to 34 Years
17 (100.0%)
0 (0.0%)
35 to 44 Years
0 (0.0%)
0 (0.0%)
45 to 54 Years
0 (0.0%)
0 (0.0%)
55 to 64 Years
23 (65.7%)
12 (34.3%)
65 to 74 Years
0 (0.0%)
0 (0.0%)
75 Years and older
0 (0.0%)
0 (0.0%)
Total
78 (86.7%)
12 (13.3%)
Health Insurance Coverage by Citizenship Status in Sierra Village
Citizenship Status
With Coverage
Without Coverage
Native Born
0 (0.0%)
0 (0.0%)
Foreign Born, Citizen
38 (100.0%)
0 (0.0%)
Foreign Born, not a Citizen
0 (0.0%)
0 (0.0%)
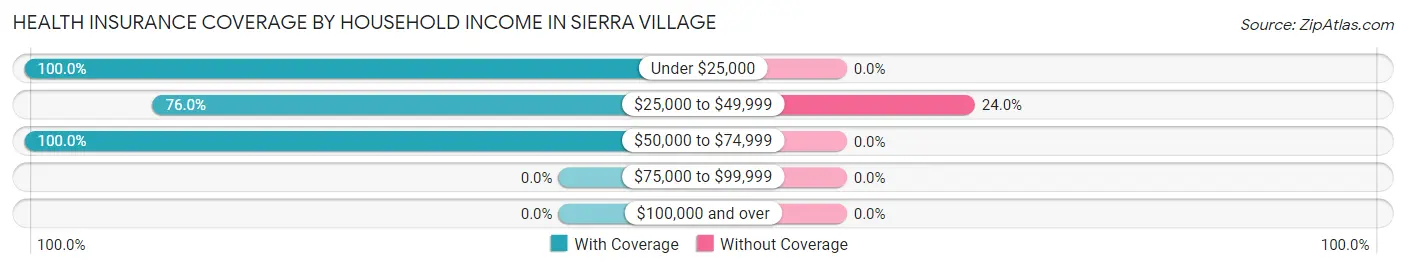
Health Insurance Coverage by Household Income in Sierra Village
Household Income
With Coverage
Without Coverage
Under $25,000
23 (100.0%)
0 (0.0%)
$25,000 to $49,999
38 (76.0%)
12 (24.0%)
$50,000 to $74,999
17 (100.0%)
0 (0.0%)
$75,000 to $99,999
0 (0.0%)
0 (0.0%)
$100,000 and over
0 (0.0%)
0 (0.0%)
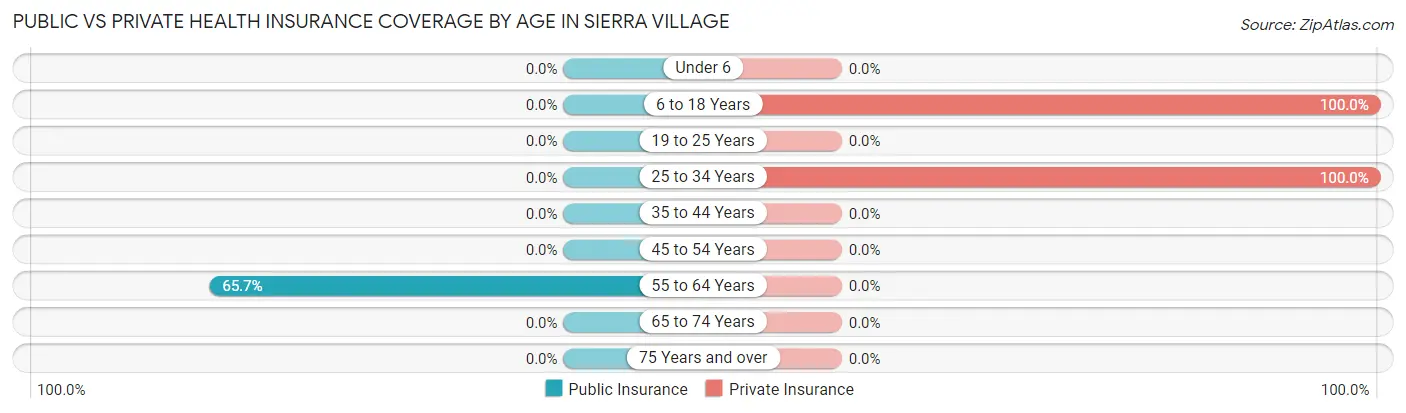
Public vs Private Health Insurance Coverage by Age in Sierra Village
Age Bracket
Public Insurance
Private Insurance
Under 6
0 (0.0%)
0 (0.0%)
6 to 18 Years
0 (0.0%)
38 (100.0%)
19 to 25 Years
0 (0.0%)
0 (0.0%)
25 to 34 Years
0 (0.0%)
17 (100.0%)
35 to 44 Years
0 (0.0%)
0 (0.0%)
45 to 54 Years
0 (0.0%)
0 (0.0%)
55 to 64 Years
23 (65.7%)
0 (0.0%)
65 to 74 Years
0 (0.0%)
0 (0.0%)
75 Years and over
0 (0.0%)
0 (0.0%)
Total
23 (25.6%)
55 (61.1%)
Disability Status by Sex by Age in Sierra Village
Age Bracket
Male
Female
Under 5 Years
0 (0.0%)
0 (0.0%)
5 to 17 Years
0 (0.0%)
0 (0.0%)
18 to 34 Years
0 (0.0%)
0 (0.0%)
35 to 64 Years
0 (0.0%)
0 (0.0%)
65 to 74 Years
0 (0.0%)
0 (0.0%)
75 Years and over
0 (0.0%)
0 (0.0%)
Disability Class by Sex by Age in Sierra Village
Disability Class: Hearing Difficulty
Age Bracket
Male
Female
Under 5 Years
0 (0.0%)
0 (0.0%)
5 to 17 Years
0 (0.0%)
0 (0.0%)
18 to 34 Years
0 (0.0%)
0 (0.0%)
35 to 64 Years
0 (0.0%)
0 (0.0%)
65 to 74 Years
0 (0.0%)
0 (0.0%)
75 Years and over
0 (0.0%)
0 (0.0%)
Disability Class: Vision Difficulty
Age Bracket
Male
Female
Under 5 Years
0 (0.0%)
0 (0.0%)
5 to 17 Years
0 (0.0%)
0 (0.0%)
18 to 34 Years
0 (0.0%)
0 (0.0%)
35 to 64 Years
0 (0.0%)
0 (0.0%)
65 to 74 Years
0 (0.0%)
0 (0.0%)
75 Years and over
0 (0.0%)
0 (0.0%)
Disability Class: Cognitive Difficulty
Age Bracket
Male
Female
5 to 17 Years
0 (0.0%)
0 (0.0%)
18 to 34 Years
0 (0.0%)
0 (0.0%)
35 to 64 Years
0 (0.0%)
0 (0.0%)
65 to 74 Years
0 (0.0%)
0 (0.0%)
75 Years and over
0 (0.0%)
0 (0.0%)
Disability Class: Ambulatory Difficulty
Age Bracket
Male
Female
5 to 17 Years
0 (0.0%)
0 (0.0%)
18 to 34 Years
0 (0.0%)
0 (0.0%)
35 to 64 Years
0 (0.0%)
0 (0.0%)
65 to 74 Years
0 (0.0%)
0 (0.0%)
75 Years and over
0 (0.0%)
0 (0.0%)
Disability Class: Self-Care Difficulty
Age Bracket
Male
Female
5 to 17 Years
0 (0.0%)
0 (0.0%)
18 to 34 Years
0 (0.0%)
0 (0.0%)
35 to 64 Years
0 (0.0%)
0 (0.0%)
65 to 74 Years
0 (0.0%)
0 (0.0%)
75 Years and over
0 (0.0%)
0 (0.0%)
Technology Access in Sierra Village
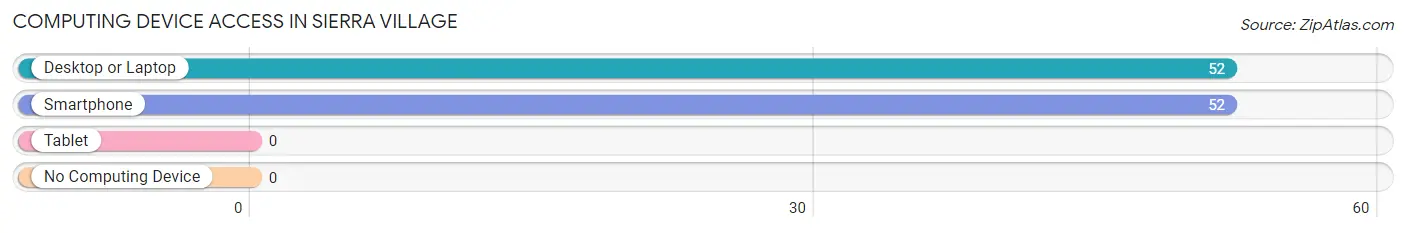
Computing Device Access in Sierra Village
Device Type
# Households
% Households
Desktop or Laptop
52
100.0%
Smartphone
52
100.0%
Tablet
0
0.0%
No Computing Device
0
0.0%
Total
52
100.0%
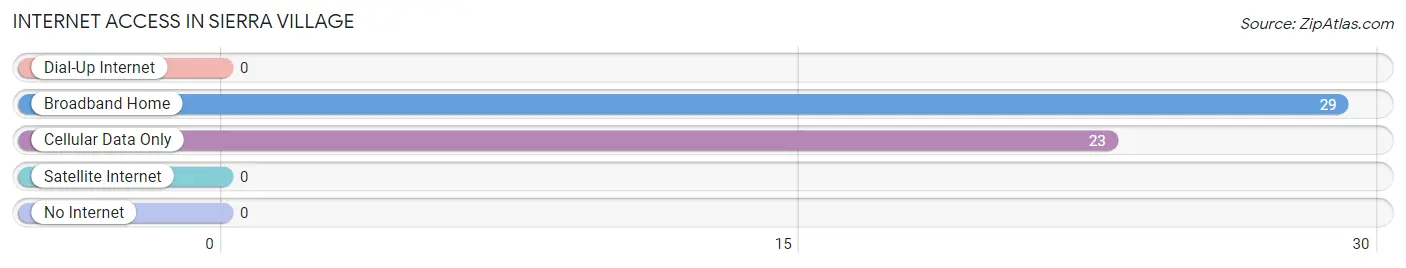
Internet Access in Sierra Village
Internet Type
# Households
% Households
Dial-Up Internet
0
0.0%
Broadband Home
29
55.8%
Cellular Data Only
23
44.2%
Satellite Internet
0
0.0%
No Internet
0
0.0%
Total
52
100.0%
Sierra Village Summary
Sierra Village is a small unincorporated community located in Sierra County, California, United States. It is situated in the Sierra Nevada mountain range, approximately 8 miles (13 km) east of Sierra City and 25 miles (40 km) west of Truckee. The population of Sierra Village was estimated to be around 200 people in 2020.
History
Sierra Village was founded in the late 1800s by miners who were drawn to the area by the discovery of gold in the nearby Yuba River. The miners built a small settlement and named it Sierra Village. The town grew slowly over the years, and by the early 1900s, it had become a popular destination for tourists and outdoor enthusiasts.
In the 1920s, the Sierra Village Ski Club was formed, and the area became a popular ski destination. The ski club built a lodge and several ski runs, and the area became known as a great place to ski.
In the 1950s, the Sierra Village Ski Club was disbanded, and the area became a popular destination for hikers and campers. The area is still popular with outdoor enthusiasts, and it is home to several campgrounds and hiking trails.
Geography
Sierra Village is located in the Sierra Nevada mountain range, at an elevation of 6,000 feet (1,829 m). The area is surrounded by the Yuba River to the north, the Sierra Buttes to the east, and the Sierra Valley to the south. The area is known for its rugged terrain and stunning views of the surrounding mountains.
The climate in Sierra Village is generally mild, with warm summers and cold winters. The average annual temperature is around 50°F (10°C). The area receives an average of 30 inches (76 cm) of precipitation per year, mostly in the form of snow.
Economy
The economy of Sierra Village is largely based on tourism. The area is popular with outdoor enthusiasts, and it is home to several campgrounds and hiking trails. The area is also known for its ski resorts, which attract visitors from all over the world.
In addition to tourism, the area is also home to several small businesses, including restaurants, stores, and lodges. The area is also home to several small farms, which produce a variety of fruits and vegetables.
Demographics
The population of Sierra Village was estimated to be around 200 people in 2020. The majority of the population is white (90%), followed by Hispanic (5%), Asian (2%), and other (3%). The median household income in Sierra Village is $50,000, and the median age is 44 years.
Conclusion
Sierra Village is a small unincorporated community located in Sierra County, California, United States. It is situated in the Sierra Nevada mountain range, and it is known for its stunning views and rugged terrain. The economy of Sierra Village is largely based on tourism, and the area is popular with outdoor enthusiasts. The population of Sierra Village was estimated to be around 200 people in 2020, and the majority of the population is white.
Common Questions
What is Per Capita Income in Sierra Village?
Per Capita income in Sierra Village is $20,319.
What is Inequality or Gini Index in Sierra Village?
Inequality or Gini Index in Sierra Village is 0.40.
What is the Total Population of Sierra Village?
Total Population of Sierra Village is 90.
What is the Total Male Population of Sierra Village?
Total Male Population of Sierra Village is 90.
What is the Median Population Age in Sierra Village?
Median Population Age in Sierra Village is 33.4 Years.
What is the Average Family Size in Sierra Village
Average Family Size in Sierra Village is 4.2 People.
What is the Average Household Size in Sierra Village
Average Household Size in Sierra Village is 1.7 People.
How Large is the Labor Force in Sierra Village?
There are 52 People in the Labor Forcein in Sierra Village.
What is the Percentage of People in the Labor Force in Sierra Village?
100.0% of People are in the Labor Force in Sierra Village.
Report Title
Report Link
HTML Copy & Paste Link
Social Media
Copy and paste the folowing code into any webpage where you would like this interactive chart to display