Zip Codes with the Highest Percentage of Population Employed in Installation, Maintenance & Repair in Gardena, CA
RELATED REPORTS & OPTIONS
Installation, Maintenance & Repair
Gardena
Compare Zip Codes
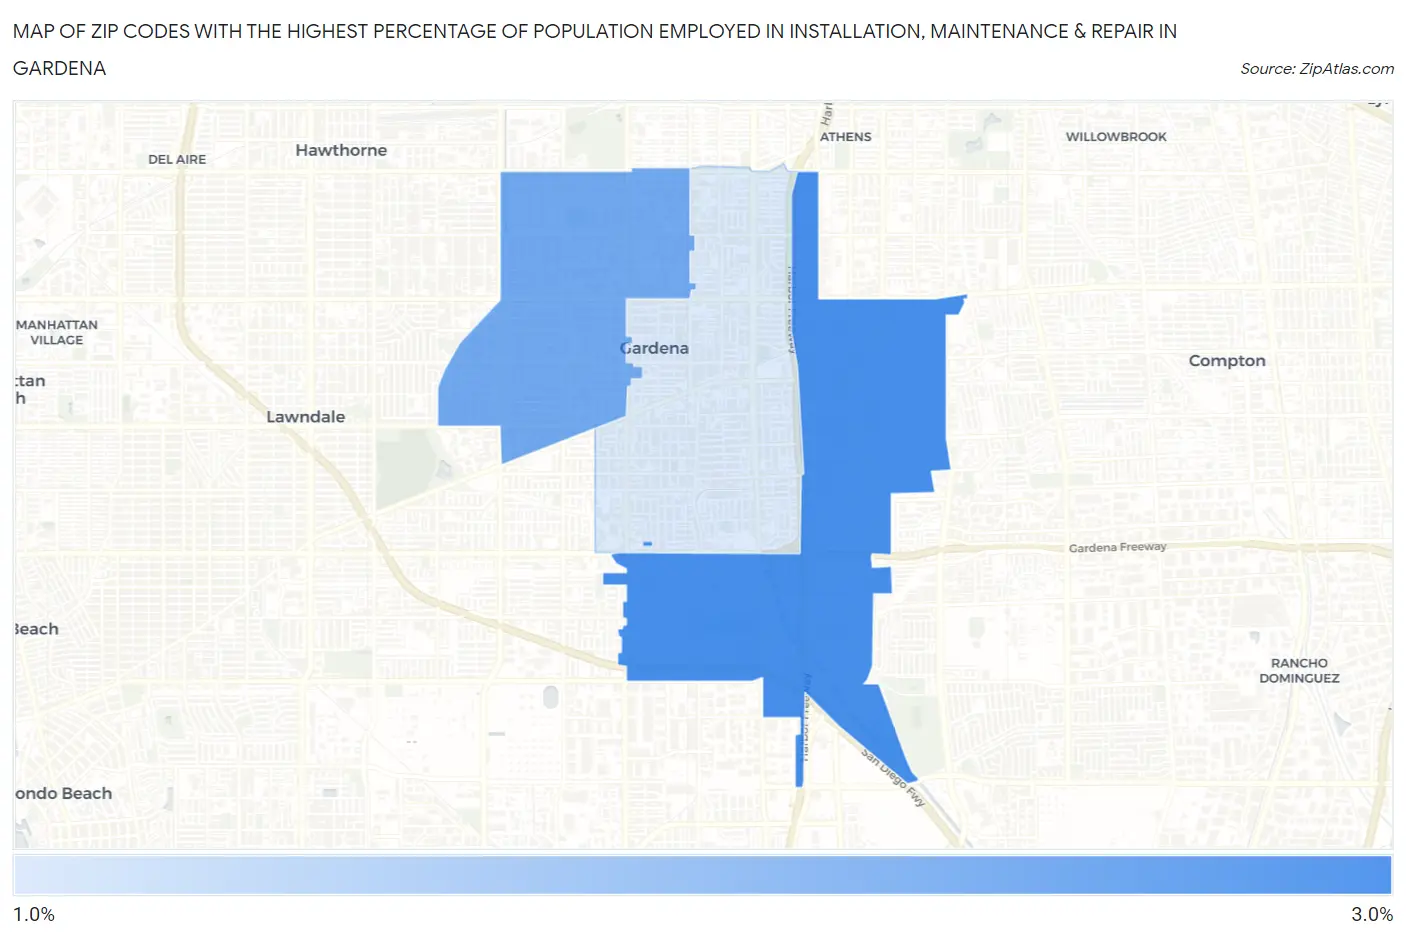
Map of Zip Codes with the Highest Percentage of Population Employed in Installation, Maintenance & Repair in Gardena
1.8%
2.8%
Zip Codes with the Highest Percentage of Population Employed in Installation, Maintenance & Repair in Gardena, CA
| Zip Code | % Employed | vs State | vs National | |
| 1. | 90248 | 2.8% | 2.6%(+0.249)#663 | 3.1%(-0.262)#17,978 |
| 2. | 90249 | 2.5% | 2.6%(-0.040)#780 | 3.1%(-0.552)#19,468 |
| 3. | 90247 | 1.8% | 2.6%(-0.721)#1,025 | 3.1%(-1.23)#22,736 |
1
Common Questions
What are the Top Zip Codes with the Highest Percentage of Population Employed in Installation, Maintenance & Repair in Gardena, CA?
Top Zip Codes with the Highest Percentage of Population Employed in Installation, Maintenance & Repair in Gardena, CA are:
What zip code has the Highest Percentage of Population Employed in Installation, Maintenance & Repair in Gardena, CA?
90248 has the Highest Percentage of Population Employed in Installation, Maintenance & Repair in Gardena, CA with 2.8%.
What is the Percentage of Population Employed in Installation, Maintenance & Repair in Gardena, CA?
Percentage of Population Employed in Installation, Maintenance & Repair in Gardena is 2.1%.
What is the Percentage of Population Employed in Installation, Maintenance & Repair in California?
Percentage of Population Employed in Installation, Maintenance & Repair in California is 2.6%.
What is the Percentage of Population Employed in Installation, Maintenance & Repair in the United States?
Percentage of Population Employed in Installation, Maintenance & Repair in the United States is 3.1%.