Cities with the Highest Percentage of Tongan Population in California
RELATED REPORTS & OPTIONS
Tongan
California
Compare Cities
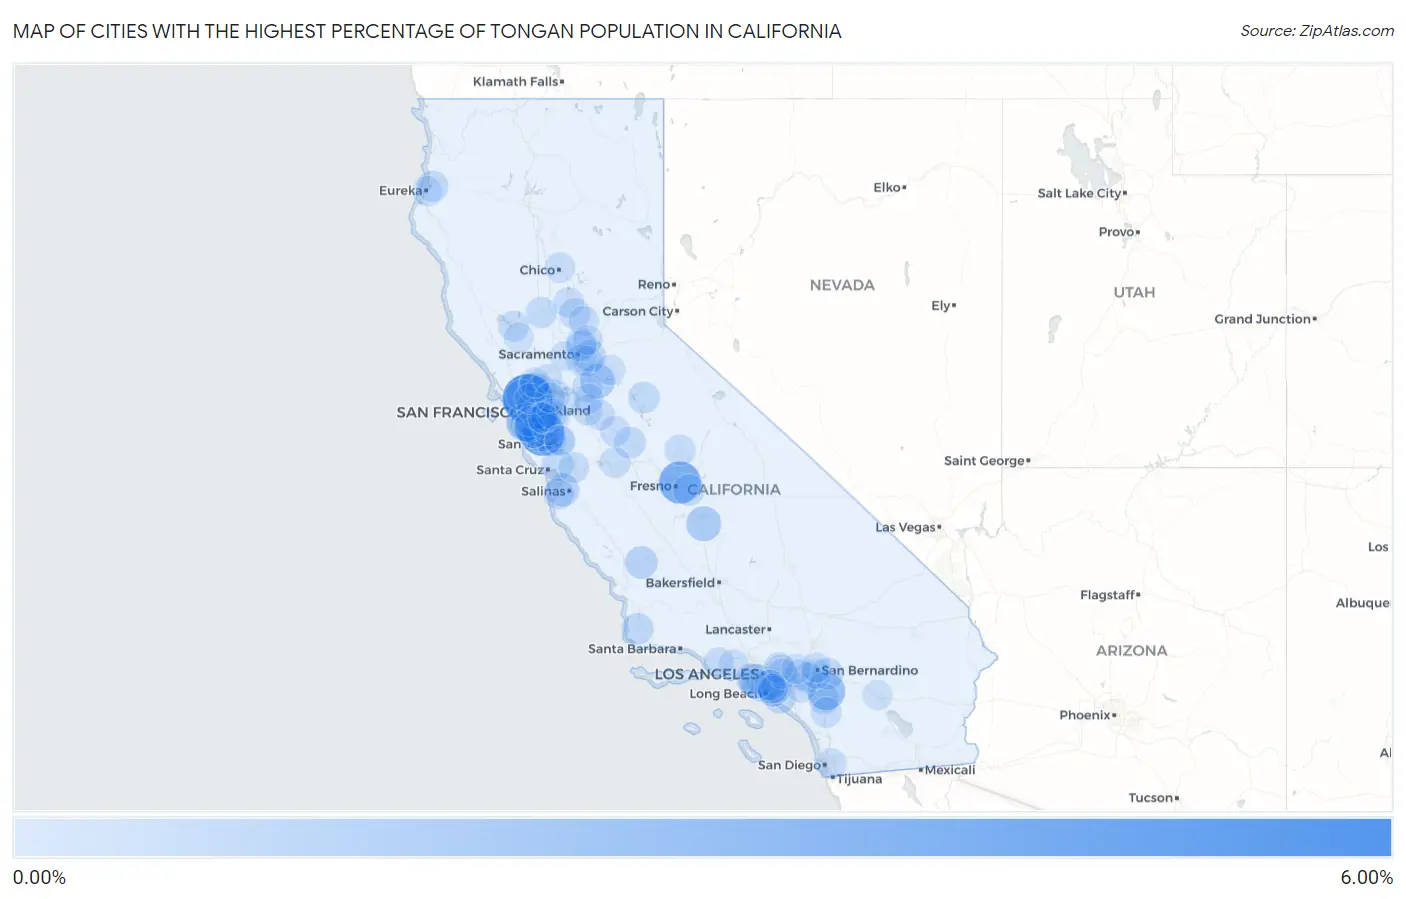
Map of Cities with the Highest Percentage of Tongan Population in California
0.00%
6.00%
Cities with the Highest Percentage of Tongan Population in California
| City | Tongan | vs State | vs National | |
| 1. | Del Dios | 5.95% | 0.060%(+5.89)#1 | 0.021%(+5.93)#7 |
| 2. | North Richmond | 5.95% | 0.060%(+5.88)#2 | 0.021%(+5.92)#8 |
| 3. | East Palo Alto | 4.29% | 0.060%(+4.22)#3 | 0.021%(+4.26)#13 |
| 4. | Tarpey Village | 3.63% | 0.060%(+3.57)#4 | 0.021%(+3.61)#17 |
| 5. | Nuevo | 2.37% | 0.060%(+2.31)#5 | 0.021%(+2.35)#25 |
| 6. | San Bruno | 2.14% | 0.060%(+2.08)#6 | 0.021%(+2.12)#31 |
| 7. | San Lorenzo | 1.69% | 0.060%(+1.63)#7 | 0.021%(+1.67)#43 |
| 8. | Menlo Park | 1.58% | 0.060%(+1.52)#8 | 0.021%(+1.56)#44 |
| 9. | East Tulare Villa | 1.51% | 0.060%(+1.45)#9 | 0.021%(+1.49)#47 |
| 10. | Lennox | 1.47% | 0.060%(+1.41)#10 | 0.021%(+1.45)#49 |
| 11. | Dogtown | 1.44% | 0.060%(+1.38)#11 | 0.021%(+1.42)#53 |
| 12. | San Mateo | 1.15% | 0.060%(+1.09)#12 | 0.021%(+1.13)#67 |
| 13. | Belmont | 1.05% | 0.060%(+0.986)#13 | 0.021%(+1.03)#71 |
| 14. | Marina | 1.02% | 0.060%(+0.964)#14 | 0.021%(+1.00)#74 |
| 15. | Shandon | 0.87% | 0.060%(+0.812)#15 | 0.021%(+0.852)#85 |
| 16. | Millbrae | 0.80% | 0.060%(+0.741)#16 | 0.021%(+0.781)#93 |
| 17. | Fountain Valley | 0.62% | 0.060%(+0.562)#17 | 0.021%(+0.601)#117 |
| 18. | Mentone | 0.62% | 0.060%(+0.558)#18 | 0.021%(+0.597)#118 |
| 19. | Mather | 0.59% | 0.060%(+0.534)#19 | 0.021%(+0.573)#129 |
| 20. | Vandenberg Village | 0.57% | 0.060%(+0.507)#20 | 0.021%(+0.546)#134 |
| 21. | San Leandro | 0.55% | 0.060%(+0.485)#21 | 0.021%(+0.524)#137 |
| 22. | Sanger | 0.53% | 0.060%(+0.467)#22 | 0.021%(+0.506)#140 |
| 23. | East Sonora | 0.53% | 0.060%(+0.465)#23 | 0.021%(+0.505)#141 |
| 24. | Day Valley | 0.52% | 0.060%(+0.462)#24 | 0.021%(+0.502)#142 |
| 25. | Emeryville | 0.52% | 0.060%(+0.461)#25 | 0.021%(+0.501)#143 |
| 26. | Atwater | 0.52% | 0.060%(+0.455)#26 | 0.021%(+0.494)#145 |
| 27. | University Of California-Santa Barbara | 0.51% | 0.060%(+0.446)#27 | 0.021%(+0.486)#146 |
| 28. | Arcata | 0.50% | 0.060%(+0.436)#28 | 0.021%(+0.475)#150 |
| 29. | Elverta | 0.47% | 0.060%(+0.410)#29 | 0.021%(+0.449)#158 |
| 30. | Williams | 0.38% | 0.060%(+0.319)#30 | 0.021%(+0.358)#174 |
| 31. | Parkway | 0.38% | 0.060%(+0.315)#31 | 0.021%(+0.355)#175 |
| 32. | Linda | 0.37% | 0.060%(+0.309)#32 | 0.021%(+0.349)#176 |
| 33. | Ontario | 0.34% | 0.060%(+0.284)#33 | 0.021%(+0.323)#187 |
| 34. | San Carlos | 0.33% | 0.060%(+0.274)#34 | 0.021%(+0.314)#192 |
| 35. | Seaside | 0.33% | 0.060%(+0.271)#35 | 0.021%(+0.310)#195 |
| 36. | Lakewood | 0.32% | 0.060%(+0.257)#36 | 0.021%(+0.297)#199 |
| 37. | Los Banos | 0.32% | 0.060%(+0.256)#37 | 0.021%(+0.295)#200 |
| 38. | East Rancho Dominguez | 0.31% | 0.060%(+0.254)#38 | 0.021%(+0.294)#201 |
| 39. | Marina Del Rey | 0.31% | 0.060%(+0.251)#39 | 0.021%(+0.290)#202 |
| 40. | Menifee | 0.31% | 0.060%(+0.245)#40 | 0.021%(+0.285)#205 |
| 41. | Hayward | 0.30% | 0.060%(+0.236)#41 | 0.021%(+0.275)#211 |
| 42. | Vineyard | 0.30% | 0.060%(+0.235)#42 | 0.021%(+0.274)#212 |
| 43. | Coarsegold | 0.28% | 0.060%(+0.223)#43 | 0.021%(+0.263)#214 |
| 44. | Rossmoor | 0.28% | 0.060%(+0.221)#44 | 0.021%(+0.260)#215 |
| 45. | Gilroy | 0.28% | 0.060%(+0.219)#45 | 0.021%(+0.258)#216 |
| 46. | Lathrop | 0.27% | 0.060%(+0.213)#46 | 0.021%(+0.252)#218 |
| 47. | Live Oak | 0.27% | 0.060%(+0.211)#47 | 0.021%(+0.250)#219 |
| 48. | Clearlake | 0.27% | 0.060%(+0.210)#48 | 0.021%(+0.250)#220 |
| 49. | Redwood City | 0.26% | 0.060%(+0.204)#49 | 0.021%(+0.244)#222 |
| 50. | Los Alamitos | 0.26% | 0.060%(+0.204)#50 | 0.021%(+0.243)#224 |
| 51. | Santa Venetia | 0.26% | 0.060%(+0.204)#51 | 0.021%(+0.243)#225 |
| 52. | Vincent | 0.26% | 0.060%(+0.202)#52 | 0.021%(+0.241)#227 |
| 53. | Oakland | 0.25% | 0.060%(+0.192)#53 | 0.021%(+0.232)#231 |
| 54. | Temecula | 0.25% | 0.060%(+0.188)#54 | 0.021%(+0.228)#233 |
| 55. | Turlock | 0.25% | 0.060%(+0.185)#55 | 0.021%(+0.225)#236 |
| 56. | Jurupa Valley | 0.23% | 0.060%(+0.173)#56 | 0.021%(+0.213)#240 |
| 57. | Buena Park | 0.23% | 0.060%(+0.172)#57 | 0.021%(+0.211)#242 |
| 58. | Rio Linda | 0.23% | 0.060%(+0.169)#58 | 0.021%(+0.208)#243 |
| 59. | Oak Park | 0.22% | 0.060%(+0.160)#59 | 0.021%(+0.199)#253 |
| 60. | Santa Clara | 0.22% | 0.060%(+0.158)#60 | 0.021%(+0.198)#254 |
| 61. | Wheatland | 0.22% | 0.060%(+0.156)#61 | 0.021%(+0.195)#257 |
| 62. | Pittsburg | 0.21% | 0.060%(+0.153)#62 | 0.021%(+0.192)#259 |
| 63. | Lodi | 0.21% | 0.060%(+0.152)#63 | 0.021%(+0.191)#261 |
| 64. | Ione | 0.21% | 0.060%(+0.145)#64 | 0.021%(+0.184)#263 |
| 65. | Dublin | 0.20% | 0.060%(+0.144)#65 | 0.021%(+0.183)#264 |
| 66. | Camarillo | 0.20% | 0.060%(+0.142)#66 | 0.021%(+0.181)#266 |
| 67. | South San Francisco | 0.19% | 0.060%(+0.126)#67 | 0.021%(+0.165)#269 |
| 68. | Benicia | 0.18% | 0.060%(+0.117)#68 | 0.021%(+0.157)#274 |
| 69. | Monrovia | 0.18% | 0.060%(+0.115)#69 | 0.021%(+0.154)#276 |
| 70. | Bellflower | 0.17% | 0.060%(+0.114)#70 | 0.021%(+0.154)#278 |
| 71. | Chico | 0.17% | 0.060%(+0.110)#71 | 0.021%(+0.149)#280 |
| 72. | Fremont | 0.17% | 0.060%(+0.108)#72 | 0.021%(+0.148)#282 |
| 73. | Cherryland | 0.17% | 0.060%(+0.107)#73 | 0.021%(+0.147)#283 |
| 74. | Castro Valley | 0.17% | 0.060%(+0.105)#74 | 0.021%(+0.144)#286 |
| 75. | Lemon Grove | 0.16% | 0.060%(+0.103)#75 | 0.021%(+0.143)#287 |
| 76. | Ripon | 0.16% | 0.060%(+0.101)#76 | 0.021%(+0.141)#290 |
| 77. | San Ramon | 0.16% | 0.060%(+0.099)#77 | 0.021%(+0.138)#291 |
| 78. | West Covina | 0.16% | 0.060%(+0.098)#78 | 0.021%(+0.137)#294 |
| 79. | Corona | 0.15% | 0.060%(+0.092)#79 | 0.021%(+0.132)#299 |
| 80. | Colton | 0.15% | 0.060%(+0.086)#80 | 0.021%(+0.125)#301 |
| 81. | East Foothills | 0.15% | 0.060%(+0.085)#81 | 0.021%(+0.124)#303 |
| 82. | Alum Rock | 0.14% | 0.060%(+0.083)#82 | 0.021%(+0.123)#304 |
| 83. | Hidden Valley Lake | 0.14% | 0.060%(+0.076)#83 | 0.021%(+0.116)#309 |
| 84. | Vallejo | 0.14% | 0.060%(+0.076)#84 | 0.021%(+0.116)#310 |
| 85. | Davis | 0.13% | 0.060%(+0.073)#85 | 0.021%(+0.113)#312 |
| 86. | Hillsborough | 0.13% | 0.060%(+0.073)#86 | 0.021%(+0.112)#313 |
| 87. | Richmond | 0.13% | 0.060%(+0.065)#87 | 0.021%(+0.104)#320 |
| 88. | Del Aire | 0.12% | 0.060%(+0.060)#88 | 0.021%(+0.100)#324 |
| 89. | Eureka | 0.12% | 0.060%(+0.060)#89 | 0.021%(+0.100)#326 |
| 90. | Indio | 0.11% | 0.060%(+0.052)#90 | 0.021%(+0.092)#331 |
| 91. | Roseville | 0.11% | 0.060%(+0.049)#91 | 0.021%(+0.088)#333 |
| 92. | Brentwood | 0.11% | 0.060%(+0.047)#92 | 0.021%(+0.086)#334 |
| 93. | Fairfield | 0.11% | 0.060%(+0.046)#93 | 0.021%(+0.085)#337 |
| 94. | American Canyon | 0.11% | 0.060%(+0.046)#94 | 0.021%(+0.085)#338 |
| 95. | Upland | 0.11% | 0.060%(+0.045)#95 | 0.021%(+0.084)#339 |
| 96. | Stockton | 0.10% | 0.060%(+0.044)#96 | 0.021%(+0.083)#341 |
| 97. | Ashland | 0.10% | 0.060%(+0.043)#97 | 0.021%(+0.083)#342 |
| 98. | San Bernardino | 0.10% | 0.060%(+0.042)#98 | 0.021%(+0.082)#344 |
| 99. | Concord | 0.100% | 0.060%(+0.040)#99 | 0.021%(+0.079)#346 |
| 100. | Hawaiian Gardens | 0.100% | 0.060%(+0.039)#100 | 0.021%(+0.079)#347 |
Common Questions
What are the Top 10 Cities with the Highest Percentage of Tongan Population in California?
Top 10 Cities with the Highest Percentage of Tongan Population in California are:
#1
5.95%
#2
4.29%
#3
3.63%
#4
2.37%
#5
2.14%
#6
1.69%
#7
1.58%
#8
1.51%
#9
1.47%
#10
1.44%
What city has the Highest Percentage of Tongan Population in California?
North Richmond has the Highest Percentage of Tongan Population in California with 5.95%.
What is the Percentage of Tongan Population in the State of California?
Percentage of Tongan Population in California is 0.060%.
What is the Percentage of Tongan Population in the United States?
Percentage of Tongan Population in the United States is 0.021%.