Zip Codes with the Highest Percentage of Population Employed in Installation, Maintenance & Repair in Yuba City, CA
RELATED REPORTS & OPTIONS
Installation, Maintenance & Repair
Yuba City
Compare Zip Codes
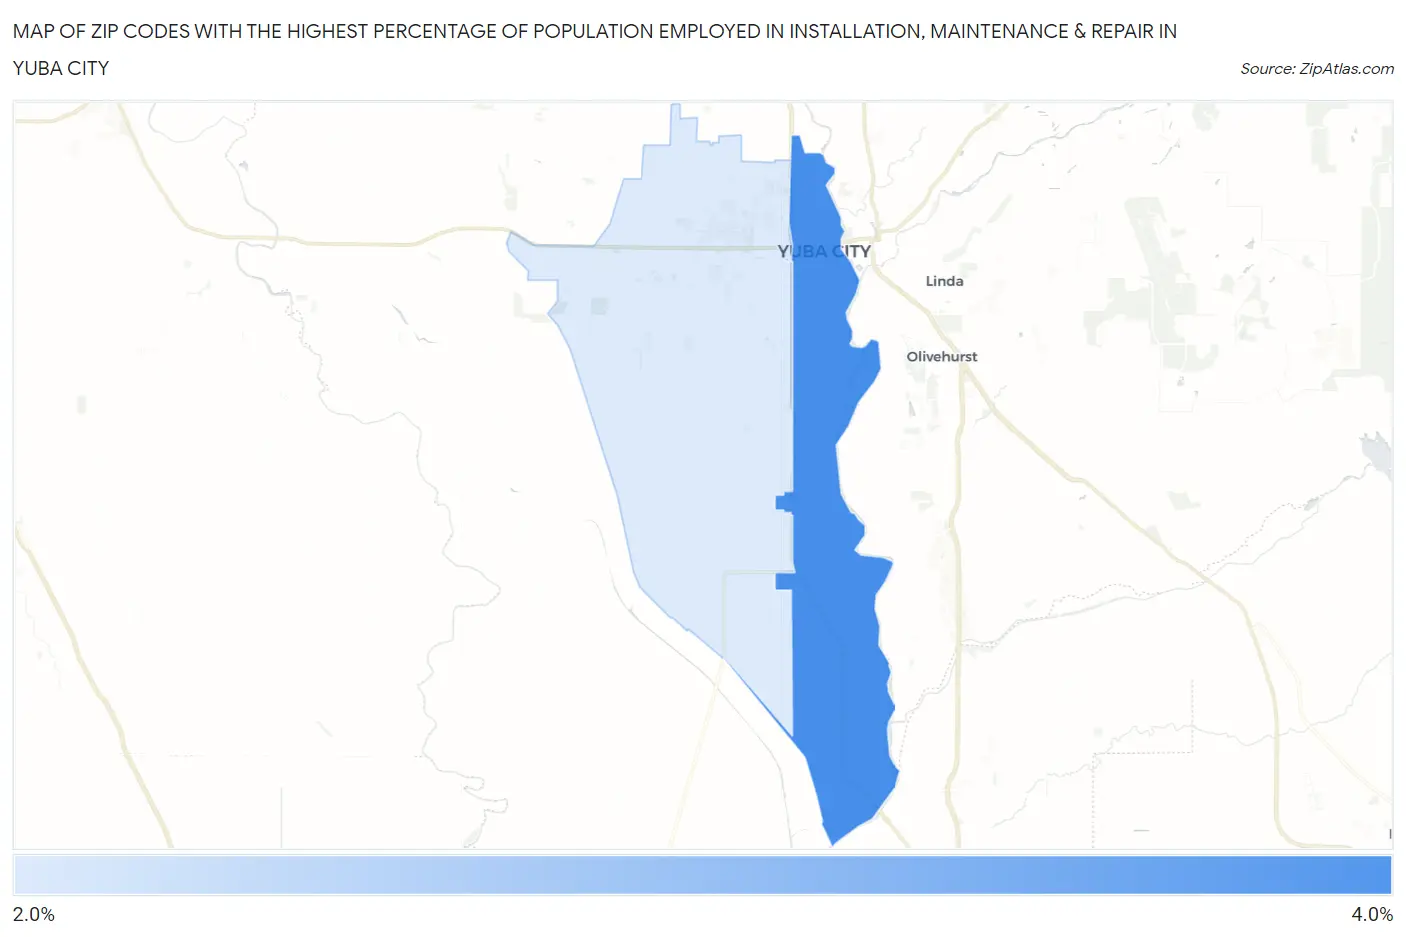
Map of Zip Codes with the Highest Percentage of Population Employed in Installation, Maintenance & Repair in Yuba City
2.5%
3.0%
Zip Codes with the Highest Percentage of Population Employed in Installation, Maintenance & Repair in Yuba City, CA
| Zip Code | % Employed | vs State | vs National | |
| 1. | 95991 | 3.0% | 2.6%(+0.472)#587 | 3.1%(-0.039)#16,852 |
| 2. | 95993 | 2.5% | 2.6%(-0.090)#806 | 3.1%(-0.602)#19,714 |
1
Common Questions
What are the Top Zip Codes with the Highest Percentage of Population Employed in Installation, Maintenance & Repair in Yuba City, CA?
Top Zip Codes with the Highest Percentage of Population Employed in Installation, Maintenance & Repair in Yuba City, CA are:
What zip code has the Highest Percentage of Population Employed in Installation, Maintenance & Repair in Yuba City, CA?
95991 has the Highest Percentage of Population Employed in Installation, Maintenance & Repair in Yuba City, CA with 3.0%.
What is the Percentage of Population Employed in Installation, Maintenance & Repair in Yuba City, CA?
Percentage of Population Employed in Installation, Maintenance & Repair in Yuba City is 2.5%.
What is the Percentage of Population Employed in Installation, Maintenance & Repair in California?
Percentage of Population Employed in Installation, Maintenance & Repair in California is 2.6%.
What is the Percentage of Population Employed in Installation, Maintenance & Repair in the United States?
Percentage of Population Employed in Installation, Maintenance & Repair in the United States is 3.1%.