Cities with the Highest Percentage of Immigrants from Guatemala in California
RELATED REPORTS & OPTIONS
Guatemala
California
Compare Cities
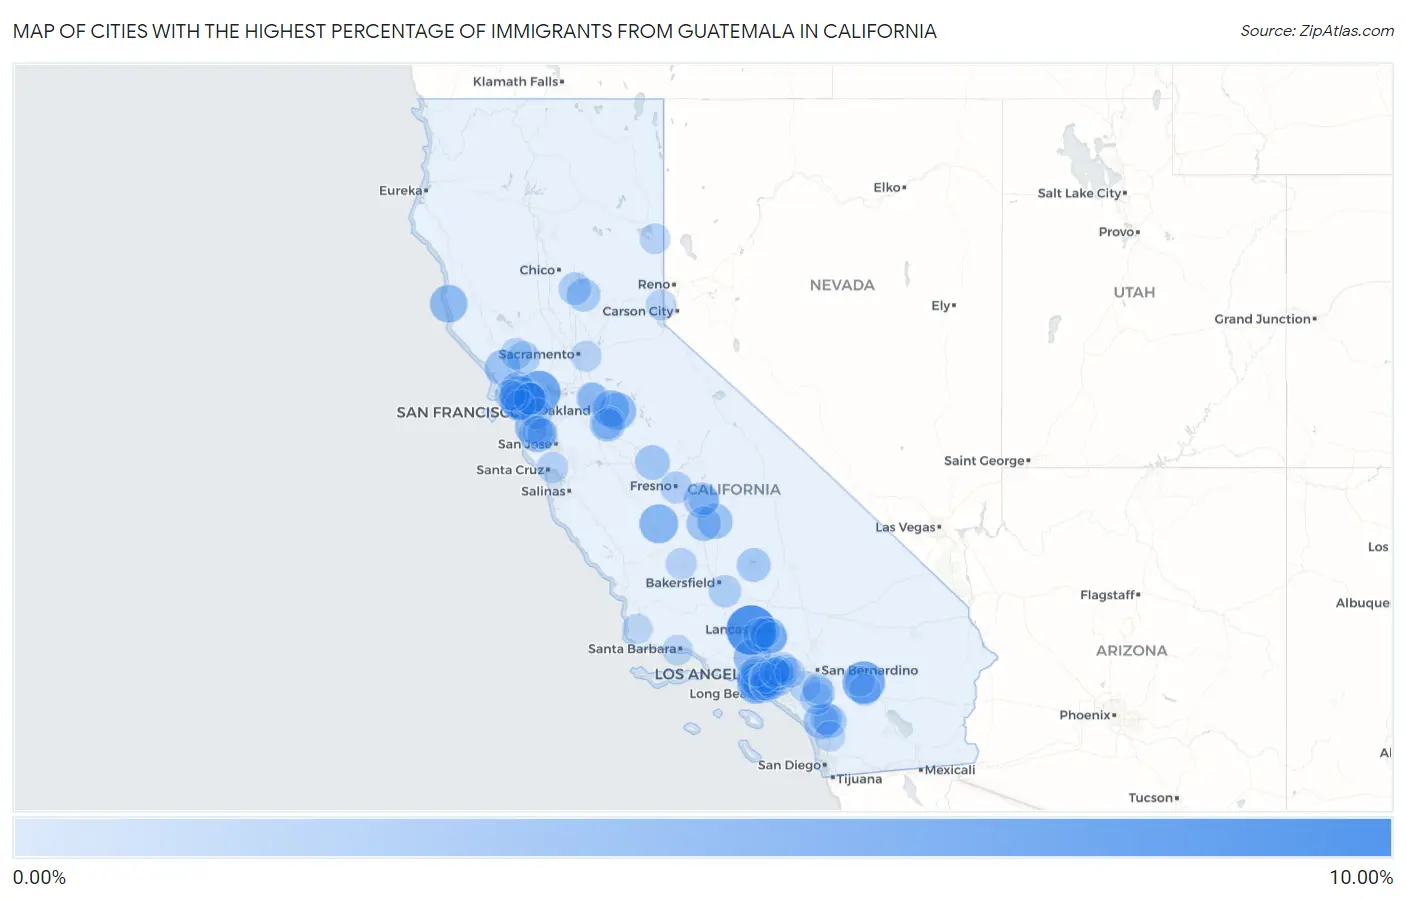
Map of Cities with the Highest Percentage of Immigrants from Guatemala in California
0.00%
10.00%
Cities with the Highest Percentage of Immigrants from Guatemala in California
| City | Guatemala | vs State | vs National | |
| 1. | Lake Hughes | 9.92% | 0.74%(+9.18)#-1 | 0.32%(+9.60)#0 |
| 2. | Port Costa | 7.17% | 0.74%(+6.43)#0 | 0.32%(+6.85)#1 |
| 3. | Garnet | 6.63% | 0.74%(+5.89)#1 | 0.32%(+6.31)#2 |
| 4. | San Rafael | 6.61% | 0.74%(+5.87)#178 | 0.32%(+6.29)#2,862 |
| 5. | Westmont | 6.13% | 0.74%(+5.40)#179 | 0.32%(+5.82)#2,863 |
| 6. | Edison | 6.12% | 0.74%(+5.38)#180 | 0.32%(+5.80)#2,864 |
| 7. | Willowbrook | 5.57% | 0.74%(+4.83)#181 | 0.32%(+5.25)#2,865 |
| 8. | Huron | 5.06% | 0.74%(+4.33)#182 | 0.32%(+4.75)#2,866 |
| 9. | Lawndale | 4.66% | 0.74%(+3.92)#183 | 0.32%(+4.34)#2,867 |
| 10. | Alto | 4.55% | 0.74%(+3.81)#184 | 0.32%(+4.23)#2,868 |
| 11. | Little River | 4.48% | 0.74%(+3.75)#185 | 0.32%(+4.17)#2,869 |
| 12. | San Fernando | 4.43% | 0.74%(+3.69)#186 | 0.32%(+4.11)#2,870 |
| 13. | Lennox | 4.41% | 0.74%(+3.67)#187 | 0.32%(+4.09)#2,871 |
| 14. | East Oakdale | 4.33% | 0.74%(+3.59)#188 | 0.32%(+4.01)#2,872 |
| 15. | North Fair Oaks | 4.13% | 0.74%(+3.39)#189 | 0.32%(+3.81)#2,873 |
| 16. | Desert View Highlands | 4.09% | 0.74%(+3.35)#190 | 0.32%(+3.77)#2,874 |
| 17. | Valley Home | 4.07% | 0.74%(+3.33)#191 | 0.32%(+3.75)#2,875 |
| 18. | Parklawn | 3.56% | 0.74%(+2.83)#192 | 0.32%(+3.25)#2,876 |
| 19. | Tonyville | 3.50% | 0.74%(+2.77)#193 | 0.32%(+3.19)#2,877 |
| 20. | Alondra Park | 3.50% | 0.74%(+2.76)#194 | 0.32%(+3.18)#2,878 |
| 21. | Sebastopol | 3.44% | 0.74%(+2.70)#195 | 0.32%(+3.12)#2,879 |
| 22. | Fallbrook | 3.39% | 0.74%(+2.66)#196 | 0.32%(+3.08)#2,880 |
| 23. | Sultana | 3.38% | 0.74%(+2.65)#197 | 0.32%(+3.07)#2,881 |
| 24. | Fairmead | 3.17% | 0.74%(+2.43)#198 | 0.32%(+2.85)#2,882 |
| 25. | North Richmond | 3.16% | 0.74%(+2.42)#199 | 0.32%(+2.84)#2,883 |
| 26. | East Tulare Villa | 3.13% | 0.74%(+2.39)#200 | 0.32%(+2.81)#2,884 |
| 27. | Rollingwood | 3.13% | 0.74%(+2.39)#201 | 0.32%(+2.81)#2,885 |
| 28. | West Athens | 3.08% | 0.74%(+2.34)#202 | 0.32%(+2.76)#2,886 |
| 29. | Los Angeles | 3.05% | 0.74%(+2.31)#203 | 0.32%(+2.73)#2,887 |
| 30. | Florence Graham | 2.95% | 0.74%(+2.21)#204 | 0.32%(+2.63)#2,894 |
| 31. | Novato | 2.93% | 0.74%(+2.19)#205 | 0.32%(+2.62)#2,984 |
| 32. | Squirrel Mountain Valley | 2.80% | 0.74%(+2.06)#206 | 0.32%(+2.48)#2,985 |
| 33. | Inglewood | 2.72% | 0.74%(+1.99)#207 | 0.32%(+2.41)#2,986 |
| 34. | Leona Valley | 2.55% | 0.74%(+1.81)#208 | 0.32%(+2.23)#2,987 |
| 35. | Pala | 2.53% | 0.74%(+1.79)#209 | 0.32%(+2.21)#2,988 |
| 36. | West Rancho Dominguez | 2.51% | 0.74%(+1.77)#210 | 0.32%(+2.19)#2,989 |
| 37. | Bangor | 2.51% | 0.74%(+1.77)#211 | 0.32%(+2.19)#2,990 |
| 38. | Hawthorne | 2.49% | 0.74%(+1.75)#212 | 0.32%(+2.17)#2,991 |
| 39. | Huntington Park | 2.39% | 0.74%(+1.65)#213 | 0.32%(+2.07)#2,992 |
| 40. | Gardena | 2.37% | 0.74%(+1.63)#214 | 0.32%(+2.05)#2,993 |
| 41. | South Oroville | 2.31% | 0.74%(+1.58)#215 | 0.32%(+2.00)#2,994 |
| 42. | Cudahy | 2.31% | 0.74%(+1.57)#216 | 0.32%(+2.00)#2,995 |
| 43. | San Mateo | 2.25% | 0.74%(+1.51)#217 | 0.32%(+1.93)#2,996 |
| 44. | St Helena | 2.17% | 0.74%(+1.44)#218 | 0.32%(+1.86)#2,997 |
| 45. | Maywood | 2.14% | 0.74%(+1.40)#219 | 0.32%(+1.82)#2,998 |
| 46. | Rainbow | 2.13% | 0.74%(+1.39)#220 | 0.32%(+1.81)#2,999 |
| 47. | Lake Elsinore | 2.08% | 0.74%(+1.35)#221 | 0.32%(+1.77)#3,000 |
| 48. | Weedpatch | 2.08% | 0.74%(+1.34)#222 | 0.32%(+1.76)#3,001 |
| 49. | Calwa | 2.01% | 0.74%(+1.27)#223 | 0.32%(+1.69)#3,002 |
| 50. | Richmond | 2.01% | 0.74%(+1.27)#224 | 0.32%(+1.69)#3,003 |
| 51. | Good Hope | 1.98% | 0.74%(+1.24)#225 | 0.32%(+1.66)#3,004 |
| 52. | Oakland | 1.97% | 0.74%(+1.23)#226 | 0.32%(+1.65)#3,005 |
| 53. | Commerce | 1.96% | 0.74%(+1.22)#227 | 0.32%(+1.64)#3,006 |
| 54. | Garden Acres | 1.92% | 0.74%(+1.18)#228 | 0.32%(+1.60)#3,007 |
| 55. | Walnut Park | 1.89% | 0.74%(+1.15)#229 | 0.32%(+1.57)#3,008 |
| 56. | South Gate | 1.89% | 0.74%(+1.15)#230 | 0.32%(+1.57)#3,009 |
| 57. | San Pablo | 1.87% | 0.74%(+1.13)#231 | 0.32%(+1.55)#3,010 |
| 58. | Cathedral City | 1.86% | 0.74%(+1.12)#232 | 0.32%(+1.54)#3,011 |
| 59. | South El Monte | 1.83% | 0.74%(+1.10)#233 | 0.32%(+1.52)#3,012 |
| 60. | East Rancho Dominguez | 1.80% | 0.74%(+1.06)#234 | 0.32%(+1.48)#3,013 |
| 61. | Calistoga | 1.79% | 0.74%(+1.05)#235 | 0.32%(+1.47)#3,014 |
| 62. | East Los Angeles | 1.74% | 0.74%(+0.997)#236 | 0.32%(+1.42)#3,015 |
| 63. | Bell Gardens | 1.73% | 0.74%(+0.994)#237 | 0.32%(+1.41)#3,016 |
| 64. | Downey | 1.71% | 0.74%(+0.967)#238 | 0.32%(+1.39)#3,017 |
| 65. | Palmdale | 1.68% | 0.74%(+0.943)#239 | 0.32%(+1.36)#3,018 |
| 66. | Soquel | 1.67% | 0.74%(+0.928)#240 | 0.32%(+1.35)#3,019 |
| 67. | Home Gardens | 1.65% | 0.74%(+0.915)#241 | 0.32%(+1.34)#3,020 |
| 68. | Lost Hills | 1.65% | 0.74%(+0.915)#242 | 0.32%(+1.34)#3,021 |
| 69. | East San Gabriel | 1.63% | 0.74%(+0.895)#243 | 0.32%(+1.32)#3,022 |
| 70. | La Habra Heights | 1.61% | 0.74%(+0.869)#244 | 0.32%(+1.29)#3,023 |
| 71. | Lynwood | 1.59% | 0.74%(+0.848)#245 | 0.32%(+1.27)#3,024 |
| 72. | Bystrom | 1.57% | 0.74%(+0.835)#246 | 0.32%(+1.26)#3,025 |
| 73. | La Puente | 1.54% | 0.74%(+0.806)#247 | 0.32%(+1.23)#3,026 |
| 74. | Rosemont | 1.51% | 0.74%(+0.768)#248 | 0.32%(+1.19)#3,027 |
| 75. | Kings Beach | 1.47% | 0.74%(+0.730)#249 | 0.32%(+1.15)#3,028 |
| 76. | Norwalk | 1.46% | 0.74%(+0.719)#250 | 0.32%(+1.14)#3,029 |
| 77. | Desert Hot Springs | 1.45% | 0.74%(+0.716)#251 | 0.32%(+1.14)#3,030 |
| 78. | Avocado Heights | 1.45% | 0.74%(+0.710)#252 | 0.32%(+1.13)#3,031 |
| 79. | Lagunitas Forest Knolls | 1.43% | 0.74%(+0.693)#253 | 0.32%(+1.11)#3,032 |
| 80. | Charter Oak | 1.41% | 0.74%(+0.676)#254 | 0.32%(+1.10)#3,033 |
| 81. | Herlong | 1.41% | 0.74%(+0.668)#255 | 0.32%(+1.09)#3,034 |
| 82. | Azusa | 1.40% | 0.74%(+0.666)#256 | 0.32%(+1.09)#3,035 |
| 83. | Silverado | 1.37% | 0.74%(+0.629)#257 | 0.32%(+1.05)#3,036 |
| 84. | Redwood City | 1.37% | 0.74%(+0.628)#258 | 0.32%(+1.05)#3,037 |
| 85. | East Palo Alto | 1.36% | 0.74%(+0.617)#259 | 0.32%(+1.04)#3,038 |
| 86. | Compton | 1.35% | 0.74%(+0.612)#260 | 0.32%(+1.03)#3,039 |
| 87. | Marin City | 1.35% | 0.74%(+0.607)#261 | 0.32%(+1.03)#3,040 |
| 88. | Santa Barbara | 1.30% | 0.74%(+0.561)#262 | 0.32%(+0.981)#3,041 |
| 89. | Mead Valley | 1.29% | 0.74%(+0.550)#263 | 0.32%(+0.970)#3,042 |
| 90. | August | 1.27% | 0.74%(+0.527)#264 | 0.32%(+0.948)#3,043 |
| 91. | Escondido | 1.26% | 0.74%(+0.527)#265 | 0.32%(+0.947)#3,044 |
| 92. | Baldwin Park | 1.25% | 0.74%(+0.508)#266 | 0.32%(+0.928)#3,045 |
| 93. | Orosi | 1.24% | 0.74%(+0.504)#267 | 0.32%(+0.924)#3,046 |
| 94. | Quartz Hill | 1.24% | 0.74%(+0.501)#268 | 0.32%(+0.921)#3,047 |
| 95. | West Hollywood | 1.22% | 0.74%(+0.484)#269 | 0.32%(+0.904)#3,048 |
| 96. | Vernon | 1.22% | 0.74%(+0.478)#270 | 0.32%(+0.898)#3,049 |
| 97. | Vandenberg Village | 1.19% | 0.74%(+0.456)#271 | 0.32%(+0.876)#3,050 |
| 98. | El Monte | 1.18% | 0.74%(+0.446)#272 | 0.32%(+0.866)#3,051 |
| 99. | Fairfax | 1.18% | 0.74%(+0.438)#273 | 0.32%(+0.858)#3,052 |
| 100. | Pomona | 1.17% | 0.74%(+0.431)#274 | 0.32%(+0.852)#3,053 |
Common Questions
What are the Top 10 Cities with the Highest Percentage of Immigrants from Guatemala in California?
Top 10 Cities with the Highest Percentage of Immigrants from Guatemala in California are:
#1
9.92%
#2
7.17%
#3
6.63%
#4
6.61%
#5
6.13%
#6
5.57%
#7
5.06%
#8
4.66%
#9
4.55%
#10
4.48%
What city has the Highest Percentage of Immigrants from Guatemala in California?
Lake Hughes has the Highest Percentage of Immigrants from Guatemala in California with 9.92%.
What is the Percentage of Immigrants from Guatemala in the State of California?
Percentage of Immigrants from Guatemala in California is 0.74%.
What is the Percentage of Immigrants from Guatemala in the United States?
Percentage of Immigrants from Guatemala in the United States is 0.32%.