Cities with the Highest Percentage of Immigrants from Ghana in California
RELATED REPORTS & OPTIONS
Ghana
California
Compare Cities
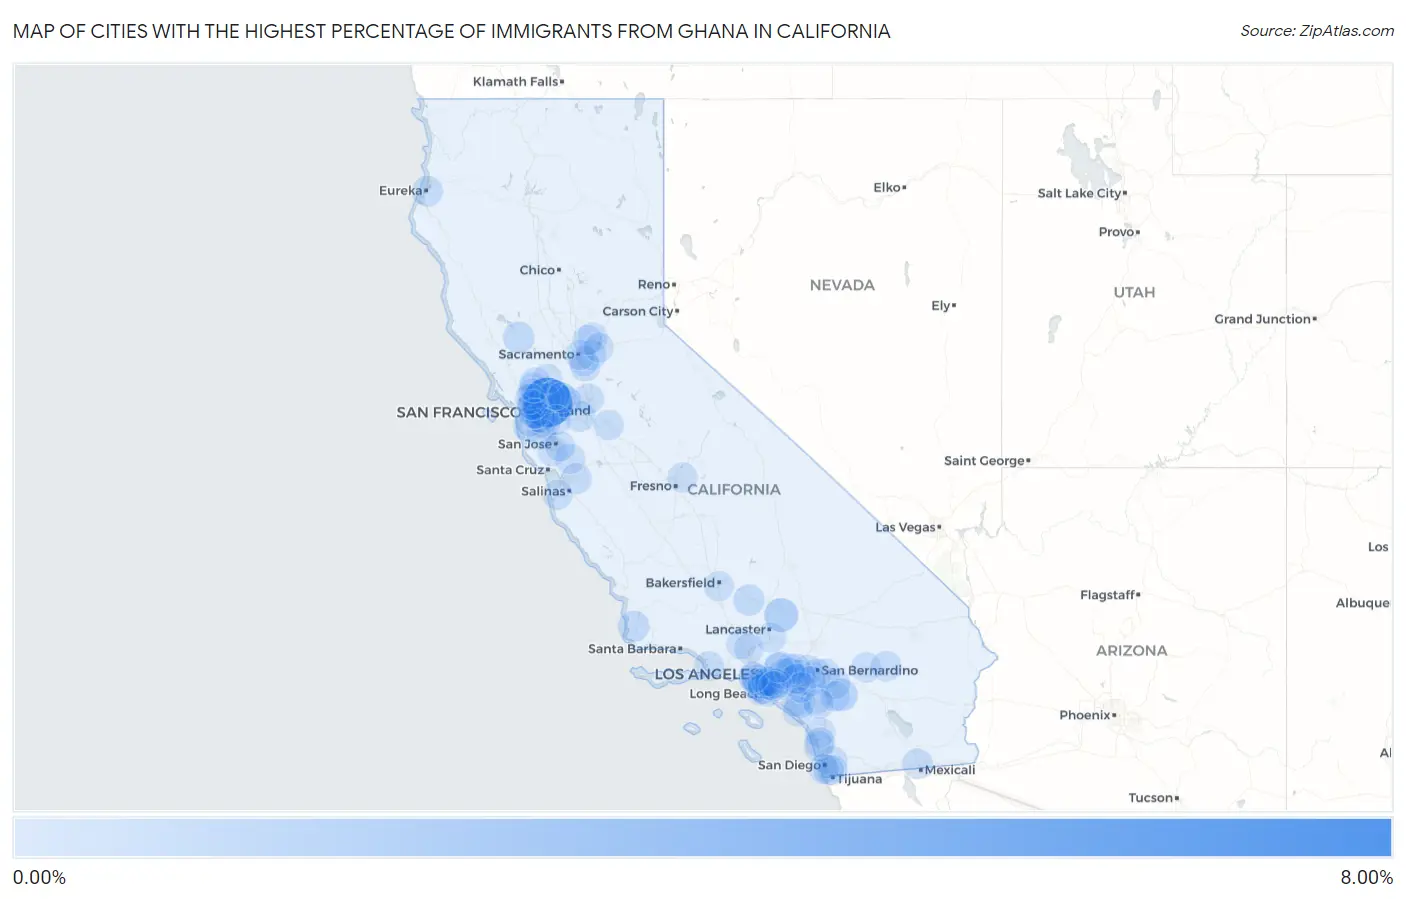
Map of Cities with the Highest Percentage of Immigrants from Ghana in California
0.00%
8.00%
Cities with the Highest Percentage of Immigrants from Ghana in California
| City | Ghana | vs State | vs National | |
| 1. | Shell Ridge | 6.92% | 0.022%(+6.89)#-1 | 0.061%(+6.86)#0 |
| 2. | Edwards Afb | 1.22% | 0.022%(+1.20)#0 | 0.061%(+1.16)#1 |
| 3. | Valle Vista | 0.84% | 0.022%(+0.819)#1 | 0.061%(+0.781)#2 |
| 4. | Brentwood | 0.56% | 0.022%(+0.538)#2 | 0.061%(+0.499)#3 |
| 5. | Ashland | 0.55% | 0.022%(+0.526)#3 | 0.061%(+0.487)#4 |
| 6. | Emeryville | 0.49% | 0.022%(+0.468)#4 | 0.061%(+0.430)#5 |
| 7. | Hidden Valley Lake | 0.41% | 0.022%(+0.388)#5 | 0.061%(+0.349)#6 |
| 8. | Vandenberg Afb | 0.41% | 0.022%(+0.385)#6 | 0.061%(+0.347)#7 |
| 9. | Tehachapi | 0.38% | 0.022%(+0.359)#7 | 0.061%(+0.320)#8 |
| 10. | Burlingame | 0.32% | 0.022%(+0.300)#8 | 0.061%(+0.262)#9 |
| 11. | Tracy | 0.27% | 0.022%(+0.251)#9 | 0.061%(+0.212)#10 |
| 12. | Eureka | 0.27% | 0.022%(+0.245)#10 | 0.061%(+0.207)#11 |
| 13. | Camp Pendleton Mainside | 0.25% | 0.022%(+0.228)#11 | 0.061%(+0.189)#12 |
| 14. | Orinda | 0.21% | 0.022%(+0.183)#12 | 0.061%(+0.144)#13 |
| 15. | San Juan Bautista | 0.20% | 0.022%(+0.180)#13 | 0.061%(+0.141)#14 |
| 16. | Pleasant Hill | 0.20% | 0.022%(+0.178)#14 | 0.061%(+0.139)#15 |
| 17. | Heber | 0.19% | 0.022%(+0.167)#15 | 0.061%(+0.129)#16 |
| 18. | Eastvale | 0.18% | 0.022%(+0.159)#16 | 0.061%(+0.120)#17 |
| 19. | Hawthorne | 0.17% | 0.022%(+0.148)#57 | 0.061%(+0.109)#448 |
| 20. | Signal Hill | 0.15% | 0.022%(+0.132)#58 | 0.061%(+0.093)#449 |
| 21. | Gardena | 0.15% | 0.022%(+0.128)#59 | 0.061%(+0.090)#450 |
| 22. | Lake Elsinore | 0.14% | 0.022%(+0.113)#60 | 0.061%(+0.075)#451 |
| 23. | Hayward | 0.13% | 0.022%(+0.111)#61 | 0.061%(+0.073)#452 |
| 24. | Twentynine Palms | 0.12% | 0.022%(+0.103)#62 | 0.061%(+0.064)#453 |
| 25. | Morgan Hill | 0.12% | 0.022%(+0.101)#63 | 0.061%(+0.063)#454 |
| 26. | La Mesa | 0.11% | 0.022%(+0.089)#64 | 0.061%(+0.051)#455 |
| 27. | Yucca Valley | 0.11% | 0.022%(+0.084)#65 | 0.061%(+0.045)#456 |
| 28. | Stockton | 0.10% | 0.022%(+0.081)#66 | 0.061%(+0.042)#457 |
| 29. | Duarte | 0.10% | 0.022%(+0.079)#67 | 0.061%(+0.040)#458 |
| 30. | Santa Fe Springs | 0.10% | 0.022%(+0.078)#68 | 0.061%(+0.040)#459 |
| 31. | Port Hueneme | 0.096% | 0.022%(+0.074)#69 | 0.061%(+0.035)#460 |
| 32. | Solana Beach | 0.093% | 0.022%(+0.070)#70 | 0.061%(+0.032)#461 |
| 33. | Inglewood | 0.090% | 0.022%(+0.067)#71 | 0.061%(+0.029)#462 |
| 34. | Chino Hills | 0.086% | 0.022%(+0.063)#72 | 0.061%(+0.025)#463 |
| 35. | Ceres | 0.083% | 0.022%(+0.061)#73 | 0.061%(+0.022)#464 |
| 36. | Redlands | 0.083% | 0.022%(+0.061)#74 | 0.061%(+0.022)#465 |
| 37. | Paramount | 0.079% | 0.022%(+0.056)#75 | 0.061%(+0.018)#466 |
| 38. | American Canyon | 0.078% | 0.022%(+0.056)#76 | 0.061%(+0.018)#467 |
| 39. | Elk Grove | 0.078% | 0.022%(+0.056)#77 | 0.061%(+0.017)#468 |
| 40. | Concord | 0.078% | 0.022%(+0.055)#78 | 0.061%(+0.017)#469 |
| 41. | Beaumont | 0.077% | 0.022%(+0.054)#79 | 0.061%(+0.016)#470 |
| 42. | Rancho Santa Margarita | 0.075% | 0.022%(+0.053)#80 | 0.061%(+0.015)#471 |
| 43. | Fontana | 0.068% | 0.022%(+0.045)#81 | 0.061%(+0.007)#472 |
| 44. | West Carson | 0.067% | 0.022%(+0.045)#82 | 0.061%(+0.006)#473 |
| 45. | Vista | 0.067% | 0.022%(+0.045)#83 | 0.061%(+0.006)#474 |
| 46. | Ontario | 0.062% | 0.022%(+0.040)#84 | 0.061%(+0.001)#490 |
| 47. | Chula Vista | 0.062% | 0.022%(+0.039)#85 | 0.061%(+0.001)#491 |
| 48. | Rocklin | 0.059% | 0.022%(+0.036)#86 | 0.061%(-0.002)#492 |
| 49. | National City | 0.059% | 0.022%(+0.036)#87 | 0.061%(-0.002)#493 |
| 50. | Antioch | 0.057% | 0.022%(+0.035)#88 | 0.061%(-0.004)#494 |
| 51. | Clovis | 0.055% | 0.022%(+0.032)#89 | 0.061%(-0.006)#495 |
| 52. | Upland | 0.053% | 0.022%(+0.031)#90 | 0.061%(-0.008)#496 |
| 53. | South San Francisco | 0.052% | 0.022%(+0.029)#91 | 0.061%(-0.009)#497 |
| 54. | Colton | 0.050% | 0.022%(+0.028)#92 | 0.061%(-0.011)#498 |
| 55. | Riverside | 0.050% | 0.022%(+0.027)#93 | 0.061%(-0.011)#499 |
| 56. | Menlo Park | 0.048% | 0.022%(+0.026)#94 | 0.061%(-0.013)#500 |
| 57. | Los Angeles | 0.046% | 0.022%(+0.023)#95 | 0.061%(-0.015)#501 |
| 58. | Hemet | 0.046% | 0.022%(+0.023)#96 | 0.061%(-0.015)#502 |
| 59. | West Rancho Dominguez | 0.045% | 0.022%(+0.023)#97 | 0.061%(-0.016)#503 |
| 60. | Lake Forest | 0.042% | 0.022%(+0.020)#98 | 0.061%(-0.019)#504 |
| 61. | La Verne | 0.042% | 0.022%(+0.019)#99 | 0.061%(-0.019)#505 |
| 62. | Palmdale | 0.041% | 0.022%(+0.018)#100 | 0.061%(-0.020)#506 |
| 63. | Carson | 0.038% | 0.022%(+0.016)#101 | 0.061%(-0.023)#507 |
| 64. | San Leandro | 0.038% | 0.022%(+0.015)#102 | 0.061%(-0.023)#508 |
| 65. | San Juan Capistrano | 0.037% | 0.022%(+0.015)#103 | 0.061%(-0.024)#509 |
| 66. | Bellflower | 0.037% | 0.022%(+0.015)#104 | 0.061%(-0.024)#510 |
| 67. | Monterey | 0.037% | 0.022%(+0.014)#105 | 0.061%(-0.024)#511 |
| 68. | Los Gatos | 0.036% | 0.022%(+0.014)#106 | 0.061%(-0.025)#512 |
| 69. | Fairfield | 0.036% | 0.022%(+0.014)#107 | 0.061%(-0.025)#513 |
| 70. | Rancho Cordova | 0.034% | 0.022%(+0.012)#108 | 0.061%(-0.027)#514 |
| 71. | Florin | 0.034% | 0.022%(+0.012)#109 | 0.061%(-0.027)#515 |
| 72. | Sacramento | 0.033% | 0.022%(+0.011)#110 | 0.061%(-0.028)#516 |
| 73. | Roseville | 0.032% | 0.022%(+0.010)#111 | 0.061%(-0.029)#517 |
| 74. | Castaic | 0.032% | 0.022%(+0.010)#112 | 0.061%(-0.029)#518 |
| 75. | Oakland | 0.032% | 0.022%(+0.010)#113 | 0.061%(-0.029)#522 |
| 76. | Downey | 0.032% | 0.022%(+0.009)#114 | 0.061%(-0.029)#523 |
| 77. | Hercules | 0.031% | 0.022%(+0.008)#115 | 0.061%(-0.030)#524 |
| 78. | West Covina | 0.031% | 0.022%(+0.008)#116 | 0.061%(-0.030)#525 |
| 79. | South Gate | 0.030% | 0.022%(+0.008)#117 | 0.061%(-0.031)#526 |
| 80. | Pomona | 0.030% | 0.022%(+0.008)#118 | 0.061%(-0.031)#527 |
| 81. | Bakersfield | 0.030% | 0.022%(+0.007)#119 | 0.061%(-0.031)#528 |
| 82. | Alameda | 0.030% | 0.022%(+0.007)#120 | 0.061%(-0.031)#529 |
| 83. | Folsom | 0.030% | 0.022%(+0.007)#121 | 0.061%(-0.031)#530 |
| 84. | Pleasanton | 0.029% | 0.022%(+0.007)#122 | 0.061%(-0.032)#531 |
| 85. | Corona | 0.027% | 0.022%(+0.005)#123 | 0.061%(-0.034)#532 |
| 86. | Coronado | 0.026% | 0.022%(+0.004)#124 | 0.061%(-0.034)#533 |
| 87. | Chino | 0.026% | 0.022%(+0.004)#125 | 0.061%(-0.035)#534 |
| 88. | San Pablo | 0.025% | 0.022%(+0.003)#126 | 0.061%(-0.036)#535 |
| 89. | El Sobrante Cdp Riverside County | 0.025% | 0.022%(+0.002)#127 | 0.061%(-0.036)#536 |
| 90. | La Mirada | 0.023% | 0.022%(+0.001)#128 | 0.061%(-0.038)#537 |
| 91. | Wildomar | 0.022% | 0.022%(-0.001)#129 | 0.061%(-0.039)#538 |
| 92. | Berkeley | 0.021% | 0.022%(-0.002)#130 | 0.061%(-0.040)#539 |
| 93. | San Jose | 0.020% | 0.022%(-0.002)#131 | 0.061%(-0.040)#540 |
| 94. | Culver City | 0.020% | 0.022%(-0.003)#132 | 0.061%(-0.041)#541 |
| 95. | Pittsburg | 0.020% | 0.022%(-0.003)#133 | 0.061%(-0.041)#542 |
| 96. | Encinitas | 0.019% | 0.022%(-0.003)#134 | 0.061%(-0.042)#543 |
| 97. | Vallejo | 0.019% | 0.022%(-0.003)#135 | 0.061%(-0.042)#544 |
| 98. | Santa Clarita | 0.019% | 0.022%(-0.004)#136 | 0.061%(-0.042)#545 |
| 99. | Monrovia | 0.019% | 0.022%(-0.004)#137 | 0.061%(-0.042)#546 |
| 100. | Cerritos | 0.018% | 0.022%(-0.004)#138 | 0.061%(-0.043)#547 |
Common Questions
What are the Top 10 Cities with the Highest Percentage of Immigrants from Ghana in California?
Top 10 Cities with the Highest Percentage of Immigrants from Ghana in California are:
#1
6.92%
#2
1.22%
#3
0.84%
#4
0.56%
#5
0.55%
#6
0.49%
#7
0.41%
#8
0.41%
#9
0.38%
#10
0.32%
What city has the Highest Percentage of Immigrants from Ghana in California?
Shell Ridge has the Highest Percentage of Immigrants from Ghana in California with 6.92%.
What is the Percentage of Immigrants from Ghana in the State of California?
Percentage of Immigrants from Ghana in California is 0.022%.
What is the Percentage of Immigrants from Ghana in the United States?
Percentage of Immigrants from Ghana in the United States is 0.061%.