Cities with the Highest Percentage of Population Employed in Installation, Maintenance & Repair in Alaska
RELATED REPORTS & OPTIONS
Installation, Maintenance & Repair
Alaska
Compare Cities
Map of Cities with the Highest Percentage of Population Employed in Installation, Maintenance & Repair in Alaska
0.0%
40.0%
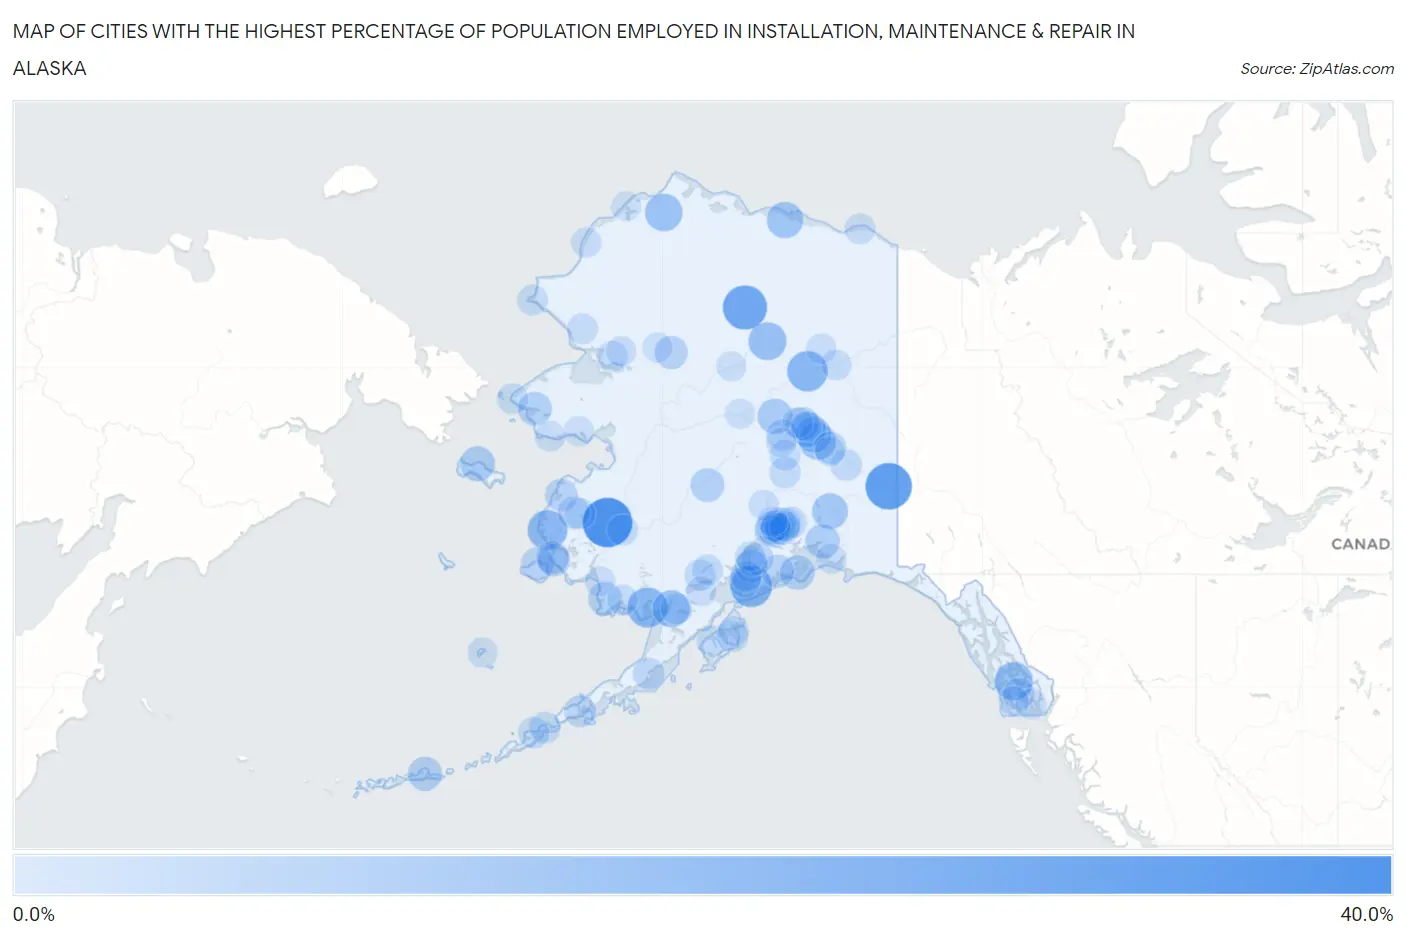
Cities with the Highest Percentage of Population Employed in Installation, Maintenance & Repair in Alaska
| City | % Employed | vs State | vs National | |
| 1. | Russian Mission | 40.0% | 4.3% (+35.7)#1 | 3.1% (+36.9)#143 |
| 2. | Northway | 34.2% | 4.3% (+29.9)#2 | 3.1% (+31.1)#210 |
| 3. | Anaktuvuk Pass | 29.8% | 4.3% (+25.6)#3 | 3.1% (+26.8)#285 |
| 4. | Halibut Cove | 25.0% | 4.3% (+20.7)#4 | 3.1% (+21.9)#411 |
| 5. | Beaver | 22.9% | 4.3% (+18.7)#5 | 3.1% (+19.8)#507 |
| 6. | Clark S Point | 22.2% | 4.3% (+18.0)#6 | 3.1% (+19.2)#533 |
| 7. | Chevak | 21.7% | 4.3% (+17.4)#7 | 3.1% (+18.6)#561 |
| 8. | Coffman Cove | 18.8% | 4.3% (+14.5)#8 | 3.1% (+15.7)#747 |
| 9. | Coldfoot | 18.1% | 4.3% (+13.9)#9 | 3.1% (+15.1)#807 |
| 10. | Atqasuk | 17.4% | 4.3% (+13.1)#10 | 3.1% (+14.3)#867 |
| 11. | Naknek | 16.6% | 4.3% (+12.3)#11 | 3.1% (+13.5)#961 |
| 12. | Harding Birch Lakes | 16.2% | 4.3% (+11.9)#12 | 3.1% (+13.1)#1,001 |
| 13. | Prudhoe Bay | 15.3% | 4.3% (+11.0)#13 | 3.1% (+12.2)#1,106 |
| 14. | Glennallen | 14.3% | 4.3% (+10.1)#14 | 3.1% (+11.3)#1,257 |
| 15. | Salcha | 13.5% | 4.3% (+9.28)#15 | 3.1% (+10.5)#1,428 |
| 16. | Moose Creek | 13.1% | 4.3% (+8.85)#16 | 3.1% (+10.0)#1,534 |
| 17. | Savoonga | 12.8% | 4.3% (+8.56)#17 | 3.1% (+9.75)#1,618 |
| 18. | Minto | 12.8% | 4.3% (+8.56)#18 | 3.1% (+9.75)#1,624 |
| 19. | Chenega | 12.0% | 4.3% (+7.74)#19 | 3.1% (+8.93)#1,833 |
| 20. | Valdez | 11.6% | 4.3% (+7.31)#20 | 3.1% (+8.50)#1,952 |
| 21. | Atka | 11.1% | 4.3% (+6.85)#21 | 3.1% (+8.04)#2,121 |
| 22. | Goodnews Bay | 10.9% | 4.3% (+6.61)#22 | 3.1% (+7.80)#2,190 |
| 23. | Brevig Mission | 10.6% | 4.3% (+6.33)#23 | 3.1% (+7.53)#2,290 |
| 24. | Nikolai | 10.5% | 4.3% (+6.26)#24 | 3.1% (+7.46)#2,323 |
| 25. | Farmers Loop | 10.0% | 4.3% (+5.76)#25 | 3.1% (+6.96)#2,534 |
| 26. | Kobuk | 9.7% | 4.3% (+5.42)#26 | 3.1% (+6.61)#2,749 |
| 27. | Mekoryuk | 9.3% | 4.3% (+5.08)#27 | 3.1% (+6.28)#2,926 |
| 28. | Seward | 9.2% | 4.3% (+4.91)#28 | 3.1% (+6.11)#3,017 |
| 29. | Butte | 9.0% | 4.3% (+4.72)#29 | 3.1% (+5.91)#3,132 |
| 30. | Cohoe | 8.9% | 4.3% (+4.63)#30 | 3.1% (+5.83)#3,187 |
| 31. | Alakanuk | 8.9% | 4.3% (+4.61)#31 | 3.1% (+5.80)#3,203 |
| 32. | Tununak | 8.8% | 4.3% (+4.50)#32 | 3.1% (+5.69)#3,291 |
| 33. | Toksook Bay | 8.6% | 4.3% (+4.32)#33 | 3.1% (+5.51)#3,432 |
| 34. | Big Delta | 8.2% | 4.3% (+3.93)#34 | 3.1% (+5.13)#3,767 |
| 35. | Mountain Village | 8.1% | 4.3% (+3.87)#35 | 3.1% (+5.07)#3,818 |
| 36. | Sutton Alpine | 7.7% | 4.3% (+3.47)#36 | 3.1% (+4.67)#4,157 |
| 37. | Sterling | 7.6% | 4.3% (+3.35)#37 | 3.1% (+4.55)#4,302 |
| 38. | Fishhook | 7.6% | 4.3% (+3.31)#38 | 3.1% (+4.50)#4,353 |
| 39. | False Pass | 7.5% | 4.3% (+3.28)#39 | 3.1% (+4.48)#4,379 |
| 40. | Eareckson Station | 7.5% | 4.3% (+3.22)#40 | 3.1% (+4.42)#4,451 |
| 41. | Anchor Point | 7.3% | 4.3% (+3.08)#41 | 3.1% (+4.27)#4,595 |
| 42. | Nenana | 7.3% | 4.3% (+3.07)#42 | 3.1% (+4.27)#4,599 |
| 43. | Houston | 7.2% | 4.3% (+2.94)#43 | 3.1% (+4.14)#4,769 |
| 44. | Knik Fairview | 7.2% | 4.3% (+2.94)#44 | 3.1% (+4.14)#4,770 |
| 45. | Tanaina | 7.2% | 4.3% (+2.92)#45 | 3.1% (+4.12)#4,781 |
| 46. | Chignik Lagoon | 7.1% | 4.3% (+2.88)#46 | 3.1% (+4.08)#4,841 |
| 47. | Kodiak Station | 7.0% | 4.3% (+2.72)#47 | 3.1% (+3.92)#5,018 |
| 48. | Kasaan | 6.8% | 4.3% (+2.56)#48 | 3.1% (+3.75)#5,239 |
| 49. | Akutan | 6.6% | 4.3% (+2.37)#49 | 3.1% (+3.57)#5,501 |
| 50. | Dry Creek | 6.6% | 4.3% (+2.35)#50 | 3.1% (+3.54)#5,534 |
| 51. | King Salmon | 6.6% | 4.3% (+2.34)#51 | 3.1% (+3.54)#5,540 |
| 52. | Unalaska | 6.5% | 4.3% (+2.24)#52 | 3.1% (+3.43)#5,696 |
| 53. | Larsen Bay | 6.5% | 4.3% (+2.19)#53 | 3.1% (+3.38)#5,773 |
| 54. | North Lakes | 6.4% | 4.3% (+2.11)#54 | 3.1% (+3.30)#5,866 |
| 55. | Happy Valley | 6.2% | 4.3% (+1.99)#55 | 3.1% (+3.18)#6,053 |
| 56. | Cantwell | 6.2% | 4.3% (+1.99)#56 | 3.1% (+3.18)#6,083 |
| 57. | Chickaloon | 6.2% | 4.3% (+1.89)#57 | 3.1% (+3.09)#6,212 |
| 58. | Big Lake | 6.1% | 4.3% (+1.82)#58 | 3.1% (+3.01)#6,329 |
| 59. | St Mary S | 6.1% | 4.3% (+1.80)#59 | 3.1% (+2.99)#6,361 |
| 60. | Wales | 6.1% | 4.3% (+1.80)#60 | 3.1% (+2.99)#6,369 |
| 61. | Nondalton | 5.9% | 4.3% (+1.62)#61 | 3.1% (+2.81)#6,682 |
| 62. | Wasilla | 5.8% | 4.3% (+1.54)#62 | 3.1% (+2.73)#6,806 |
| 63. | Port Alsworth | 5.8% | 4.3% (+1.51)#63 | 3.1% (+2.70)#6,868 |
| 64. | Gateway | 5.7% | 4.3% (+1.48)#64 | 3.1% (+2.68)#6,928 |
| 65. | Upper Kalskag | 5.7% | 4.3% (+1.45)#65 | 3.1% (+2.65)#6,965 |
| 66. | Healy | 5.7% | 4.3% (+1.44)#66 | 3.1% (+2.63)#6,994 |
| 67. | Point Hope | 5.6% | 4.3% (+1.33)#67 | 3.1% (+2.53)#7,205 |
| 68. | Noorvik | 5.6% | 4.3% (+1.29)#68 | 3.1% (+2.49)#7,274 |
| 69. | Noatak | 5.5% | 4.3% (+1.25)#69 | 3.1% (+2.44)#7,376 |
| 70. | Kaktovik | 5.4% | 4.3% (+1.14)#70 | 3.1% (+2.34)#7,590 |
| 71. | Lazy Mountain | 5.4% | 4.3% (+1.11)#71 | 3.1% (+2.31)#7,662 |
| 72. | Metlakatla | 5.3% | 4.3% (+1.05)#72 | 3.1% (+2.25)#7,780 |
| 73. | Goldstream | 5.2% | 4.3% (+0.987)#73 | 3.1% (+2.18)#7,919 |
| 74. | Nome | 5.2% | 4.3% (+0.918)#74 | 3.1% (+2.11)#8,050 |
| 75. | Meadow Lakes | 5.1% | 4.3% (+0.862)#75 | 3.1% (+2.06)#8,174 |
| 76. | Fort Yukon | 5.1% | 4.3% (+0.833)#76 | 3.1% (+2.03)#8,223 |
| 77. | Twin Hills | 5.0% | 4.3% (+0.738)#77 | 3.1% (+1.93)#8,477 |
| 78. | Badger | 4.9% | 4.3% (+0.625)#78 | 3.1% (+1.82)#8,733 |
| 79. | Venetie | 4.9% | 4.3% (+0.616)#79 | 3.1% (+1.81)#8,767 |
| 80. | Point Lay | 4.8% | 4.3% (+0.576)#80 | 3.1% (+1.77)#8,858 |
| 81. | Cordova | 4.8% | 4.3% (+0.561)#81 | 3.1% (+1.76)#8,890 |
| 82. | Quinhagak | 4.7% | 4.3% (+0.407)#82 | 3.1% (+1.60)#9,280 |
| 83. | Kiana | 4.6% | 4.3% (+0.367)#83 | 3.1% (+1.56)#9,378 |
| 84. | Mill Bay | 4.6% | 4.3% (+0.354)#84 | 3.1% (+1.55)#9,403 |
| 85. | Trapper Creek | 4.6% | 4.3% (+0.353)#85 | 3.1% (+1.55)#9,410 |
| 86. | Juneau City And Borough | 4.6% | 4.3% (+0.308)#86 | 3.1% (+1.50)#9,534 |
| 87. | St Paul | 4.5% | 4.3% (+0.249)#87 | 3.1% (+1.44)#9,721 |
| 88. | Hydaburg | 4.4% | 4.3% (+0.182)#88 | 3.1% (+1.38)#9,901 |
| 89. | Kokhanok | 4.4% | 4.3% (+0.182)#89 | 3.1% (+1.38)#9,908 |
| 90. | Ambler | 4.3% | 4.3% (+0.086)#90 | 3.1% (+1.28)#10,170 |
| 91. | Ouzinkie | 4.3% | 4.3% (+0.086)#91 | 3.1% (+1.28)#10,182 |
| 92. | Tanana | 4.3% | 4.3% (+0.039)#92 | 3.1% (+1.23)#10,305 |
| 93. | White Mountain | 4.3% | 4.3% (+0.023)#93 | 3.1% (+1.22)#10,354 |
| 94. | Anderson | 4.3% | 4.3% (-0.007)#94 | 3.1% (+1.19)#10,434 |
| 95. | Kalifornsky | 4.2% | 4.3% (-0.033)#95 | 3.1% (+1.16)#10,508 |
| 96. | Allakaket | 4.2% | 4.3% (-0.096)#96 | 3.1% (+1.10)#10,691 |
| 97. | Willow | 4.2% | 4.3% (-0.109)#97 | 3.1% (+1.09)#10,730 |
| 98. | Salamatof | 4.2% | 4.3% (-0.110)#98 | 3.1% (+1.08)#10,733 |
| 99. | Delta Junction | 4.1% | 4.3% (-0.189)#99 | 3.1% (+1.01)#10,977 |
| 100. | Wainwright | 4.0% | 4.3% (-0.222)#100 | 3.1% (+0.973)#11,086 |
Common Questions
What are the Top 10 Cities with the Highest Percentage of Population Employed in Installation, Maintenance & Repair in Alaska?
Top 10 Cities with the Highest Percentage of Population Employed in Installation, Maintenance & Repair in Alaska are:
#1
40.0%
#2
34.2%
#3
29.8%
#4
25.0%
#5
22.9%
#6
22.2%
#7
21.7%
#8
18.8%
#9
18.1%
#10
17.4%
What city has the Highest Percentage of Population Employed in Installation, Maintenance & Repair in Alaska?
Russian Mission has the Highest Percentage of Population Employed in Installation, Maintenance & Repair in Alaska with 40.0%.
What is the Percentage of Population Employed in Installation, Maintenance & Repair in the State of Alaska?
Percentage of Population Employed in Installation, Maintenance & Repair in Alaska is 4.3%.
What is the Percentage of Population Employed in Installation, Maintenance & Repair in the United States?
Percentage of Population Employed in Installation, Maintenance & Repair in the United States is 3.1%.