Cities with the Highest Percentage of Population with a Degree in Computers and Mathematics in California
RELATED REPORTS & OPTIONS
Computers and Mathematics
California
Compare Cities
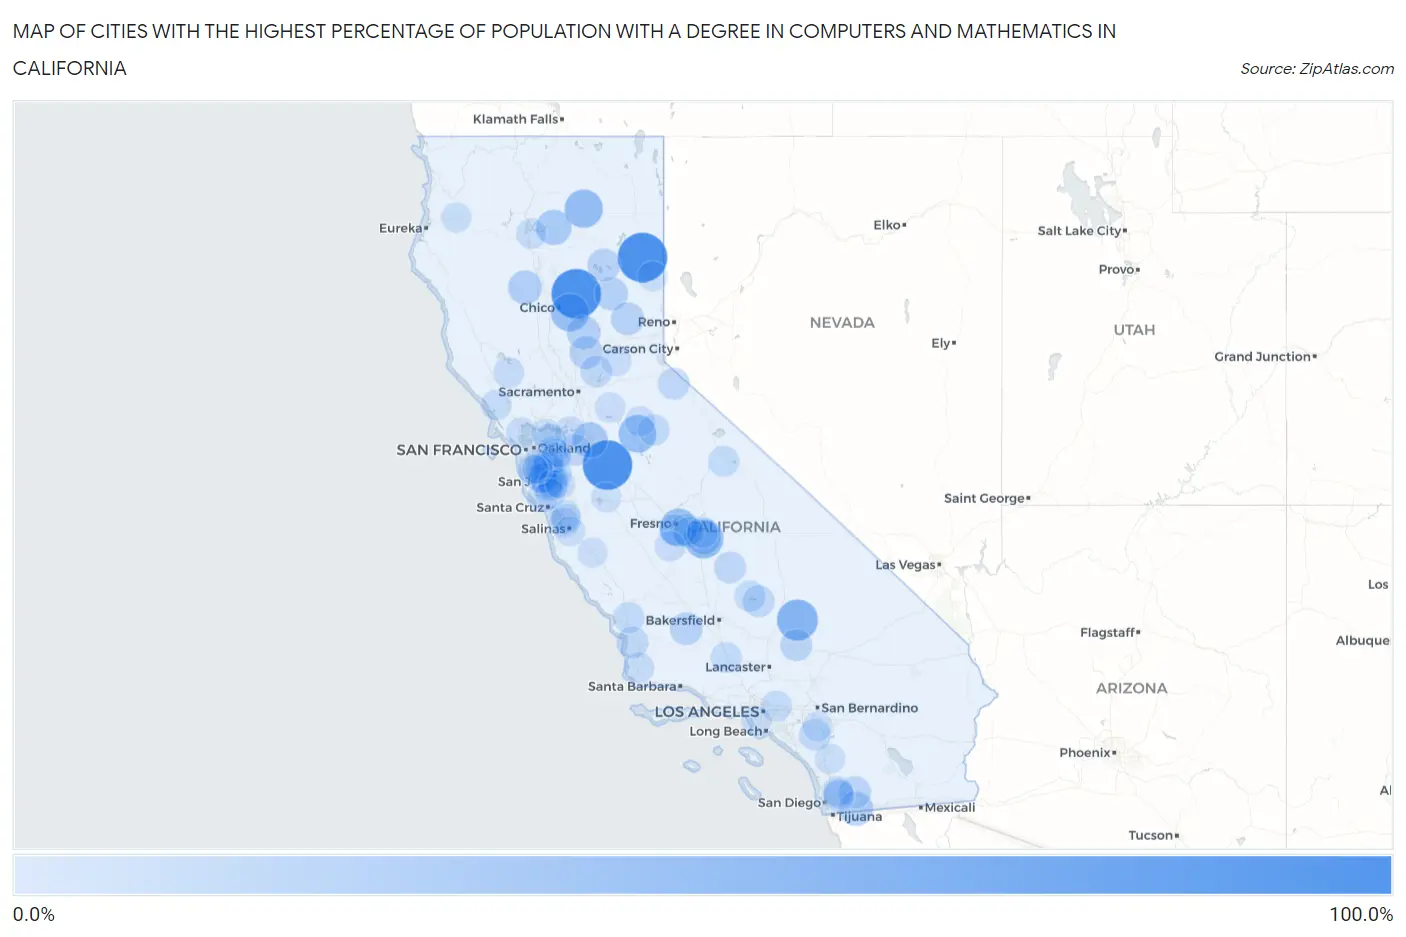
Map of Cities with the Highest Percentage of Population with a Degree in Computers and Mathematics in California
0.0%
100.0%
Cities with the Highest Percentage of Population with a Degree in Computers and Mathematics in California
| City | % Graduates | vs State | vs National | |
| 1. | Stirling City | 100.0% | 5.8%(+94.2)#1 | 4.9%(+95.1)#6 |
| 2. | Cowan | 100.0% | 5.8%(+94.2)#2 | 4.9%(+95.1)#15 |
| 3. | Litchfield | 100.0% | 5.8%(+94.2)#3 | 4.9%(+95.1)#22 |
| 4. | Yermo | 60.9% | 5.8%(+55.1)#4 | 4.9%(+56.0)#68 |
| 5. | Casa Loma | 59.3% | 5.8%(+53.4)#5 | 4.9%(+54.4)#75 |
| 6. | Johannesburg | 58.8% | 5.8%(+53.0)#6 | 4.9%(+53.9)#77 |
| 7. | Cutler | 51.7% | 5.8%(+45.9)#7 | 4.9%(+46.8)#96 |
| 8. | Mcarthur | 47.1% | 5.8%(+41.2)#8 | 4.9%(+42.2)#127 |
| 9. | Butte Valley | 45.5% | 5.8%(+39.7)#9 | 4.9%(+40.6)#132 |
| 10. | Malaga | 44.4% | 5.8%(+38.6)#10 | 4.9%(+39.6)#137 |
| 11. | Tuttletown | 44.3% | 5.8%(+38.5)#11 | 4.9%(+39.4)#139 |
| 12. | Taft Mosswood | 34.4% | 5.8%(+28.6)#12 | 4.9%(+29.5)#224 |
| 13. | Round Mountain | 33.3% | 5.8%(+27.5)#13 | 4.9%(+28.4)#249 |
| 14. | Orosi | 28.2% | 5.8%(+22.4)#14 | 4.9%(+23.3)#320 |
| 15. | Potrero | 28.1% | 5.8%(+22.3)#15 | 4.9%(+23.2)#324 |
| 16. | Rancho Tehama Reserve | 27.6% | 5.8%(+21.8)#16 | 4.9%(+22.7)#341 |
| 17. | Bangor | 25.0% | 5.8%(+19.2)#17 | 4.9%(+20.1)#407 |
| 18. | East Quincy | 24.6% | 5.8%(+18.8)#18 | 4.9%(+19.7)#434 |
| 19. | Sierra City | 23.7% | 5.8%(+17.9)#19 | 4.9%(+18.8)#459 |
| 20. | Beale Afb | 23.4% | 5.8%(+17.6)#20 | 4.9%(+18.5)#464 |
| 21. | Bear Valley Cdp Alpine County | 22.8% | 5.8%(+17.0)#21 | 4.9%(+17.9)#490 |
| 22. | Derby Acres | 22.2% | 5.8%(+16.4)#22 | 4.9%(+17.3)#506 |
| 23. | Clear Creek | 22.2% | 5.8%(+16.4)#23 | 4.9%(+17.3)#509 |
| 24. | Cold Springs Cdp El Dorado County | 21.8% | 5.8%(+16.0)#24 | 4.9%(+16.9)#524 |
| 25. | Del Rey | 21.1% | 5.8%(+15.2)#25 | 4.9%(+16.2)#554 |
| 26. | Descanso | 19.6% | 5.8%(+13.8)#26 | 4.9%(+14.7)#641 |
| 27. | Fremont | 19.1% | 5.8%(+13.2)#27 | 4.9%(+14.2)#669 |
| 28. | Boron | 18.6% | 5.8%(+12.8)#28 | 4.9%(+13.7)#699 |
| 29. | Sunnyvale | 18.4% | 5.8%(+12.6)#29 | 4.9%(+13.5)#722 |
| 30. | Penryn | 17.8% | 5.8%(+12.0)#30 | 4.9%(+12.9)#766 |
| 31. | Weldon | 17.8% | 5.8%(+12.0)#31 | 4.9%(+12.9)#768 |
| 32. | Springville | 17.5% | 5.8%(+11.7)#32 | 4.9%(+12.6)#788 |
| 33. | Mountain House | 17.5% | 5.8%(+11.7)#33 | 4.9%(+12.6)#795 |
| 34. | Warm Springs | 17.3% | 5.8%(+11.5)#34 | 4.9%(+12.4)#805 |
| 35. | Markleeville | 17.2% | 5.8%(+11.4)#35 | 4.9%(+12.3)#809 |
| 36. | North Gate | 17.2% | 5.8%(+11.3)#36 | 4.9%(+12.3)#814 |
| 37. | Santa Clara | 17.1% | 5.8%(+11.3)#37 | 4.9%(+12.2)#821 |
| 38. | Blacklake | 17.1% | 5.8%(+11.3)#38 | 4.9%(+12.2)#824 |
| 39. | Whitmore | 17.0% | 5.8%(+11.2)#39 | 4.9%(+12.1)#834 |
| 40. | Mountain View | 16.9% | 5.8%(+11.1)#40 | 4.9%(+12.0)#838 |
| 41. | Cupertino | 16.5% | 5.8%(+10.7)#41 | 4.9%(+11.6)#882 |
| 42. | Easton | 15.6% | 5.8%(+9.79)#42 | 4.9%(+10.7)#975 |
| 43. | East Palo Alto | 15.6% | 5.8%(+9.75)#43 | 4.9%(+10.7)#977 |
| 44. | Mi Wuk Village | 15.5% | 5.8%(+9.70)#44 | 4.9%(+10.6)#982 |
| 45. | Mammoth Lakes | 15.2% | 5.8%(+9.43)#45 | 4.9%(+10.3)#1,013 |
| 46. | Wofford Heights | 15.2% | 5.8%(+9.40)#46 | 4.9%(+10.3)#1,016 |
| 47. | Parlier | 15.1% | 5.8%(+9.29)#47 | 4.9%(+10.2)#1,034 |
| 48. | Mayflower Village | 15.1% | 5.8%(+9.27)#48 | 4.9%(+10.2)#1,036 |
| 49. | Garden Farms | 15.0% | 5.8%(+9.19)#49 | 4.9%(+10.1)#1,045 |
| 50. | San Ramon | 14.5% | 5.8%(+8.67)#50 | 4.9%(+9.59)#1,088 |
| 51. | Dublin | 14.4% | 5.8%(+8.61)#51 | 4.9%(+9.53)#1,096 |
| 52. | Orange Cove | 14.4% | 5.8%(+8.60)#52 | 4.9%(+9.52)#1,098 |
| 53. | Granite Hills | 14.4% | 5.8%(+8.59)#53 | 4.9%(+9.51)#1,100 |
| 54. | Lebec | 14.2% | 5.8%(+8.43)#54 | 4.9%(+9.35)#1,140 |
| 55. | Milpitas | 14.2% | 5.8%(+8.38)#55 | 4.9%(+9.30)#1,143 |
| 56. | Highlands | 13.9% | 5.8%(+8.11)#56 | 4.9%(+9.03)#1,171 |
| 57. | Newark | 13.6% | 5.8%(+7.79)#57 | 4.9%(+8.71)#1,223 |
| 58. | Las Lomas | 13.5% | 5.8%(+7.65)#58 | 4.9%(+8.57)#1,246 |
| 59. | Cobb | 13.2% | 5.8%(+7.42)#59 | 4.9%(+8.34)#1,288 |
| 60. | California Polytechnic State University | 13.2% | 5.8%(+7.34)#60 | 4.9%(+8.26)#1,304 |
| 61. | Mission Hills | 13.1% | 5.8%(+7.26)#61 | 4.9%(+8.18)#1,323 |
| 62. | Union City | 13.0% | 5.8%(+7.23)#62 | 4.9%(+8.15)#1,325 |
| 63. | Brookdale | 13.0% | 5.8%(+7.22)#63 | 4.9%(+8.14)#1,334 |
| 64. | Saratoga | 12.9% | 5.8%(+7.13)#64 | 4.9%(+8.05)#1,350 |
| 65. | Los Altos | 12.8% | 5.8%(+7.01)#65 | 4.9%(+7.93)#1,371 |
| 66. | Eucalyptus Hills | 12.8% | 5.8%(+6.98)#66 | 4.9%(+7.90)#1,375 |
| 67. | Palo Alto | 12.7% | 5.8%(+6.89)#67 | 4.9%(+7.81)#1,388 |
| 68. | Occidental | 12.6% | 5.8%(+6.75)#68 | 4.9%(+7.67)#1,411 |
| 69. | Winter Gardens | 12.3% | 5.8%(+6.46)#69 | 4.9%(+7.38)#1,477 |
| 70. | Riverdale | 12.3% | 5.8%(+6.45)#70 | 4.9%(+7.37)#1,479 |
| 71. | Fruitdale | 12.3% | 5.8%(+6.45)#71 | 4.9%(+7.37)#1,480 |
| 72. | Foster City | 12.1% | 5.8%(+6.33)#72 | 4.9%(+7.25)#1,498 |
| 73. | Ione | 12.1% | 5.8%(+6.32)#73 | 4.9%(+7.24)#1,500 |
| 74. | Mountain Gate | 12.1% | 5.8%(+6.31)#74 | 4.9%(+7.23)#1,505 |
| 75. | Pleasanton | 12.1% | 5.8%(+6.30)#75 | 4.9%(+7.22)#1,507 |
| 76. | Santa Venetia | 12.0% | 5.8%(+6.18)#76 | 4.9%(+7.10)#1,531 |
| 77. | Somis | 11.8% | 5.8%(+6.03)#77 | 4.9%(+6.95)#1,558 |
| 78. | Belmont | 11.8% | 5.8%(+6.03)#78 | 4.9%(+6.95)#1,561 |
| 79. | Foresthill | 11.7% | 5.8%(+5.85)#79 | 4.9%(+6.77)#1,610 |
| 80. | Forest Meadows | 11.5% | 5.8%(+5.72)#80 | 4.9%(+6.64)#1,644 |
| 81. | Campbell | 11.4% | 5.8%(+5.59)#81 | 4.9%(+6.51)#1,672 |
| 82. | Willow Creek | 11.1% | 5.8%(+5.25)#82 | 4.9%(+6.17)#1,777 |
| 83. | Bethel Island | 11.0% | 5.8%(+5.14)#83 | 4.9%(+6.06)#1,802 |
| 84. | Pacheco | 10.9% | 5.8%(+5.06)#84 | 4.9%(+5.98)#1,828 |
| 85. | Lexington Hills | 10.9% | 5.8%(+5.06)#85 | 4.9%(+5.98)#1,829 |
| 86. | Mead Valley | 10.8% | 5.8%(+4.96)#86 | 4.9%(+5.88)#1,849 |
| 87. | Pala | 10.7% | 5.8%(+4.90)#87 | 4.9%(+5.82)#1,868 |
| 88. | San Jose | 10.7% | 5.8%(+4.90)#88 | 4.9%(+5.82)#1,873 |
| 89. | Santa Nella | 10.7% | 5.8%(+4.88)#89 | 4.9%(+5.80)#1,876 |
| 90. | Patton Village | 10.7% | 5.8%(+4.86)#90 | 4.9%(+5.78)#1,883 |
| 91. | Spring Valley Cdp Lake County | 10.7% | 5.8%(+4.85)#91 | 4.9%(+5.77)#1,888 |
| 92. | Meyers | 10.6% | 5.8%(+4.80)#92 | 4.9%(+5.72)#1,905 |
| 93. | Castroville | 10.6% | 5.8%(+4.74)#93 | 4.9%(+5.66)#1,928 |
| 94. | Modjeska | 10.5% | 5.8%(+4.71)#94 | 4.9%(+5.63)#1,935 |
| 95. | San Carlos | 10.5% | 5.8%(+4.70)#95 | 4.9%(+5.62)#1,952 |
| 96. | Greenfield | 10.5% | 5.8%(+4.67)#96 | 4.9%(+5.59)#1,958 |
| 97. | Del Aire | 10.3% | 5.8%(+4.51)#97 | 4.9%(+5.43)#2,013 |
| 98. | Elkhorn | 10.2% | 5.8%(+4.42)#98 | 4.9%(+5.34)#2,043 |
| 99. | Spreckels | 10.2% | 5.8%(+4.39)#99 | 4.9%(+5.31)#2,056 |
| 100. | Redwood City | 10.2% | 5.8%(+4.38)#100 | 4.9%(+5.30)#2,058 |
Common Questions
What are the Top 10 Cities with the Highest Percentage of Population with a Degree in Computers and Mathematics in California?
Top 10 Cities with the Highest Percentage of Population with a Degree in Computers and Mathematics in California are:
#1
100.0%
#2
100.0%
#3
100.0%
#4
58.8%
#5
51.7%
#6
47.1%
#7
45.5%
#8
44.4%
#9
44.3%
#10
34.4%
What city has the Highest Percentage of Population with a Degree in Computers and Mathematics in California?
Stirling City has the Highest Percentage of Population with a Degree in Computers and Mathematics in California with 100.0%.
What is the Percentage of Population with a Degree in Computers and Mathematics in the State of California?
Percentage of Population with a Degree in Computers and Mathematics in California is 5.8%.
What is the Percentage of Population with a Degree in Computers and Mathematics in the United States?
Percentage of Population with a Degree in Computers and Mathematics in the United States is 4.9%.