Patton Village, CA Map & Demographics
Patton Village Map
Patton Village Overview
$19,360
PER CAPITA INCOME
$46,311
AVG HOUSEHOLD INCOME
0.45
INEQUALITY / GINI INDEX
792
TOTAL POPULATION
524
MALE POPULATION
268
FEMALE POPULATION
195.52
MALES / 100 FEMALES
51.15
FEMALES / 100 MALES
45.7
MEDIAN AGE
3.0
AVG FAMILY SIZE
3.2
AVG HOUSEHOLD SIZE
241
LABOR FORCE [ PEOPLE ]
33.1%
PERCENT IN LABOR FORCE
24.1%
UNEMPLOYMENT RATE
Income in Patton Village
Income Overview in Patton Village
| Characteristic | Number | Measure |
| Per Capita Income | 792 | $19,360 |
| Median Family Income | 159 | $0 |
| Mean Family Income | 159 | $52,663 |
| Median Household Income | 244 | $46,311 |
| Mean Household Income | 244 | $53,282 |
| Income Deficit | 159 | $0 |
| Wage / Income Gap (%) | 792 | 0.00% |
| Wage / Income Gap ($) | 792 | 100.00¢ per $1 |
| Gini / Inequality Index | 792 | 0.45 |
Earnings by Sex in Patton Village
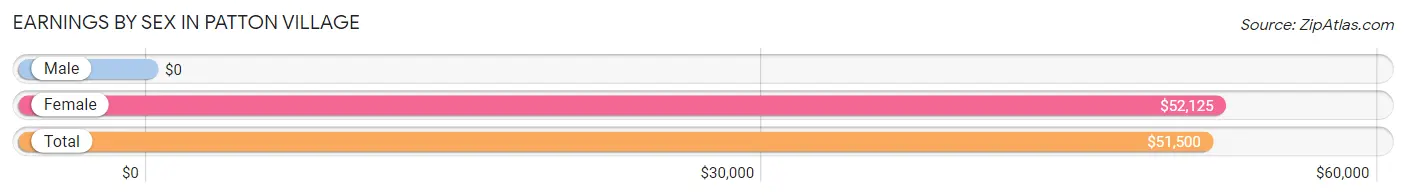
| Sex | Number | Average Earnings |
| Male | 144 (75.0%) | $0 |
| Female | 48 (25.0%) | $52,125 |
| Total | 192 (100.0%) | $51,500 |
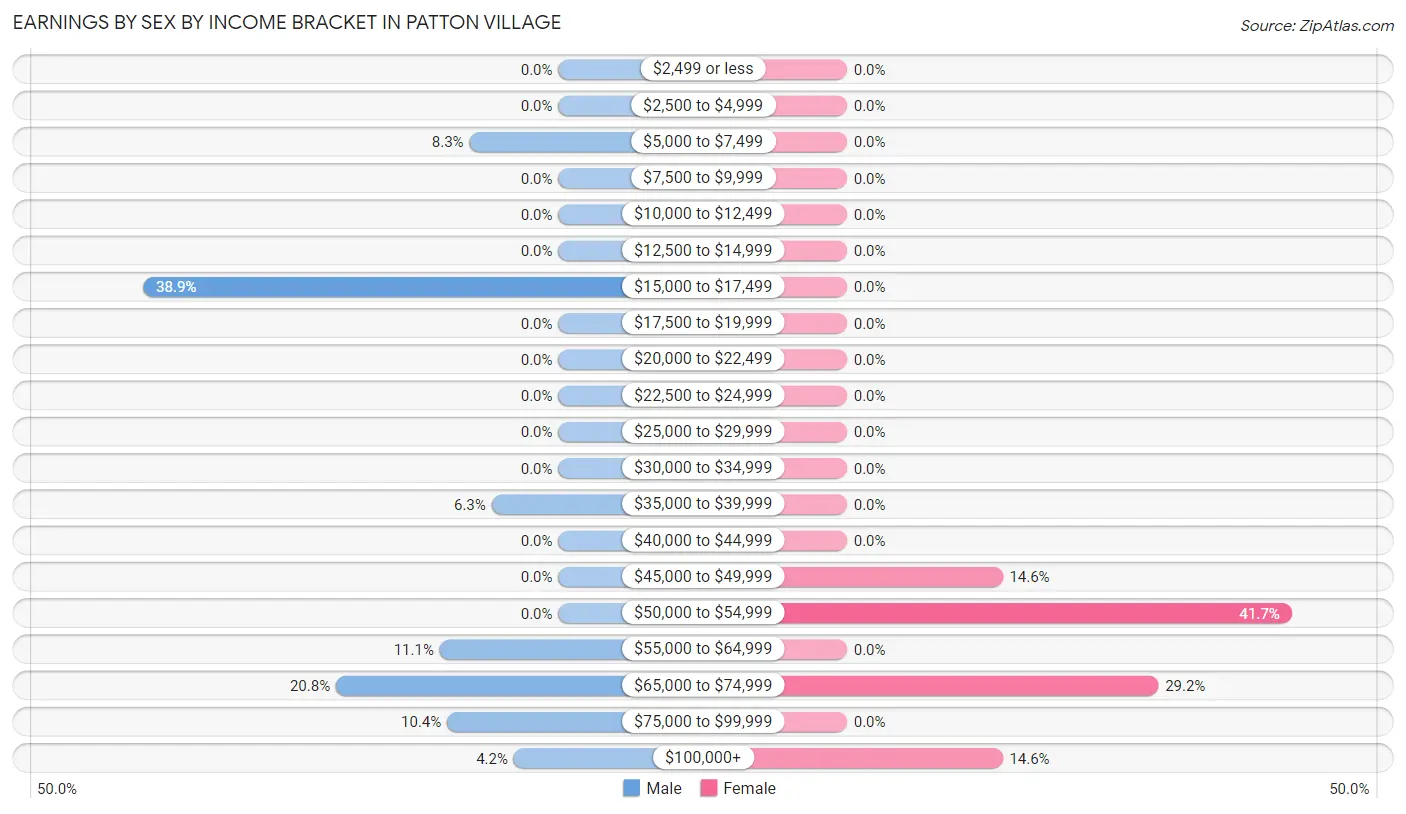
Earnings by Sex by Income Bracket in Patton Village
The most common earnings brackets in Patton Village are $15,000 to $17,499 for men (56 | 38.9%) and $50,000 to $54,999 for women (20 | 41.7%).
| Income | Male | Female |
| $2,499 or less | 0 (0.0%) | 0 (0.0%) |
| $2,500 to $4,999 | 0 (0.0%) | 0 (0.0%) |
| $5,000 to $7,499 | 12 (8.3%) | 0 (0.0%) |
| $7,500 to $9,999 | 0 (0.0%) | 0 (0.0%) |
| $10,000 to $12,499 | 0 (0.0%) | 0 (0.0%) |
| $12,500 to $14,999 | 0 (0.0%) | 0 (0.0%) |
| $15,000 to $17,499 | 56 (38.9%) | 0 (0.0%) |
| $17,500 to $19,999 | 0 (0.0%) | 0 (0.0%) |
| $20,000 to $22,499 | 0 (0.0%) | 0 (0.0%) |
| $22,500 to $24,999 | 0 (0.0%) | 0 (0.0%) |
| $25,000 to $29,999 | 0 (0.0%) | 0 (0.0%) |
| $30,000 to $34,999 | 0 (0.0%) | 0 (0.0%) |
| $35,000 to $39,999 | 9 (6.2%) | 0 (0.0%) |
| $40,000 to $44,999 | 0 (0.0%) | 0 (0.0%) |
| $45,000 to $49,999 | 0 (0.0%) | 7 (14.6%) |
| $50,000 to $54,999 | 0 (0.0%) | 20 (41.7%) |
| $55,000 to $64,999 | 16 (11.1%) | 0 (0.0%) |
| $65,000 to $74,999 | 30 (20.8%) | 14 (29.2%) |
| $75,000 to $99,999 | 15 (10.4%) | 0 (0.0%) |
| $100,000+ | 6 (4.2%) | 7 (14.6%) |
| Total | 144 (100.0%) | 48 (100.0%) |
Earnings by Sex by Educational Attainment in Patton Village
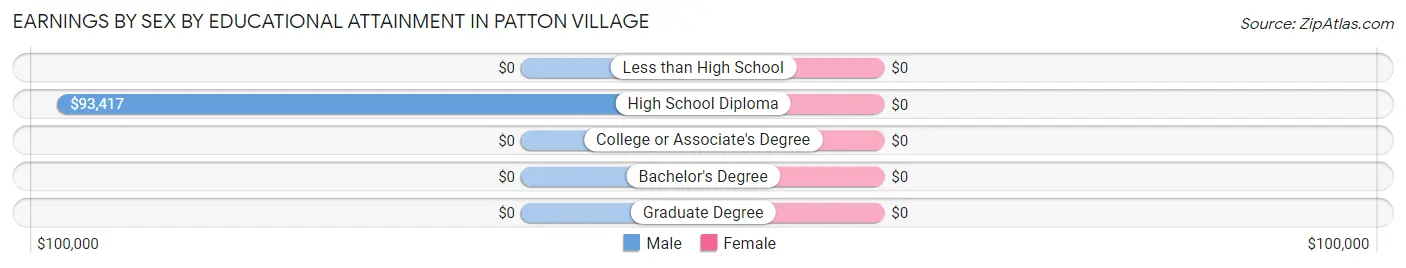
| Educational Attainment | Male Income | Female Income |
| Less than High School | - | - |
| High School Diploma | $93,417 | $0 |
| College or Associate's Degree | - | - |
| Bachelor's Degree | - | - |
| Graduate Degree | - | - |
| Total | - | - |
Family Income in Patton Village
Family Income Brackets in Patton Village
According to the Patton Village family income data, there are 55 families falling into the less than $10,000 income range, which is the most common income bracket and makes up 34.6% of all families.
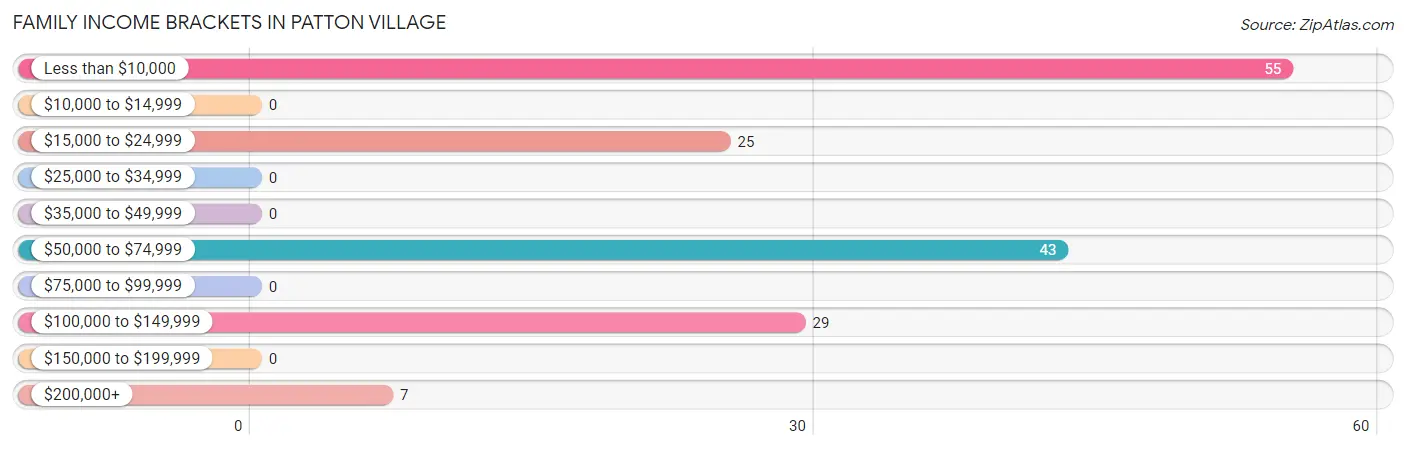
| Income Bracket | # Families | % Families |
| Less than $10,000 | 55 | 34.6% |
| $10,000 to $14,999 | 0 | 0.0% |
| $15,000 to $24,999 | 25 | 15.7% |
| $25,000 to $34,999 | 0 | 0.0% |
| $35,000 to $49,999 | 0 | 0.0% |
| $50,000 to $74,999 | 43 | 27.0% |
| $75,000 to $99,999 | 0 | 0.0% |
| $100,000 to $149,999 | 29 | 18.2% |
| $150,000 to $199,999 | 0 | 0.0% |
| $200,000+ | 7 | 4.4% |
Family Income by Famaliy Size in Patton Village
| Income Bracket | # Families | Median Income |
| 2-Person Families | 120 (75.5%) | $0 |
| 3-Person Families | 19 (11.9%) | $0 |
| 4-Person Families | 20 (12.6%) | $0 |
| 5-Person Families | 0 (0.0%) | $0 |
| 6-Person Families | 0 (0.0%) | $0 |
| 7+ Person Families | 0 (0.0%) | $0 |
| Total | 159 (100.0%) | $0 |
Family Income by Number of Earners in Patton Village
| Number of Earners | # Families | Median Income |
| No Earners | 74 (46.5%) | $0 |
| 1 Earner | 71 (44.7%) | $0 |
| 2 Earners | 14 (8.8%) | $0 |
| 3+ Earners | 0 (0.0%) | $0 |
| Total | 159 (100.0%) | $0 |
Household Income in Patton Village
Household Income Brackets in Patton Village
With 71 households falling in the category, the $35,000 to $49,999 income range is the most frequent in Patton Village, accounting for 29.1% of all households.
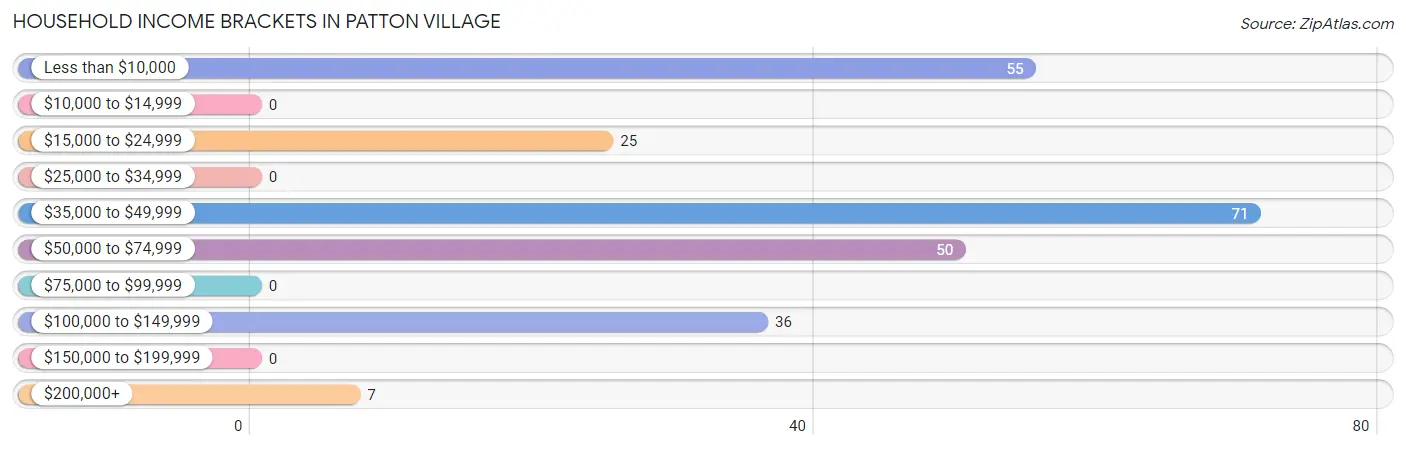
| Income Bracket | # Households | % Households |
| Less than $10,000 | 55 | 22.5% |
| $10,000 to $14,999 | 0 | 0.0% |
| $15,000 to $24,999 | 25 | 10.2% |
| $25,000 to $34,999 | 0 | 0.0% |
| $35,000 to $49,999 | 71 | 29.1% |
| $50,000 to $74,999 | 50 | 20.5% |
| $75,000 to $99,999 | 0 | 0.0% |
| $100,000 to $149,999 | 36 | 14.8% |
| $150,000 to $199,999 | 0 | 0.0% |
| $200,000+ | 7 | 2.9% |
Household Income by Householder Age in Patton Village
The median household income in Patton Village is $46,311, with the highest median household income of $51,063 found in the 25 to 44 years age bracket for the primary householder. A total of 55 households (22.5%) fall into this category.
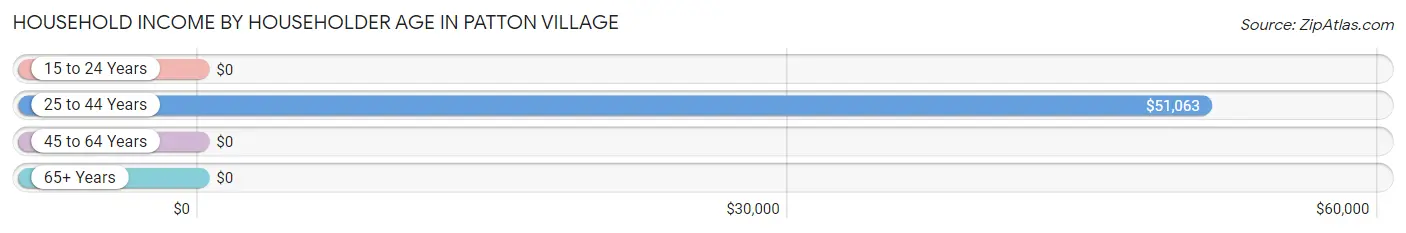
| Income Bracket | # Households | Median Income |
| 15 to 24 Years | 0 (0.0%) | $0 |
| 25 to 44 Years | 55 (22.5%) | $51,063 |
| 45 to 64 Years | 118 (48.4%) | $0 |
| 65+ Years | 71 (29.1%) | $0 |
| Total | 244 (100.0%) | $46,311 |
Poverty in Patton Village
Income Below Poverty by Sex and Age in Patton Village
With 51.3% poverty level for males and 40.3% for females among the residents of Patton Village, 12 to 14 year old males and 6 to 11 year old females are the most vulnerable to poverty, with 22 males (100.0%) and 26 females (100.0%) in their respective age groups living below the poverty level.
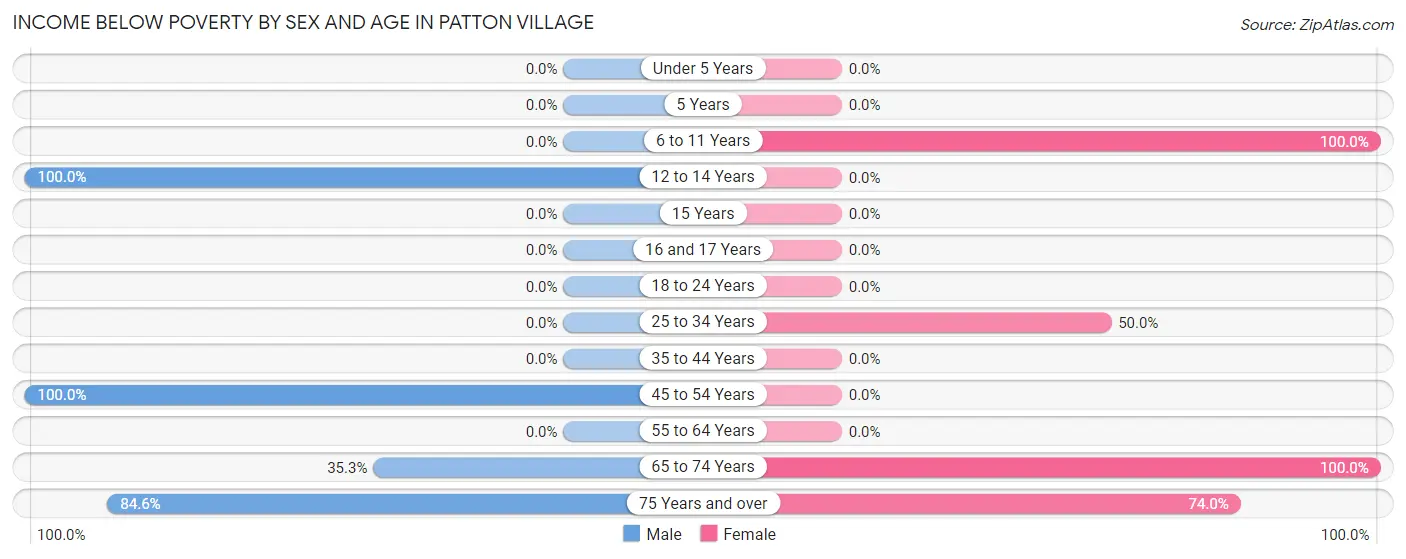
| Age Bracket | Male | Female |
| Under 5 Years | 0 (0.0%) | 0 (0.0%) |
| 5 Years | 0 (0.0%) | 0 (0.0%) |
| 6 to 11 Years | 0 (0.0%) | 26 (100.0%) |
| 12 to 14 Years | 22 (100.0%) | 0 (0.0%) |
| 15 Years | 0 (0.0%) | 0 (0.0%) |
| 16 and 17 Years | 0 (0.0%) | 0 (0.0%) |
| 18 to 24 Years | 0 (0.0%) | 0 (0.0%) |
| 25 to 34 Years | 0 (0.0%) | 19 (50.0%) |
| 35 to 44 Years | 0 (0.0%) | 0 (0.0%) |
| 45 to 54 Years | 180 (100.0%) | 0 (0.0%) |
| 55 to 64 Years | 0 (0.0%) | 0 (0.0%) |
| 65 to 74 Years | 12 (35.3%) | 6 (100.0%) |
| 75 Years and over | 55 (84.6%) | 57 (74.0%) |
| Total | 269 (51.3%) | 108 (40.3%) |
Income Above Poverty by Sex and Age in Patton Village
According to the poverty statistics in Patton Village, males aged 5 years and females aged 35 to 44 years are the age groups that are most secure financially, with 100.0% of males and 100.0% of females in these age groups living above the poverty line.
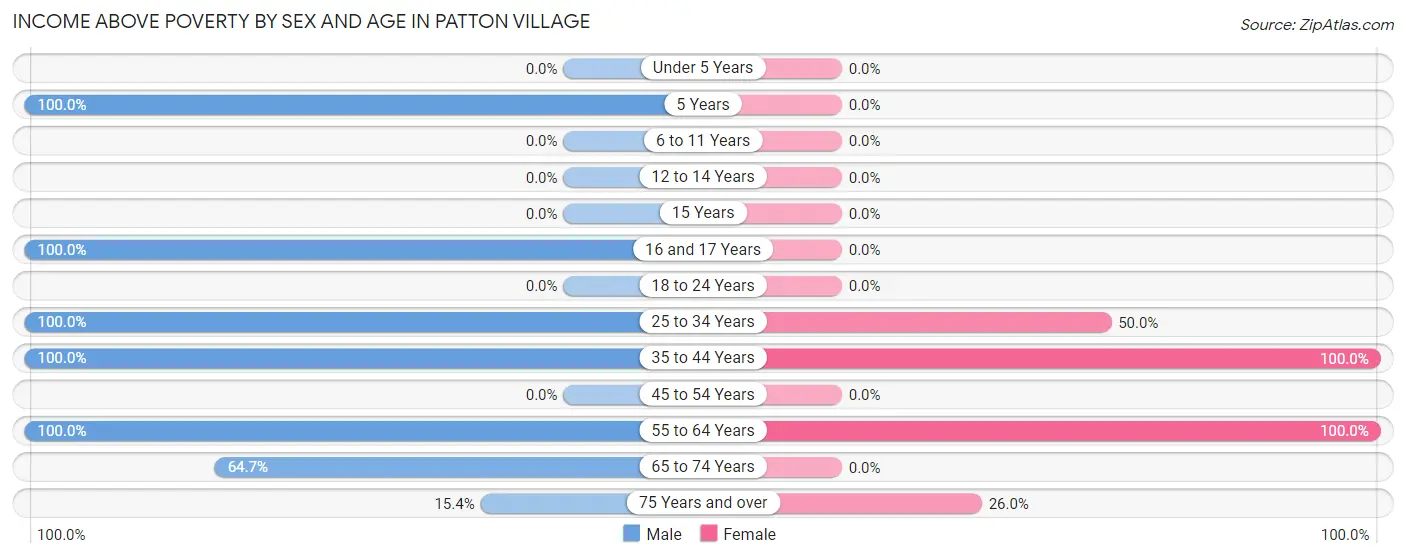
| Age Bracket | Male | Female |
| Under 5 Years | 0 (0.0%) | 0 (0.0%) |
| 5 Years | 15 (100.0%) | 0 (0.0%) |
| 6 to 11 Years | 0 (0.0%) | 0 (0.0%) |
| 12 to 14 Years | 0 (0.0%) | 0 (0.0%) |
| 15 Years | 0 (0.0%) | 0 (0.0%) |
| 16 and 17 Years | 18 (100.0%) | 0 (0.0%) |
| 18 to 24 Years | 0 (0.0%) | 0 (0.0%) |
| 25 to 34 Years | 72 (100.0%) | 19 (50.0%) |
| 35 to 44 Years | 58 (100.0%) | 20 (100.0%) |
| 45 to 54 Years | 0 (0.0%) | 0 (0.0%) |
| 55 to 64 Years | 60 (100.0%) | 101 (100.0%) |
| 65 to 74 Years | 22 (64.7%) | 0 (0.0%) |
| 75 Years and over | 10 (15.4%) | 20 (26.0%) |
| Total | 255 (48.7%) | 160 (59.7%) |
Income Below Poverty Among Married-Couple Families in Patton Village
The poverty statistics for married-couple families in Patton Village show that 51.7% or 61 of the total 118 families live below the poverty line. Families with no children have the highest poverty rate of 62.2%, comprising of 61 families. On the other hand, families with 1 or 2 children have the lowest poverty rate of 0.0%, which includes 0 families.
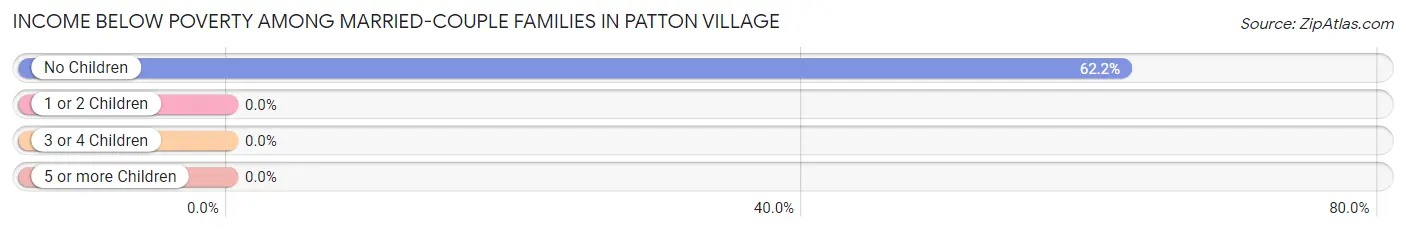
| Children | Above Poverty | Below Poverty |
| No Children | 37 (37.8%) | 61 (62.2%) |
| 1 or 2 Children | 20 (100.0%) | 0 (0.0%) |
| 3 or 4 Children | 0 (0.0%) | 0 (0.0%) |
| 5 or more Children | 0 (0.0%) | 0 (0.0%) |
| Total | 57 (48.3%) | 61 (51.7%) |
Income Below Poverty Among Single-Parent Households in Patton Village
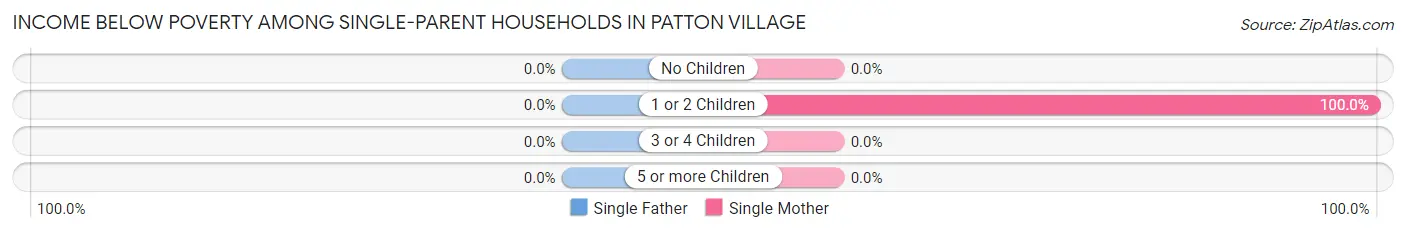
| Children | Single Father | Single Mother |
| No Children | 0 (0.0%) | 0 (0.0%) |
| 1 or 2 Children | 0 (0.0%) | 19 (100.0%) |
| 3 or 4 Children | 0 (0.0%) | 0 (0.0%) |
| 5 or more Children | 0 (0.0%) | 0 (0.0%) |
| Total | 0 (0.0%) | 19 (73.1%) |
Income Below Poverty Among Married-Couple vs Single-Parent Households in Patton Village
The poverty data for Patton Village shows that 61 of the married-couple family households (51.7%) and 19 of the single-parent households (46.3%) are living below the poverty level. Within the married-couple family households, those with no children have the highest poverty rate, with 61 households (62.2%) falling below the poverty line. Among the single-parent households, those with 1 or 2 children have the highest poverty rate, with 19 household (100.0%) living below poverty.
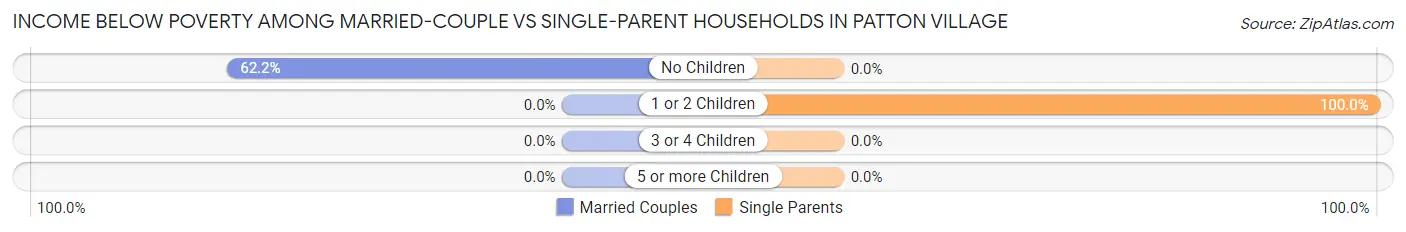
| Children | Married-Couple Families | Single-Parent Households |
| No Children | 61 (62.2%) | 0 (0.0%) |
| 1 or 2 Children | 0 (0.0%) | 19 (100.0%) |
| 3 or 4 Children | 0 (0.0%) | 0 (0.0%) |
| 5 or more Children | 0 (0.0%) | 0 (0.0%) |
| Total | 61 (51.7%) | 19 (46.3%) |
Race in Patton Village
The most populous races in Patton Village are White / Caucasian (523 | 66.0%), Black / African American (170 | 21.5%), and Two or more Races (99 | 12.5%).
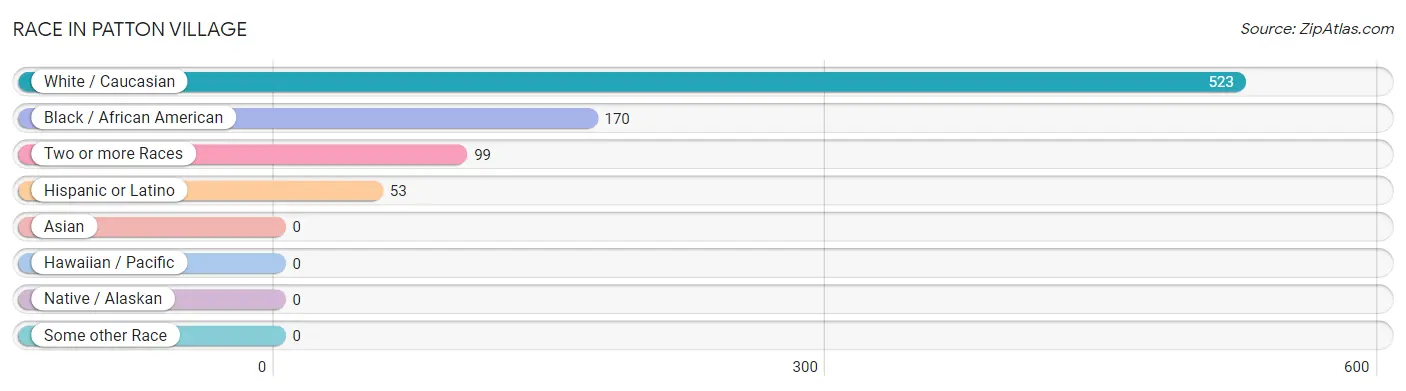
| Race | # Population | % Population |
| Asian | 0 | 0.0% |
| Black / African American | 170 | 21.5% |
| Hawaiian / Pacific | 0 | 0.0% |
| Hispanic or Latino | 53 | 6.7% |
| Native / Alaskan | 0 | 0.0% |
| White / Caucasian | 523 | 66.0% |
| Two or more Races | 99 | 12.5% |
| Some other Race | 0 | 0.0% |
| Total | 792 | 100.0% |
Ancestry in Patton Village
The most populous ancestries reported in Patton Village are Mexican (53 | 6.7%), Swedish (14 | 1.8%), Lithuanian (10 | 1.3%), and Norwegian (8 | 1.0%), together accounting for 10.7% of all Patton Village residents.
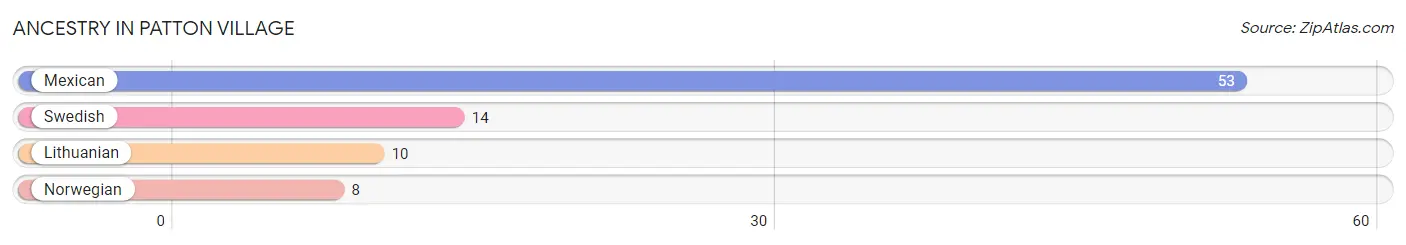
| Ancestry | # Population | % Population |
| Lithuanian | 10 | 1.3% |
| Mexican | 53 | 6.7% |
| Norwegian | 8 | 1.0% |
| Swedish | 14 | 1.8% | View All 4 Rows |
Immigrants in Patton Village

| Immigration Origin | # Population | % Population | View All 0 Rows |
Sex and Age in Patton Village
Sex and Age in Patton Village
The most populous age groups in Patton Village are 45 to 49 Years (180 | 34.4%) for men and 55 to 59 Years (72 | 26.9%) for women.
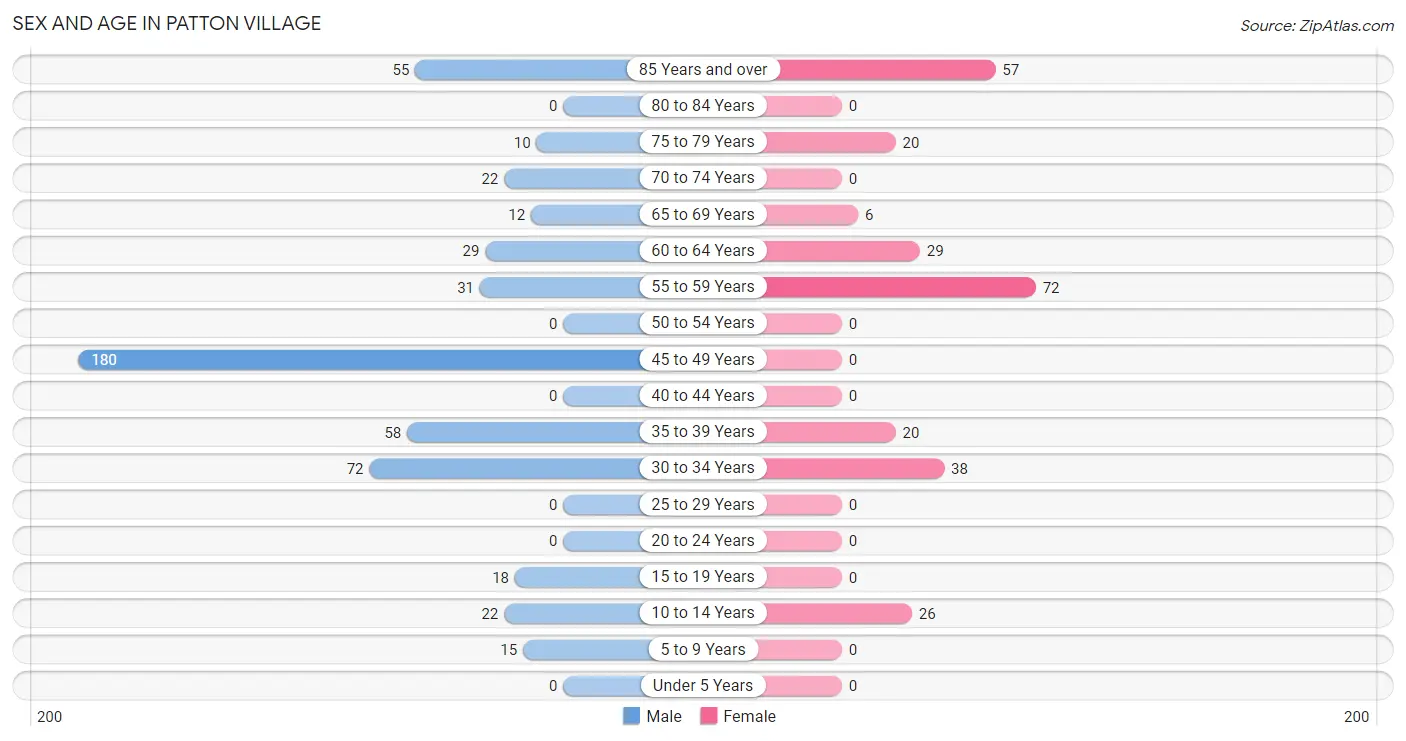
| Age Bracket | Male | Female |
| Under 5 Years | 0 (0.0%) | 0 (0.0%) |
| 5 to 9 Years | 15 (2.9%) | 0 (0.0%) |
| 10 to 14 Years | 22 (4.2%) | 26 (9.7%) |
| 15 to 19 Years | 18 (3.4%) | 0 (0.0%) |
| 20 to 24 Years | 0 (0.0%) | 0 (0.0%) |
| 25 to 29 Years | 0 (0.0%) | 0 (0.0%) |
| 30 to 34 Years | 72 (13.7%) | 38 (14.2%) |
| 35 to 39 Years | 58 (11.1%) | 20 (7.5%) |
| 40 to 44 Years | 0 (0.0%) | 0 (0.0%) |
| 45 to 49 Years | 180 (34.4%) | 0 (0.0%) |
| 50 to 54 Years | 0 (0.0%) | 0 (0.0%) |
| 55 to 59 Years | 31 (5.9%) | 72 (26.9%) |
| 60 to 64 Years | 29 (5.5%) | 29 (10.8%) |
| 65 to 69 Years | 12 (2.3%) | 6 (2.2%) |
| 70 to 74 Years | 22 (4.2%) | 0 (0.0%) |
| 75 to 79 Years | 10 (1.9%) | 20 (7.5%) |
| 80 to 84 Years | 0 (0.0%) | 0 (0.0%) |
| 85 Years and over | 55 (10.5%) | 57 (21.3%) |
| Total | 524 (100.0%) | 268 (100.0%) |
Families and Households in Patton Village
Median Family Size in Patton Village
The median family size in Patton Village is 3.05 persons per family, with single female/mother families (26 | 16.4%) accounting for the largest median family size of 5 persons per family. On the other hand, single male/father families (15 | 9.4%) represent the smallest median family size with 2.33 persons per family.
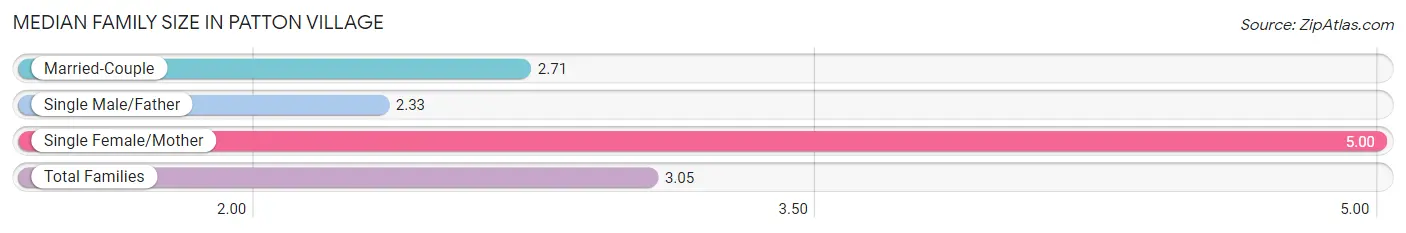
| Family Type | # Families | Family Size |
| Married-Couple | 118 (74.2%) | 2.71 |
| Single Male/Father | 15 (9.4%) | 2.33 |
| Single Female/Mother | 26 (16.4%) | 5.00 |
| Total Families | 159 (100.0%) | 3.05 |
Median Household Size in Patton Village
The median household size in Patton Village is 3.25 persons per household, with single female/mother households (26 | 10.7%) accounting for the largest median household size of 5.77 persons per household. single male/father households (15 | 6.1%) represent the smallest median household size with 2.33 persons per household.
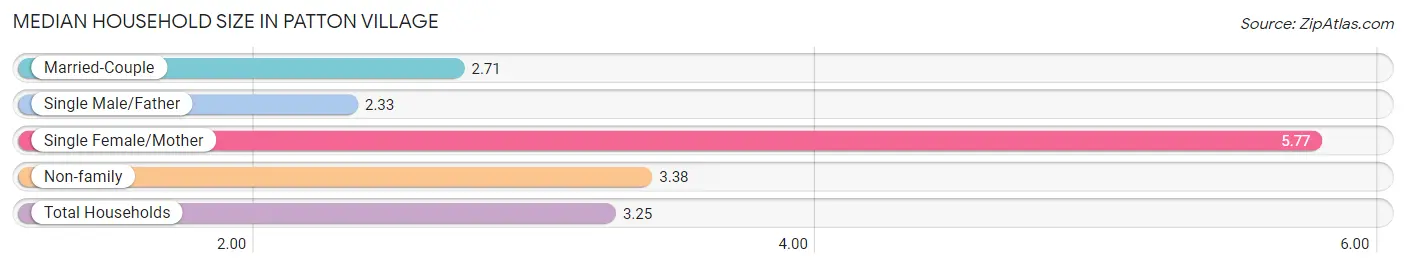
| Household Type | # Households | Household Size |
| Married-Couple | 118 (48.4%) | 2.71 |
| Single Male/Father | 15 (6.1%) | 2.33 |
| Single Female/Mother | 26 (10.7%) | 5.77 |
| Non-family | 85 (34.8%) | 3.38 |
| Total Households | 244 (100.0%) | 3.25 |
Household Size by Marriage Status in Patton Village
Out of a total of 244 households in Patton Village, 159 (65.2%) are family households, while 85 (34.8%) are nonfamily households. The most numerous type of family households are 2-person households, comprising 113, and the most common type of nonfamily households are 2-person households, comprising 71.
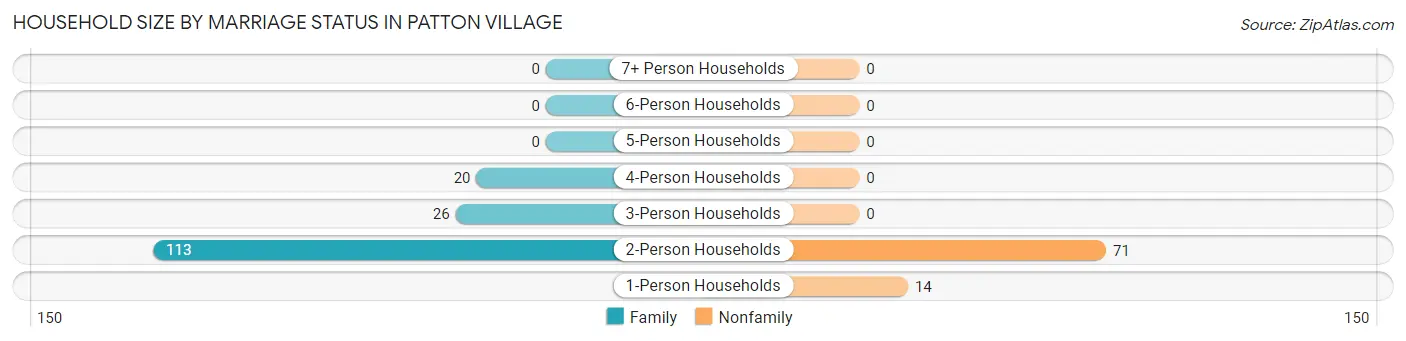
| Household Size | Family Households | Nonfamily Households |
| 1-Person Households | - | 14 (5.7%) |
| 2-Person Households | 113 (46.3%) | 71 (29.1%) |
| 3-Person Households | 26 (10.7%) | 0 (0.0%) |
| 4-Person Households | 20 (8.2%) | 0 (0.0%) |
| 5-Person Households | 0 (0.0%) | 0 (0.0%) |
| 6-Person Households | 0 (0.0%) | 0 (0.0%) |
| 7+ Person Households | 0 (0.0%) | 0 (0.0%) |
| Total | 159 (65.2%) | 85 (34.8%) |
Female Fertility in Patton Village
Fertility by Age in Patton Village
| Age Bracket | Women with Births | Births / 1,000 Women |
| 15 to 19 years | 0 (0.0%) | 0.0 |
| 20 to 34 years | 0 (0.0%) | 0.0 |
| 35 to 50 years | 0 (0.0%) | 0.0 |
| Total | 0 (0.0%) | 0.0 |
Fertility by Age by Marriage Status in Patton Village
| Age Bracket | Married | Unmarried |
| 15 to 19 years | 0 (0.0%) | 0 (0.0%) |
| 20 to 34 years | 0 (0.0%) | 0 (0.0%) |
| 35 to 50 years | 0 (0.0%) | 0 (0.0%) |
| Total | 0 (0.0%) | 0 (0.0%) |
Fertility by Education in Patton Village
| Educational Attainment | Women with Births | Births / 1,000 Women |
| Less than High School | 0 (0.0%) | 0.0 |
| High School Diploma | 0 (0.0%) | 0.0 |
| College or Associate's Degree | 0 (0.0%) | 0.0 |
| Bachelor's Degree | 0 (0.0%) | 0.0 |
| Graduate Degree | 0 (0.0%) | 0.0 |
| Total | 0 (0.0%) | 0.0 |
Fertility by Education by Marriage Status in Patton Village
| Educational Attainment | Married | Unmarried |
| Less than High School | 0 (0.0%) | 0 (0.0%) |
| High School Diploma | 0 (0.0%) | 0 (0.0%) |
| College or Associate's Degree | 0 (0.0%) | 0 (0.0%) |
| Bachelor's Degree | 0 (0.0%) | 0 (0.0%) |
| Graduate Degree | 0 (0.0%) | 0 (0.0%) |
| Total | 0 (0.0%) | 0 (0.0%) |
Employment Characteristics in Patton Village
Employment by Class of Employer in Patton Village
Among the 183 employed individuals in Patton Village, private company employees (61 | 33.3%), self-employed (incorporated) (56 | 30.6%), and federal government employees (46 | 25.1%) make up the most common classes of employment.
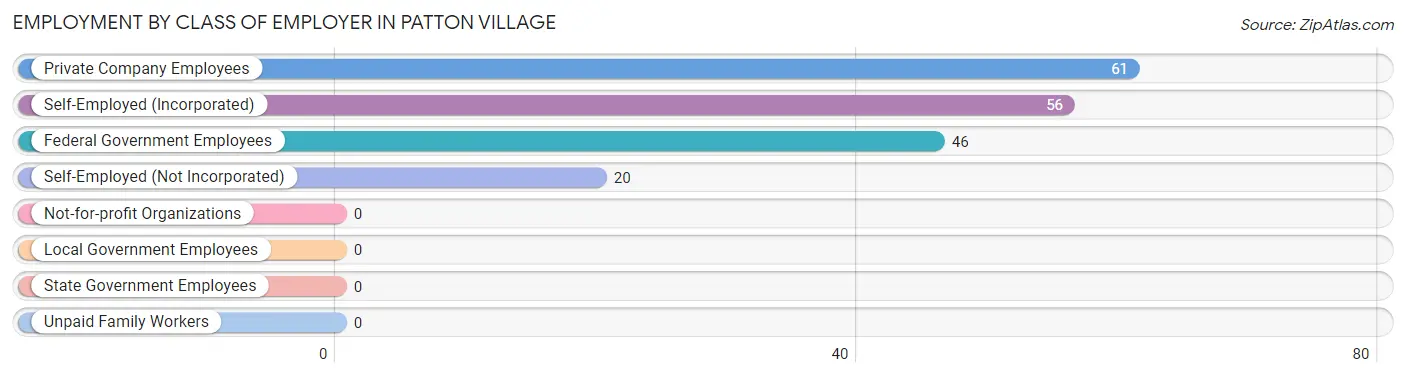
| Employer Class | # Employees | % Employees |
| Private Company Employees | 61 | 33.3% |
| Self-Employed (Incorporated) | 56 | 30.6% |
| Self-Employed (Not Incorporated) | 20 | 10.9% |
| Not-for-profit Organizations | 0 | 0.0% |
| Local Government Employees | 0 | 0.0% |
| State Government Employees | 0 | 0.0% |
| Federal Government Employees | 46 | 25.1% |
| Unpaid Family Workers | 0 | 0.0% |
| Total | 183 | 100.0% |
Employment Status by Age in Patton Village
According to the labor force statistics for Patton Village, out of the total population over 16 years of age (729), 33.1% or 241 individuals are in the labor force, with 24.1% or 58 of them unemployed. The age group with the highest labor force participation rate is 35 to 44 years, with 100.0% or 78 individuals in the labor force. Within the labor force, the 35 to 44 years age range has the highest percentage of unemployed individuals, with 74.4% or 58 of them being unemployed.
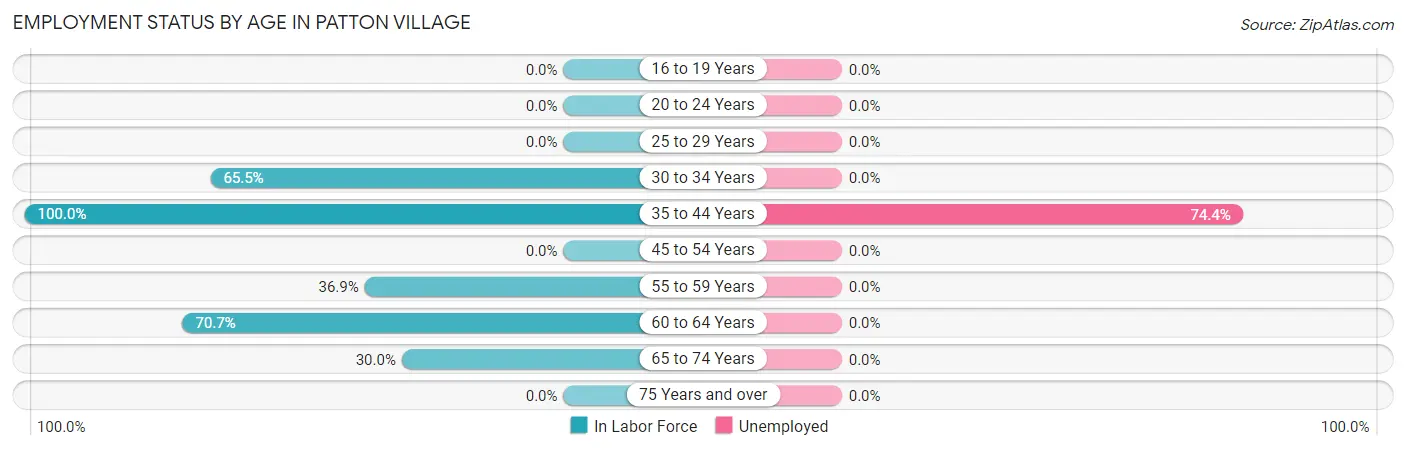
| Age Bracket | In Labor Force | Unemployed |
| 16 to 19 Years | 0 (0.0%) | 0 (0.0%) |
| 20 to 24 Years | 0 (0.0%) | 0 (0.0%) |
| 25 to 29 Years | 0 (0.0%) | 0 (0.0%) |
| 30 to 34 Years | 72 (65.5%) | 0 (0.0%) |
| 35 to 44 Years | 78 (100.0%) | 58 (74.4%) |
| 45 to 54 Years | 0 (0.0%) | 0 (0.0%) |
| 55 to 59 Years | 38 (36.9%) | 0 (0.0%) |
| 60 to 64 Years | 41 (70.7%) | 0 (0.0%) |
| 65 to 74 Years | 12 (30.0%) | 0 (0.0%) |
| 75 Years and over | 0 (0.0%) | 0 (0.0%) |
| Total | 241 (33.1%) | 58 (24.1%) |
Employment Status by Educational Attainment in Patton Village
According to labor force statistics for Patton Village, 43.3% of individuals (229) out of the total population between 25 and 64 years of age (529) are in the labor force, with 25.3% or 58 of them being unemployed. The group with the highest labor force participation rate are those with the educational attainment of high school diploma, with 78.9% or 45 individuals in the labor force. Within the labor force, individuals with bachelor's degree or higher education have the highest percentage of unemployment, with 74.4% or 58 of them being unemployed.
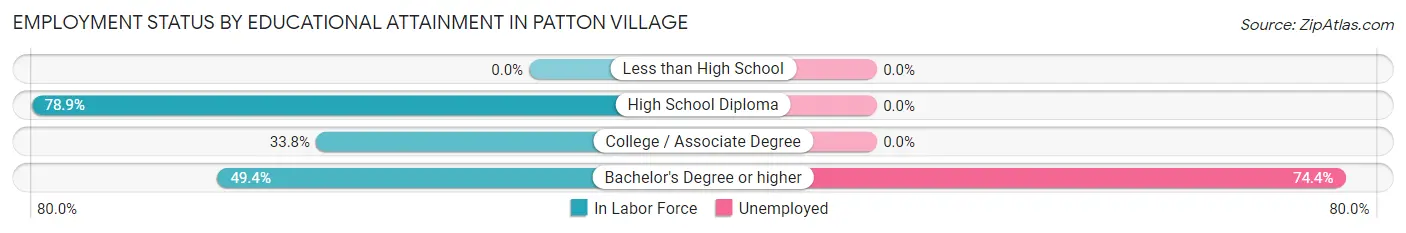
| Educational Attainment | In Labor Force | Unemployed |
| Less than High School | 0 (0.0%) | 0 (0.0%) |
| High School Diploma | 45 (78.9%) | 0 (0.0%) |
| College / Associate Degree | 106 (33.8%) | 0 (0.0%) |
| Bachelor's Degree or higher | 78 (49.4%) | 118 (74.4%) |
| Total | 229 (43.3%) | 134 (25.3%) |
Employment Occupations by Sex in Patton Village
Management, Business, Science and Arts Occupations
The most common Management, Business, Science and Arts occupations in Patton Village are , and Management (14 | 7.6%).
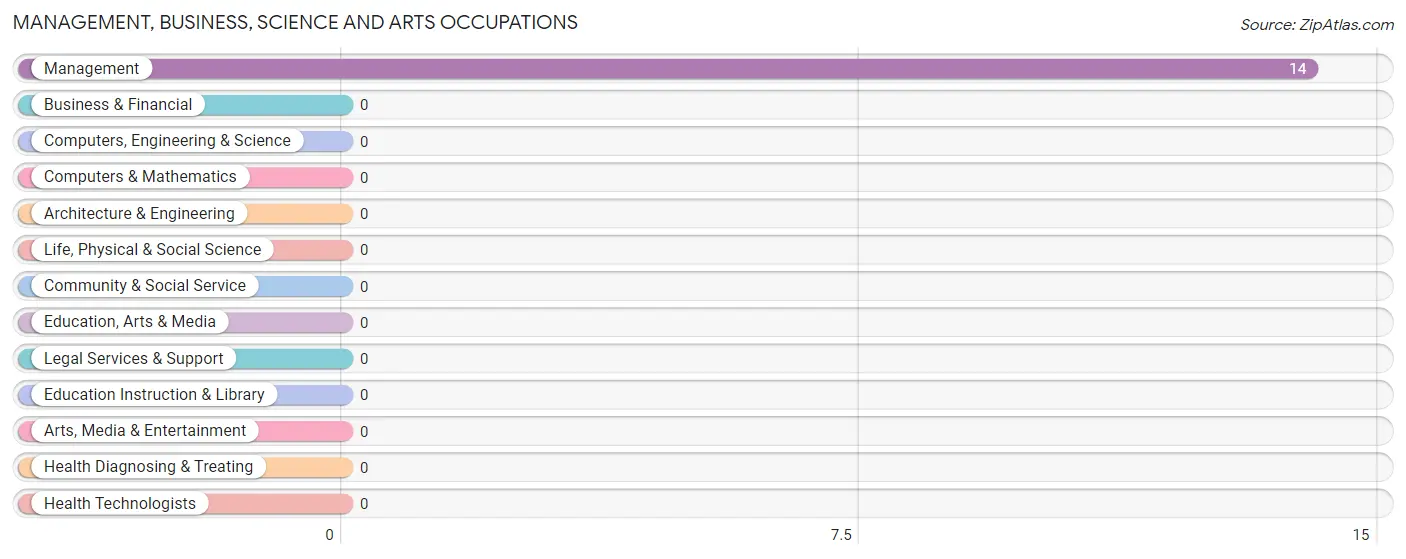
Management, Business, Science and Arts Occupations by Sex
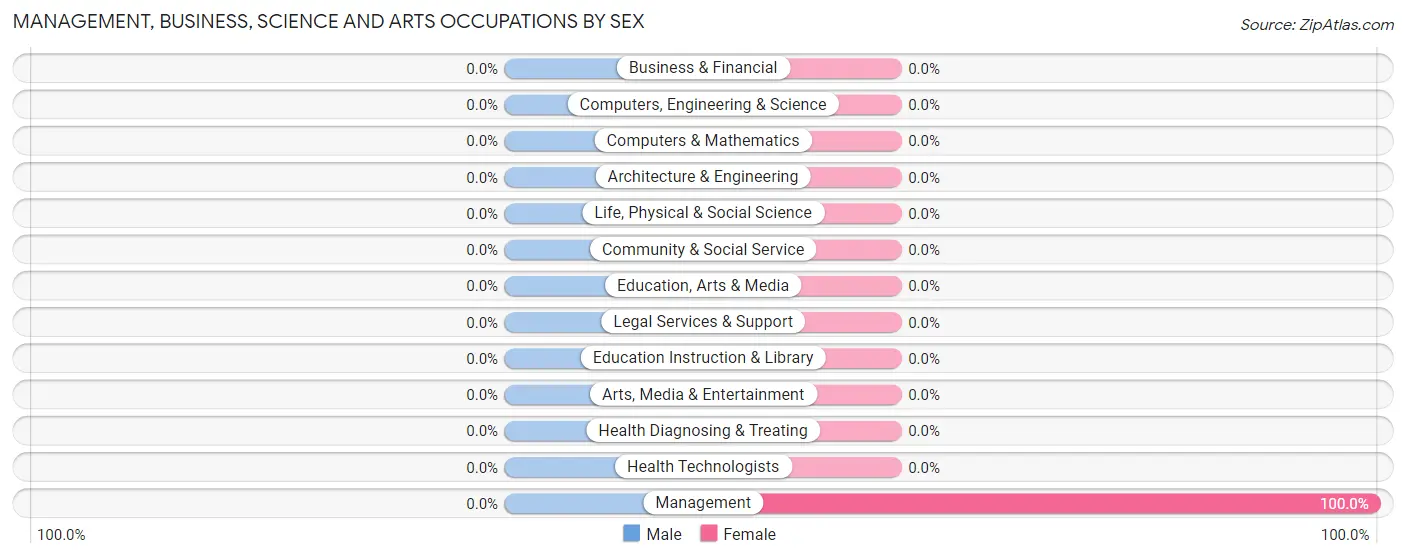
| Occupation | Male | Female |
| Management | 0 (0.0%) | 14 (100.0%) |
| Business & Financial | 0 (0.0%) | 0 (0.0%) |
| Computers, Engineering & Science | 0 (0.0%) | 0 (0.0%) |
| Computers & Mathematics | 0 (0.0%) | 0 (0.0%) |
| Architecture & Engineering | 0 (0.0%) | 0 (0.0%) |
| Life, Physical & Social Science | 0 (0.0%) | 0 (0.0%) |
| Community & Social Service | 0 (0.0%) | 0 (0.0%) |
| Education, Arts & Media | 0 (0.0%) | 0 (0.0%) |
| Legal Services & Support | 0 (0.0%) | 0 (0.0%) |
| Education Instruction & Library | 0 (0.0%) | 0 (0.0%) |
| Arts, Media & Entertainment | 0 (0.0%) | 0 (0.0%) |
| Health Diagnosing & Treating | 0 (0.0%) | 0 (0.0%) |
| Health Technologists | 0 (0.0%) | 0 (0.0%) |
| Total (Category) | 0 (0.0%) | 14 (100.0%) |
| Total (Overall) | 135 (73.8%) | 48 (26.2%) |
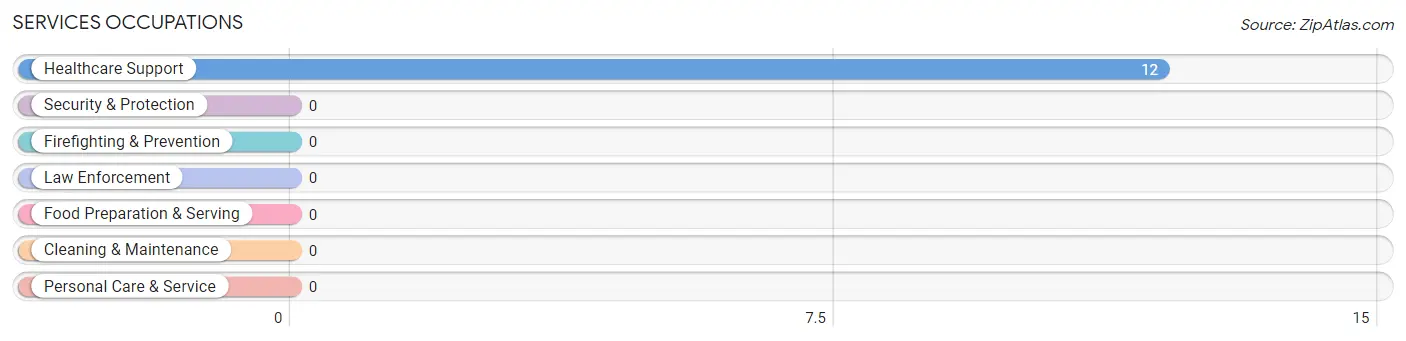
Services Occupations
The most common Services occupations in Patton Village are , and Healthcare Support (12 | 6.6%).
Services Occupations by Sex
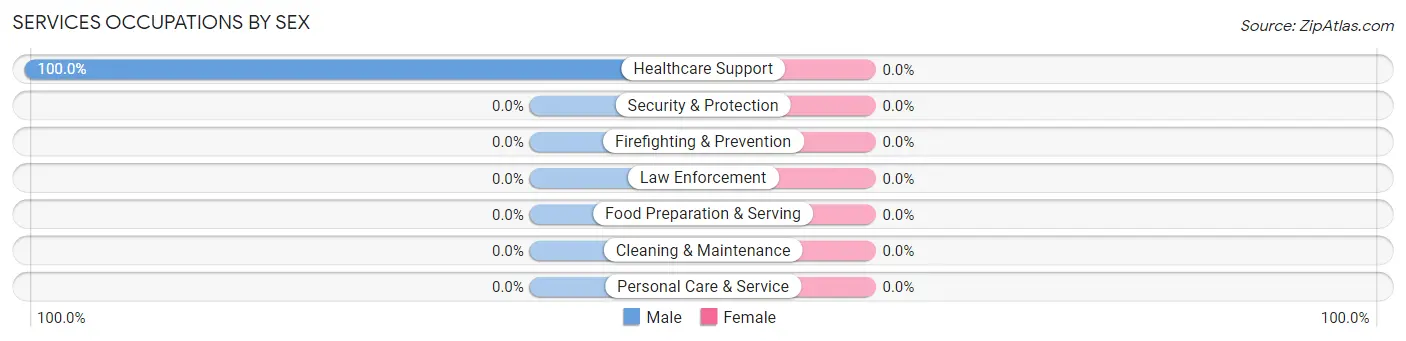
| Occupation | Male | Female |
| Healthcare Support | 12 (100.0%) | 0 (0.0%) |
| Security & Protection | 0 (0.0%) | 0 (0.0%) |
| Firefighting & Prevention | 0 (0.0%) | 0 (0.0%) |
| Law Enforcement | 0 (0.0%) | 0 (0.0%) |
| Food Preparation & Serving | 0 (0.0%) | 0 (0.0%) |
| Cleaning & Maintenance | 0 (0.0%) | 0 (0.0%) |
| Personal Care & Service | 0 (0.0%) | 0 (0.0%) |
| Total (Category) | 12 (100.0%) | 0 (0.0%) |
| Total (Overall) | 135 (73.8%) | 48 (26.2%) |
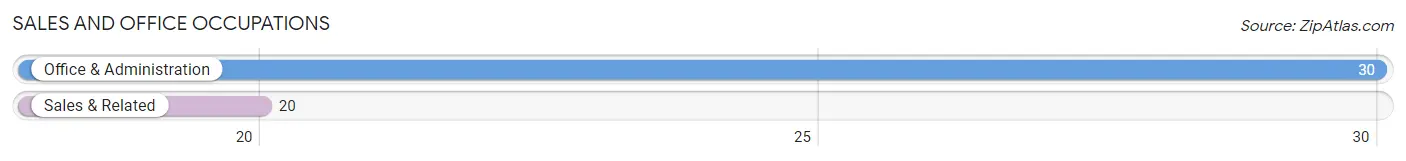
Sales and Office Occupations
The most common Sales and Office occupations in Patton Village are Office & Administration (30 | 16.4%), and Sales & Related (20 | 10.9%).
Sales and Office Occupations by Sex
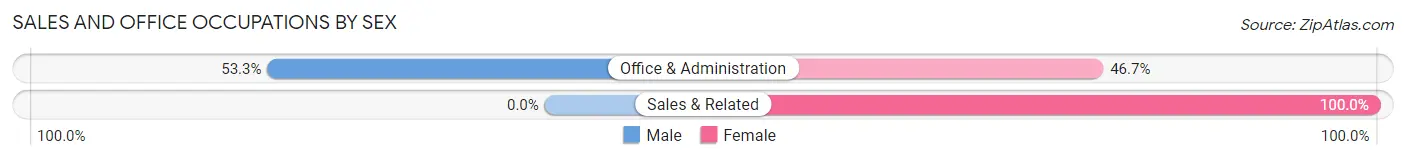
| Occupation | Male | Female |
| Sales & Related | 0 (0.0%) | 20 (100.0%) |
| Office & Administration | 16 (53.3%) | 14 (46.7%) |
| Total (Category) | 16 (32.0%) | 34 (68.0%) |
| Total (Overall) | 135 (73.8%) | 48 (26.2%) |
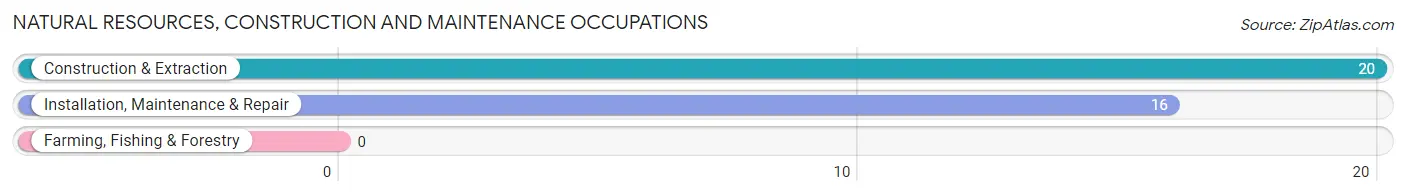
Natural Resources, Construction and Maintenance Occupations
The most common Natural Resources, Construction and Maintenance occupations in Patton Village are Construction & Extraction (20 | 10.9%), and Installation, Maintenance & Repair (16 | 8.7%).
Natural Resources, Construction and Maintenance Occupations by Sex
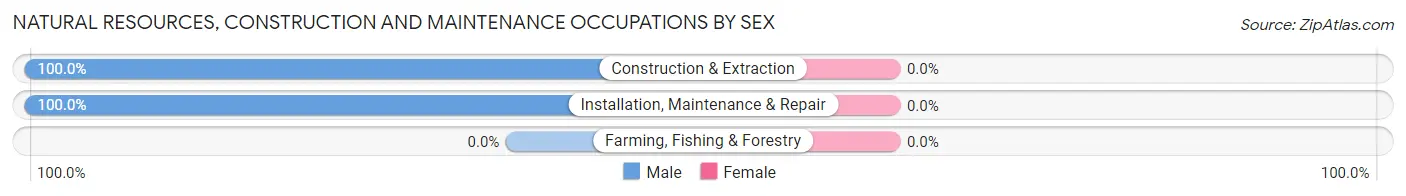
| Occupation | Male | Female |
| Farming, Fishing & Forestry | 0 (0.0%) | 0 (0.0%) |
| Construction & Extraction | 20 (100.0%) | 0 (0.0%) |
| Installation, Maintenance & Repair | 16 (100.0%) | 0 (0.0%) |
| Total (Category) | 36 (100.0%) | 0 (0.0%) |
| Total (Overall) | 135 (73.8%) | 48 (26.2%) |
Production, Transportation and Moving Occupations
The most common Production, Transportation and Moving occupations in Patton Village are Material Moving (56 | 30.6%), and Transportation (15 | 8.2%).
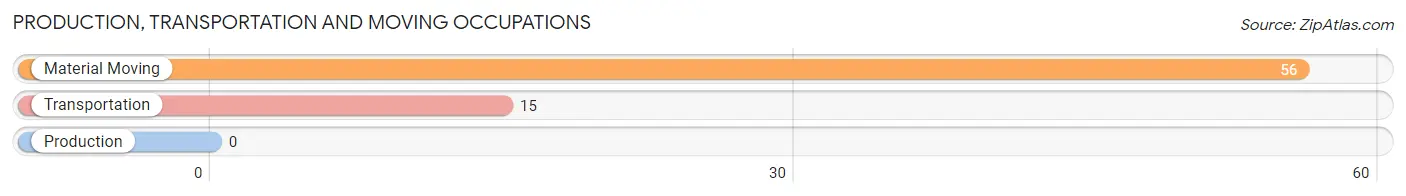
Production, Transportation and Moving Occupations by Sex
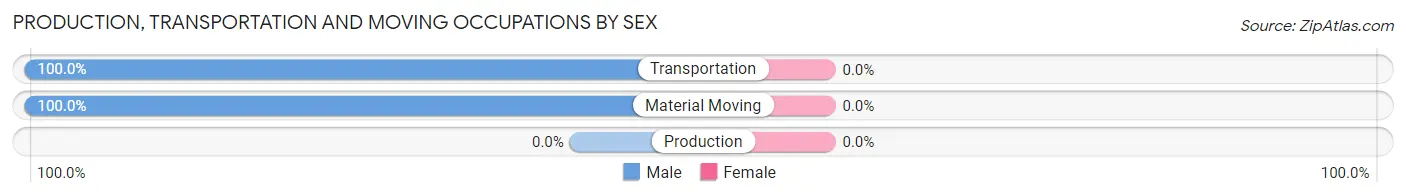
| Occupation | Male | Female |
| Production | 0 (0.0%) | 0 (0.0%) |
| Transportation | 15 (100.0%) | 0 (0.0%) |
| Material Moving | 56 (100.0%) | 0 (0.0%) |
| Total (Category) | 71 (100.0%) | 0 (0.0%) |
| Total (Overall) | 135 (73.8%) | 48 (26.2%) |
Employment Industries by Sex in Patton Village
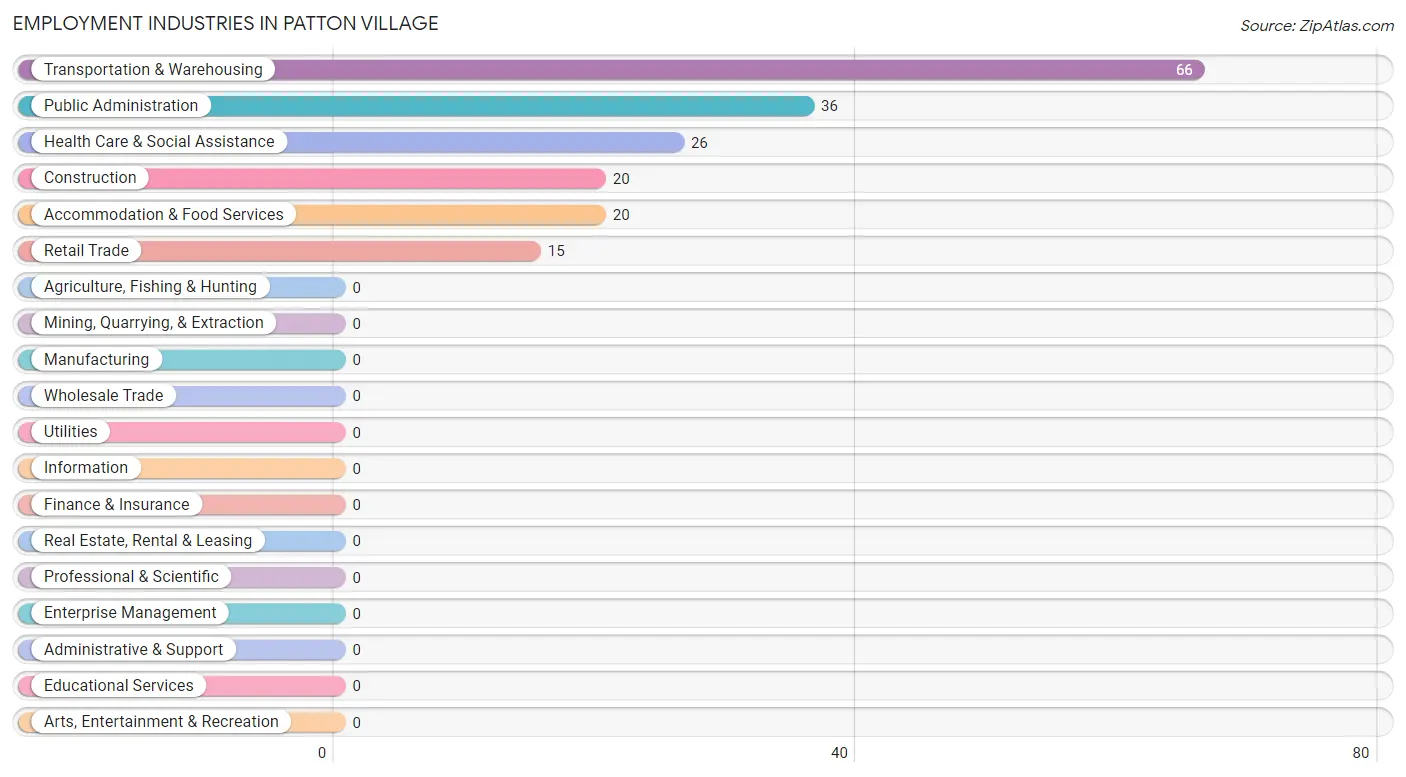
Employment Industries in Patton Village
The major employment industries in Patton Village include Transportation & Warehousing (66 | 36.1%), Public Administration (36 | 19.7%), Health Care & Social Assistance (26 | 14.2%), Construction (20 | 10.9%), and Accommodation & Food Services (20 | 10.9%).
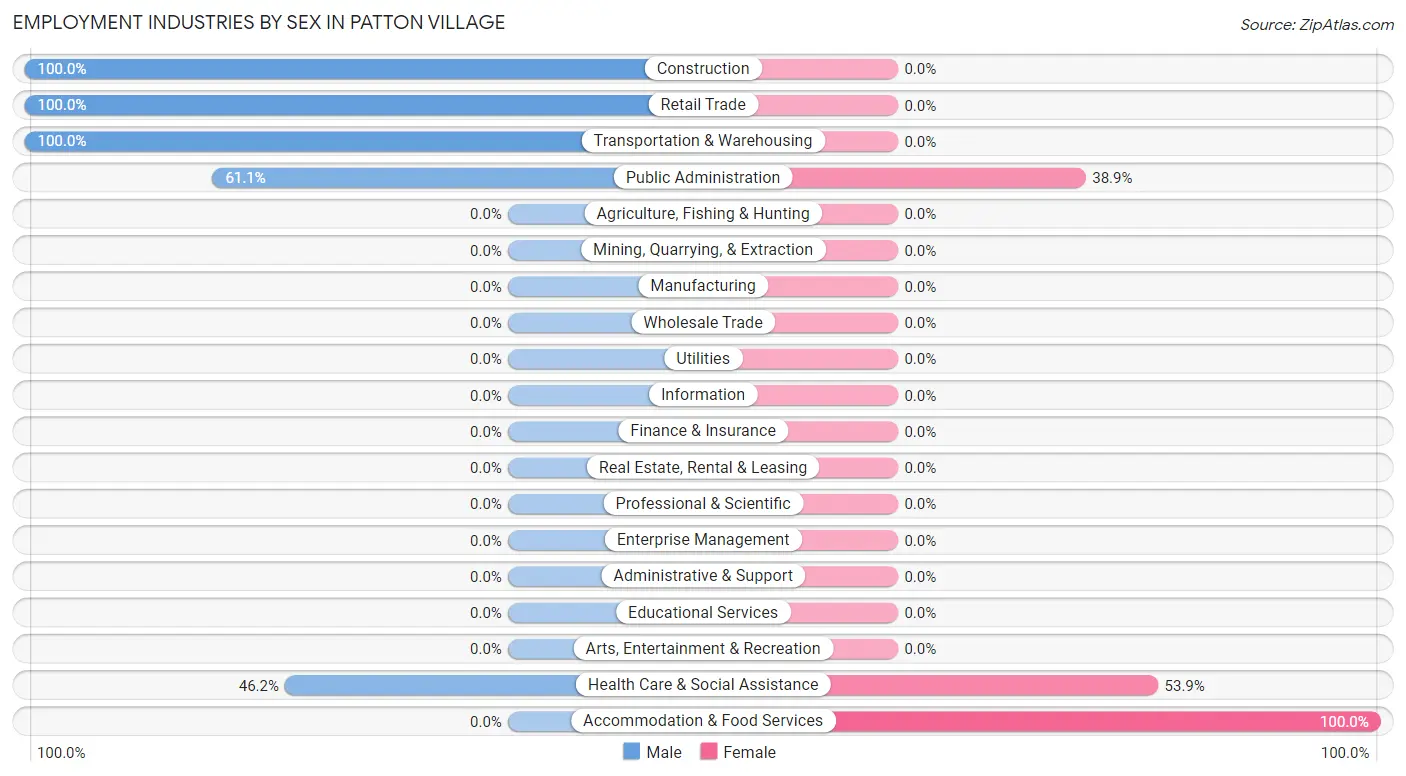
Employment Industries by Sex in Patton Village
The Patton Village industries that see more men than women are Construction (100.0%), Retail Trade (100.0%), and Transportation & Warehousing (100.0%), whereas the industries that tend to have a higher number of women are Accommodation & Food Services (100.0%), Health Care & Social Assistance (53.8%), and Public Administration (38.9%).
| Industry | Male | Female |
| Agriculture, Fishing & Hunting | 0 (0.0%) | 0 (0.0%) |
| Mining, Quarrying, & Extraction | 0 (0.0%) | 0 (0.0%) |
| Construction | 20 (100.0%) | 0 (0.0%) |
| Manufacturing | 0 (0.0%) | 0 (0.0%) |
| Wholesale Trade | 0 (0.0%) | 0 (0.0%) |
| Retail Trade | 15 (100.0%) | 0 (0.0%) |
| Transportation & Warehousing | 66 (100.0%) | 0 (0.0%) |
| Utilities | 0 (0.0%) | 0 (0.0%) |
| Information | 0 (0.0%) | 0 (0.0%) |
| Finance & Insurance | 0 (0.0%) | 0 (0.0%) |
| Real Estate, Rental & Leasing | 0 (0.0%) | 0 (0.0%) |
| Professional & Scientific | 0 (0.0%) | 0 (0.0%) |
| Enterprise Management | 0 (0.0%) | 0 (0.0%) |
| Administrative & Support | 0 (0.0%) | 0 (0.0%) |
| Educational Services | 0 (0.0%) | 0 (0.0%) |
| Health Care & Social Assistance | 12 (46.2%) | 14 (53.8%) |
| Arts, Entertainment & Recreation | 0 (0.0%) | 0 (0.0%) |
| Accommodation & Food Services | 0 (0.0%) | 20 (100.0%) |
| Public Administration | 22 (61.1%) | 14 (38.9%) |
| Total | 135 (73.8%) | 48 (26.2%) |
Education in Patton Village
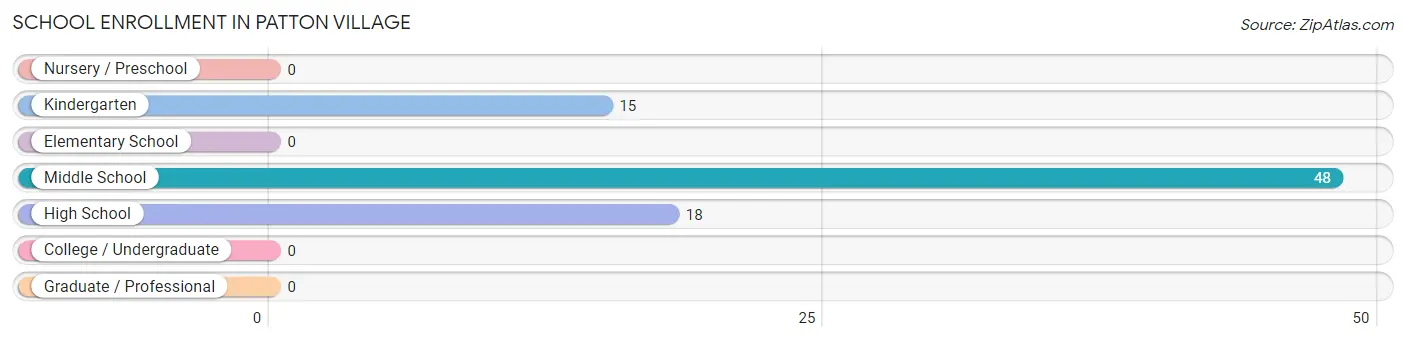
School Enrollment in Patton Village
The most common levels of schooling among the 81 students in Patton Village are middle school (48 | 59.3%), high school (18 | 22.2%), and kindergarten (15 | 18.5%).
| School Level | # Students | % Students |
| Nursery / Preschool | 0 | 0.0% |
| Kindergarten | 15 | 18.5% |
| Elementary School | 0 | 0.0% |
| Middle School | 48 | 59.3% |
| High School | 18 | 22.2% |
| College / Undergraduate | 0 | 0.0% |
| Graduate / Professional | 0 | 0.0% |
| Total | 81 | 100.0% |
School Enrollment by Age by Funding Source in Patton Village
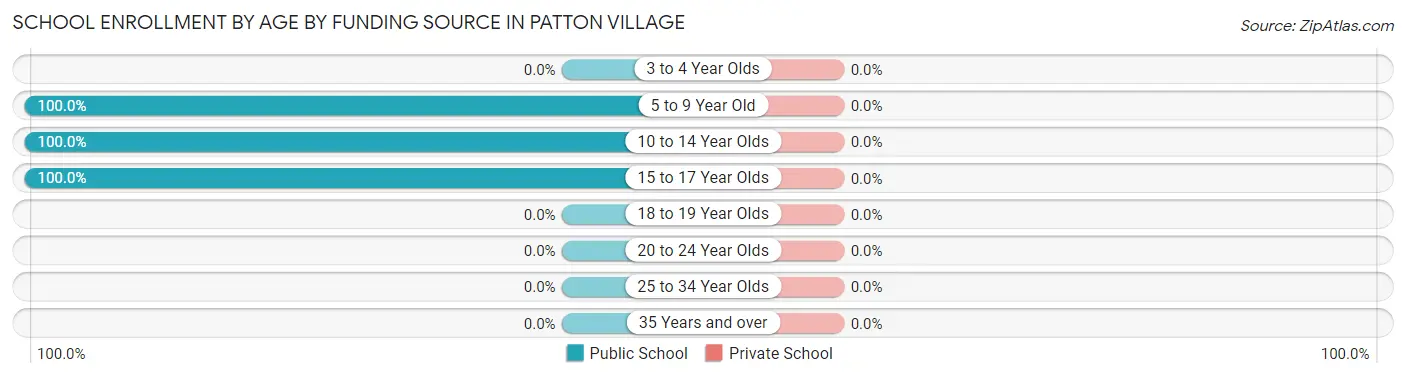
| Age Bracket | Public School | Private School |
| 3 to 4 Year Olds | 0 (0.0%) | 0 (0.0%) |
| 5 to 9 Year Old | 15 (100.0%) | 0 (0.0%) |
| 10 to 14 Year Olds | 48 (100.0%) | 0 (0.0%) |
| 15 to 17 Year Olds | 18 (100.0%) | 0 (0.0%) |
| 18 to 19 Year Olds | 0 (0.0%) | 0 (0.0%) |
| 20 to 24 Year Olds | 0 (0.0%) | 0 (0.0%) |
| 25 to 34 Year Olds | 0 (0.0%) | 0 (0.0%) |
| 35 Years and over | 0 (0.0%) | 0 (0.0%) |
| Total | 81 (100.0%) | 0 (0.0%) |
Educational Attainment by Field of Study in Patton Village
Arts & humanities (61 | 34.3%), education (58 | 32.6%), bio, nature & agricultural (20 | 11.2%), computers & mathematics (19 | 10.7%), and literature & languages (10 | 5.6%) are the most common fields of study among 178 individuals in Patton Village who have obtained a bachelor's degree or higher.
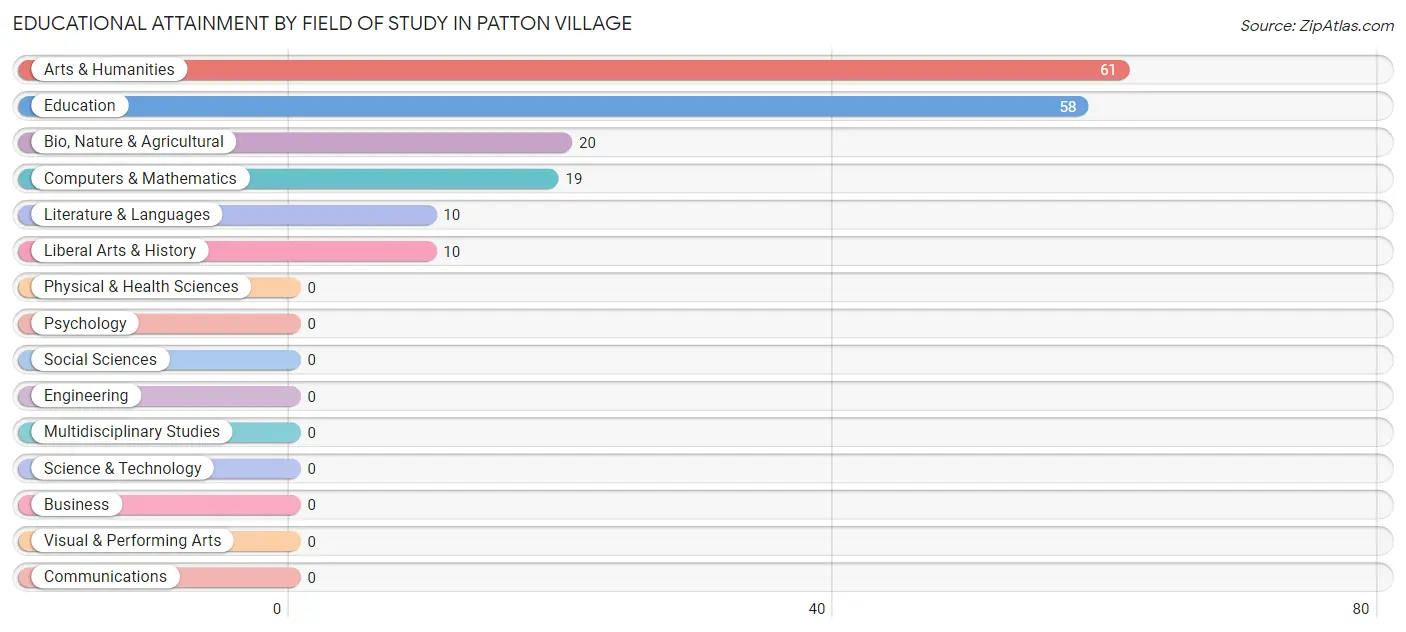
| Field of Study | # Graduates | % Graduates |
| Computers & Mathematics | 19 | 10.7% |
| Bio, Nature & Agricultural | 20 | 11.2% |
| Physical & Health Sciences | 0 | 0.0% |
| Psychology | 0 | 0.0% |
| Social Sciences | 0 | 0.0% |
| Engineering | 0 | 0.0% |
| Multidisciplinary Studies | 0 | 0.0% |
| Science & Technology | 0 | 0.0% |
| Business | 0 | 0.0% |
| Education | 58 | 32.6% |
| Literature & Languages | 10 | 5.6% |
| Liberal Arts & History | 10 | 5.6% |
| Visual & Performing Arts | 0 | 0.0% |
| Communications | 0 | 0.0% |
| Arts & Humanities | 61 | 34.3% |
| Total | 178 | 100.0% |
Transportation & Commute in Patton Village
Vehicle Availability by Sex in Patton Village
The most prevalent vehicle ownership categories in Patton Village are males with 3 vehicles (82, accounting for 60.7%) and females with 3 vehicles (27, making up 170.8%).
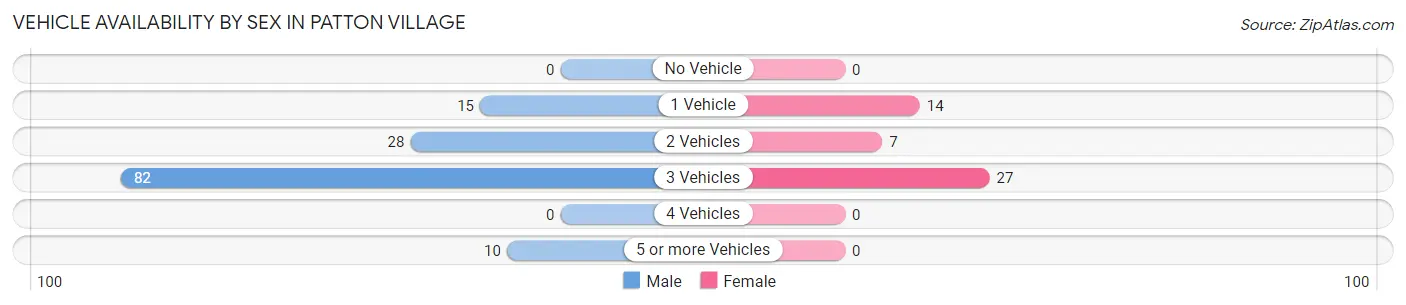
| Vehicles Available | Male | Female |
| No Vehicle | 0 (0.0%) | 0 (0.0%) |
| 1 Vehicle | 15 (11.1%) | 14 (29.2%) |
| 2 Vehicles | 28 (20.7%) | 7 (14.6%) |
| 3 Vehicles | 82 (60.7%) | 27 (56.2%) |
| 4 Vehicles | 0 (0.0%) | 0 (0.0%) |
| 5 or more Vehicles | 10 (7.4%) | 0 (0.0%) |
| Total | 135 (100.0%) | 48 (100.0%) |
Commute Time in Patton Village
The most frequently occuring commute durations in Patton Village are 20 to 24 minutes (83 commuters, 45.4%), 5 to 9 minutes (37 commuters, 20.2%), and 30 to 34 minutes (35 commuters, 19.1%).
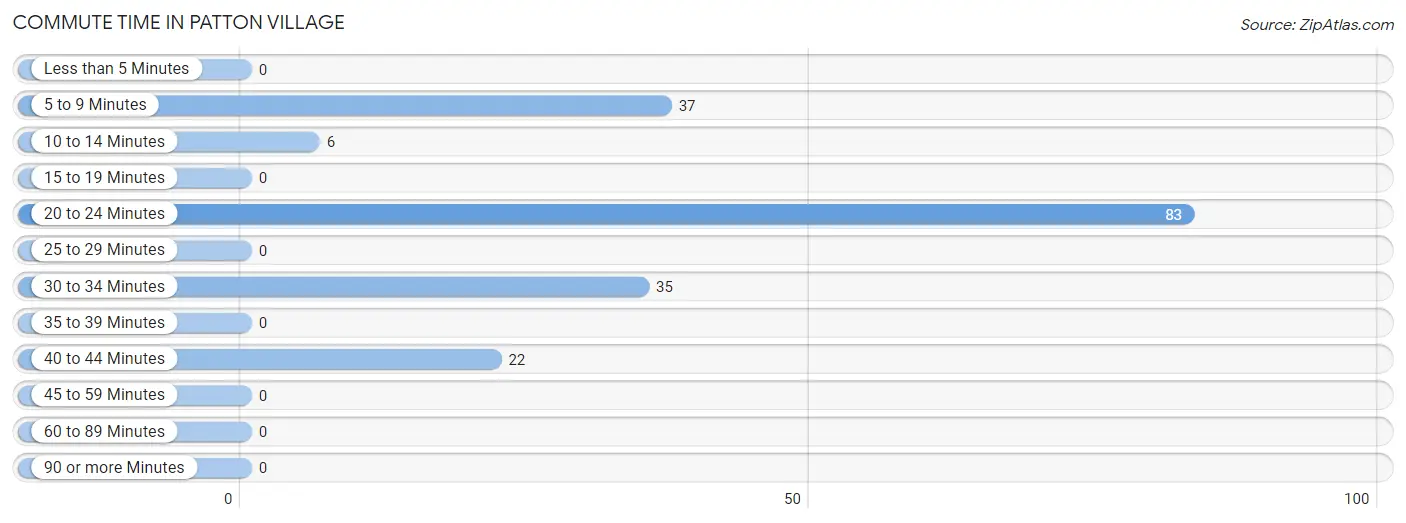
| Commute Time | # Commuters | % Commuters |
| Less than 5 Minutes | 0 | 0.0% |
| 5 to 9 Minutes | 37 | 20.2% |
| 10 to 14 Minutes | 6 | 3.3% |
| 15 to 19 Minutes | 0 | 0.0% |
| 20 to 24 Minutes | 83 | 45.4% |
| 25 to 29 Minutes | 0 | 0.0% |
| 30 to 34 Minutes | 35 | 19.1% |
| 35 to 39 Minutes | 0 | 0.0% |
| 40 to 44 Minutes | 22 | 12.0% |
| 45 to 59 Minutes | 0 | 0.0% |
| 60 to 89 Minutes | 0 | 0.0% |
| 90 or more Minutes | 0 | 0.0% |
Commute Time by Sex in Patton Village
The most common commute times in Patton Village are 20 to 24 minutes (56 commuters, 41.5%) for males and 20 to 24 minutes (27 commuters, 56.2%) for females.
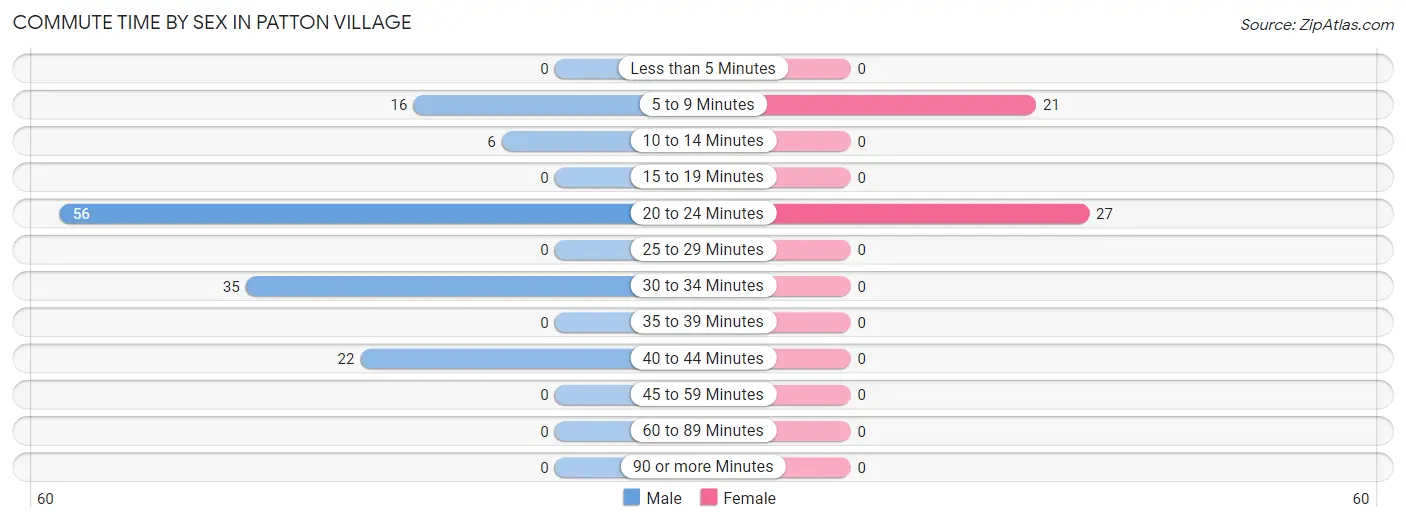
| Commute Time | Male | Female |
| Less than 5 Minutes | 0 (0.0%) | 0 (0.0%) |
| 5 to 9 Minutes | 16 (11.8%) | 21 (43.8%) |
| 10 to 14 Minutes | 6 (4.4%) | 0 (0.0%) |
| 15 to 19 Minutes | 0 (0.0%) | 0 (0.0%) |
| 20 to 24 Minutes | 56 (41.5%) | 27 (56.2%) |
| 25 to 29 Minutes | 0 (0.0%) | 0 (0.0%) |
| 30 to 34 Minutes | 35 (25.9%) | 0 (0.0%) |
| 35 to 39 Minutes | 0 (0.0%) | 0 (0.0%) |
| 40 to 44 Minutes | 22 (16.3%) | 0 (0.0%) |
| 45 to 59 Minutes | 0 (0.0%) | 0 (0.0%) |
| 60 to 89 Minutes | 0 (0.0%) | 0 (0.0%) |
| 90 or more Minutes | 0 (0.0%) | 0 (0.0%) |
Time of Departure to Work by Sex in Patton Village
The most frequent times of departure to work in Patton Village are 12:00 AM to 4:59 AM (56, 41.5%) for males and 4:00 PM to 11:59 PM (20, 41.7%) for females.
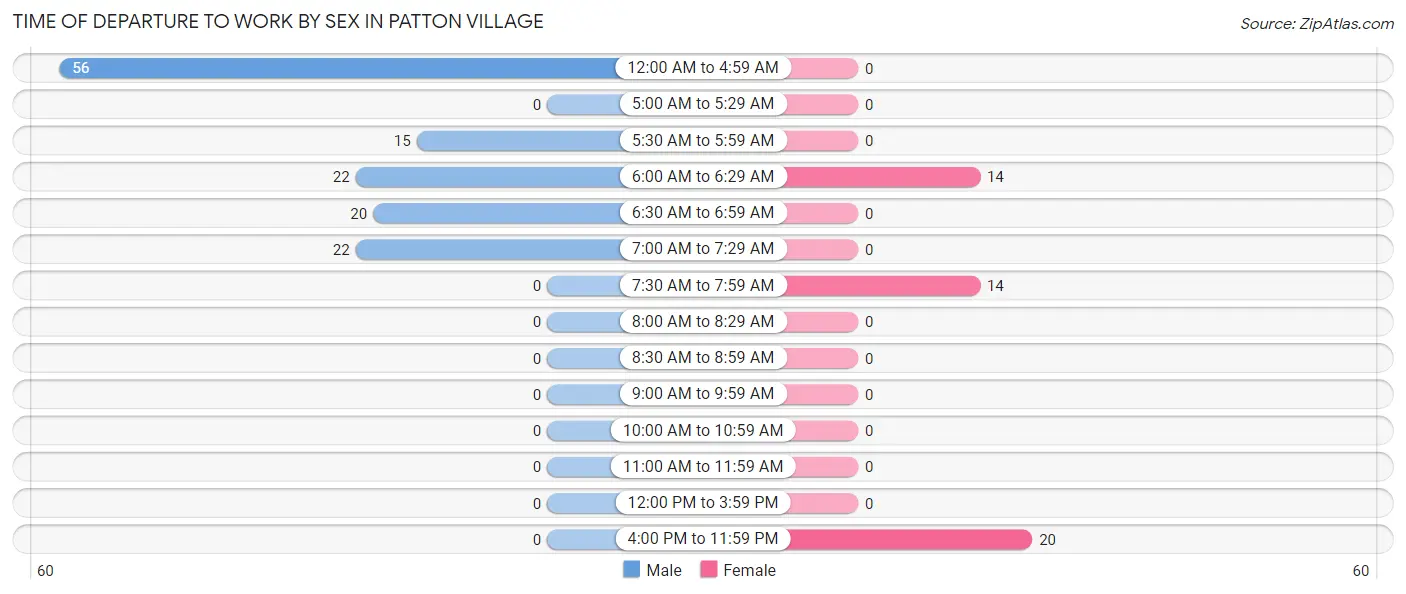
| Time of Departure | Male | Female |
| 12:00 AM to 4:59 AM | 56 (41.5%) | 0 (0.0%) |
| 5:00 AM to 5:29 AM | 0 (0.0%) | 0 (0.0%) |
| 5:30 AM to 5:59 AM | 15 (11.1%) | 0 (0.0%) |
| 6:00 AM to 6:29 AM | 22 (16.3%) | 14 (29.2%) |
| 6:30 AM to 6:59 AM | 20 (14.8%) | 0 (0.0%) |
| 7:00 AM to 7:29 AM | 22 (16.3%) | 0 (0.0%) |
| 7:30 AM to 7:59 AM | 0 (0.0%) | 14 (29.2%) |
| 8:00 AM to 8:29 AM | 0 (0.0%) | 0 (0.0%) |
| 8:30 AM to 8:59 AM | 0 (0.0%) | 0 (0.0%) |
| 9:00 AM to 9:59 AM | 0 (0.0%) | 0 (0.0%) |
| 10:00 AM to 10:59 AM | 0 (0.0%) | 0 (0.0%) |
| 11:00 AM to 11:59 AM | 0 (0.0%) | 0 (0.0%) |
| 12:00 PM to 3:59 PM | 0 (0.0%) | 0 (0.0%) |
| 4:00 PM to 11:59 PM | 0 (0.0%) | 20 (41.7%) |
| Total | 135 (100.0%) | 48 (100.0%) |
Housing Occupancy in Patton Village
Occupancy by Ownership in Patton Village
Of the total 244 dwellings in Patton Village, owner-occupied units account for 181 (74.2%), while renter-occupied units make up 63 (25.8%).
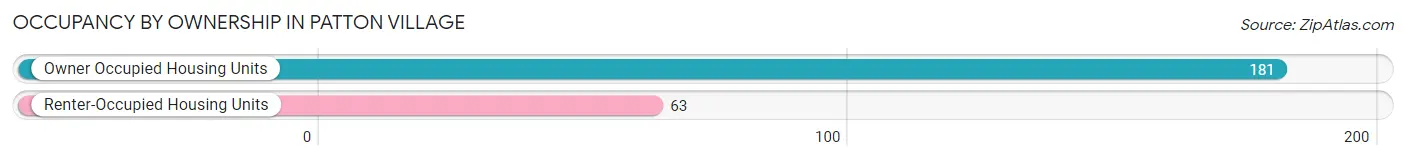
| Occupancy | # Housing Units | % Housing Units |
| Owner Occupied Housing Units | 181 | 74.2% |
| Renter-Occupied Housing Units | 63 | 25.8% |
| Total Occupied Housing Units | 244 | 100.0% |
Occupancy by Household Size in Patton Village
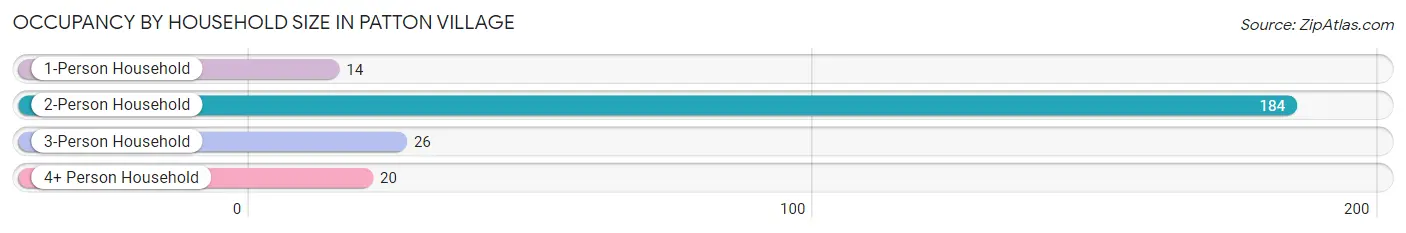
| Household Size | # Housing Units | % Housing Units |
| 1-Person Household | 14 | 5.7% |
| 2-Person Household | 184 | 75.4% |
| 3-Person Household | 26 | 10.7% |
| 4+ Person Household | 20 | 8.2% |
| Total Housing Units | 244 | 100.0% |
Occupancy by Ownership by Household Size in Patton Village
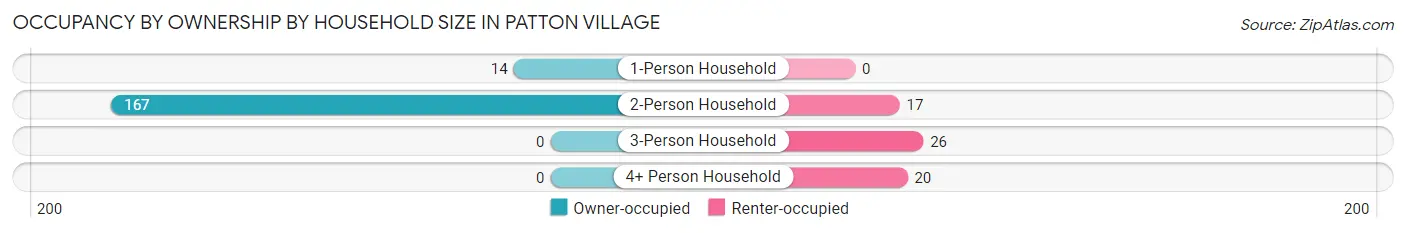
| Household Size | Owner-occupied | Renter-occupied |
| 1-Person Household | 14 (100.0%) | 0 (0.0%) |
| 2-Person Household | 167 (90.8%) | 17 (9.2%) |
| 3-Person Household | 0 (0.0%) | 26 (100.0%) |
| 4+ Person Household | 0 (0.0%) | 20 (100.0%) |
| Total Housing Units | 181 (74.2%) | 63 (25.8%) |
Occupancy by Educational Attainment in Patton Village
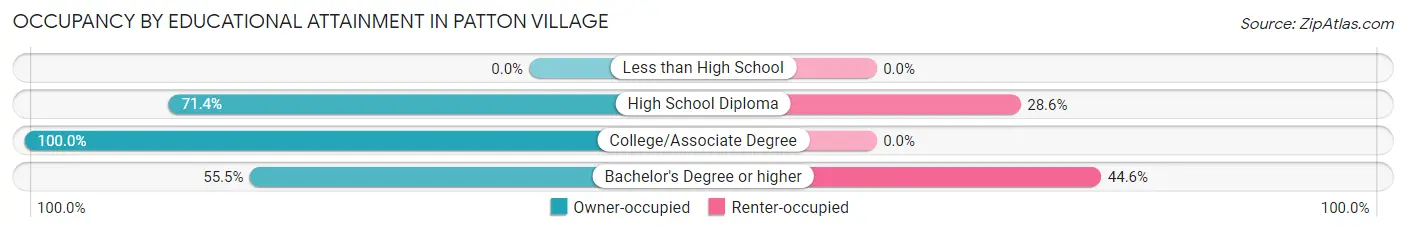
| Household Size | Owner-occupied | Renter-occupied |
| Less than High School | 0 (0.0%) | 0 (0.0%) |
| High School Diploma | 35 (71.4%) | 14 (28.6%) |
| College/Associate Degree | 85 (100.0%) | 0 (0.0%) |
| Bachelor's Degree or higher | 61 (55.4%) | 49 (44.6%) |
Occupancy by Age of Householder in Patton Village
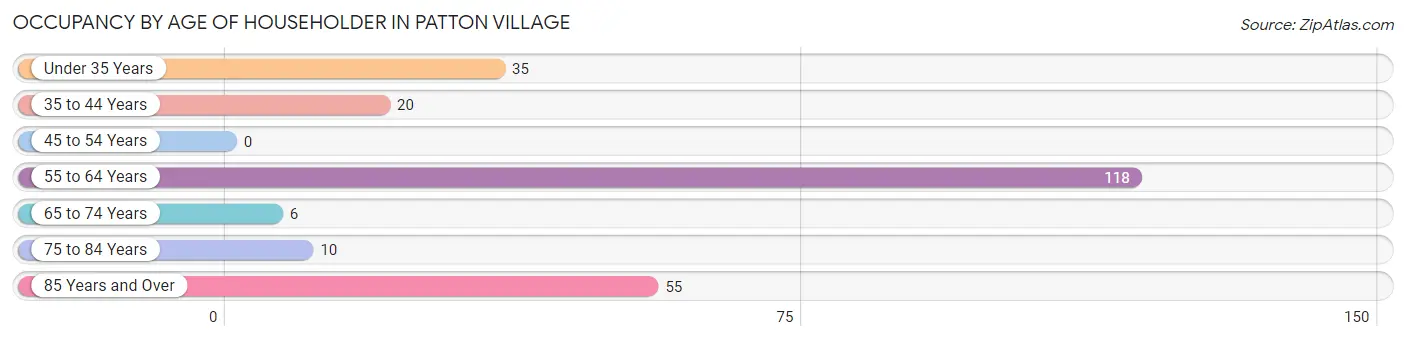
| Age Bracket | # Households | % Households |
| Under 35 Years | 35 | 14.3% |
| 35 to 44 Years | 20 | 8.2% |
| 45 to 54 Years | 0 | 0.0% |
| 55 to 64 Years | 118 | 48.4% |
| 65 to 74 Years | 6 | 2.5% |
| 75 to 84 Years | 10 | 4.1% |
| 85 Years and Over | 55 | 22.5% |
| Total | 244 | 100.0% |
Housing Finances in Patton Village
Median Income by Occupancy in Patton Village
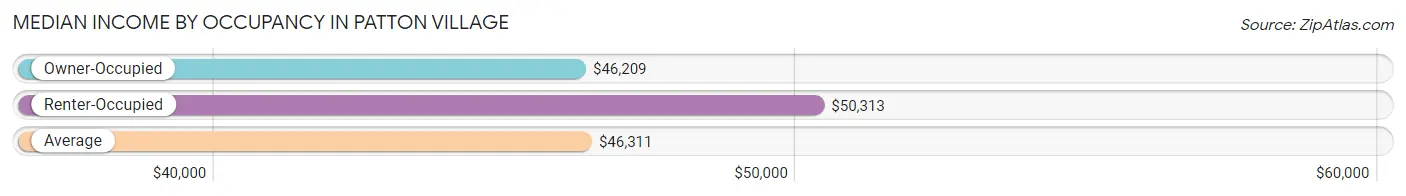
| Occupancy Type | # Households | Median Income |
| Owner-Occupied | 181 (74.2%) | $46,209 |
| Renter-Occupied | 63 (25.8%) | $50,313 |
| Average | 244 (100.0%) | $46,311 |
Occupancy by Householder Income Bracket in Patton Village
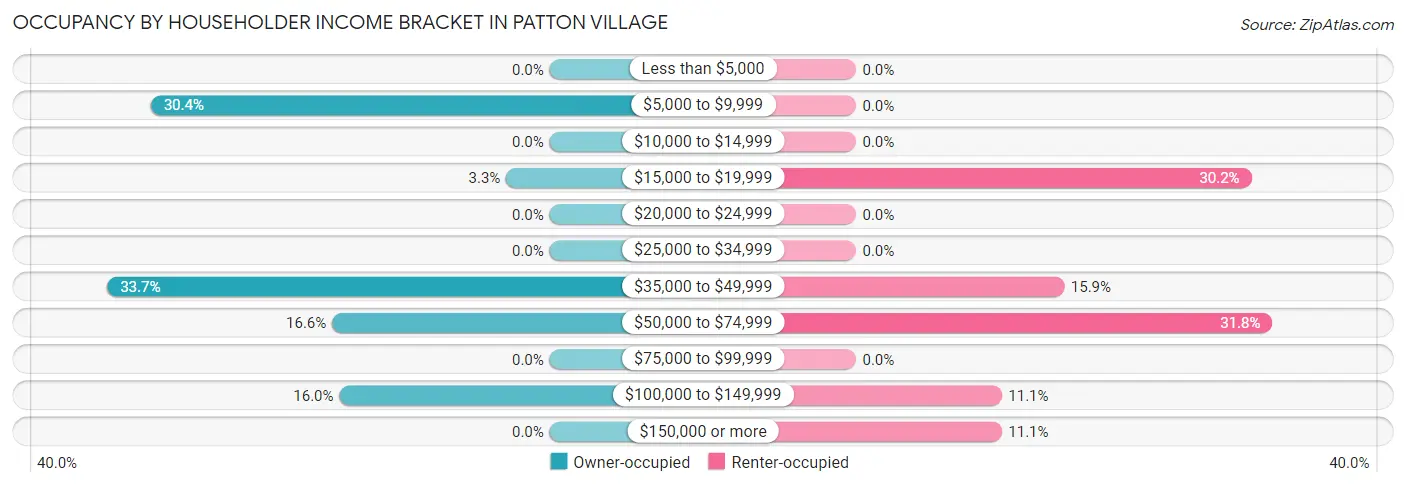
| Income Bracket | Owner-occupied | Renter-occupied |
| Less than $5,000 | 0 (0.0%) | 0 (0.0%) |
| $5,000 to $9,999 | 55 (30.4%) | 0 (0.0%) |
| $10,000 to $14,999 | 0 (0.0%) | 0 (0.0%) |
| $15,000 to $19,999 | 6 (3.3%) | 19 (30.2%) |
| $20,000 to $24,999 | 0 (0.0%) | 0 (0.0%) |
| $25,000 to $34,999 | 0 (0.0%) | 0 (0.0%) |
| $35,000 to $49,999 | 61 (33.7%) | 10 (15.9%) |
| $50,000 to $74,999 | 30 (16.6%) | 20 (31.8%) |
| $75,000 to $99,999 | 0 (0.0%) | 0 (0.0%) |
| $100,000 to $149,999 | 29 (16.0%) | 7 (11.1%) |
| $150,000 or more | 0 (0.0%) | 7 (11.1%) |
| Total | 181 (100.0%) | 63 (100.0%) |
Monthly Housing Cost Tiers in Patton Village
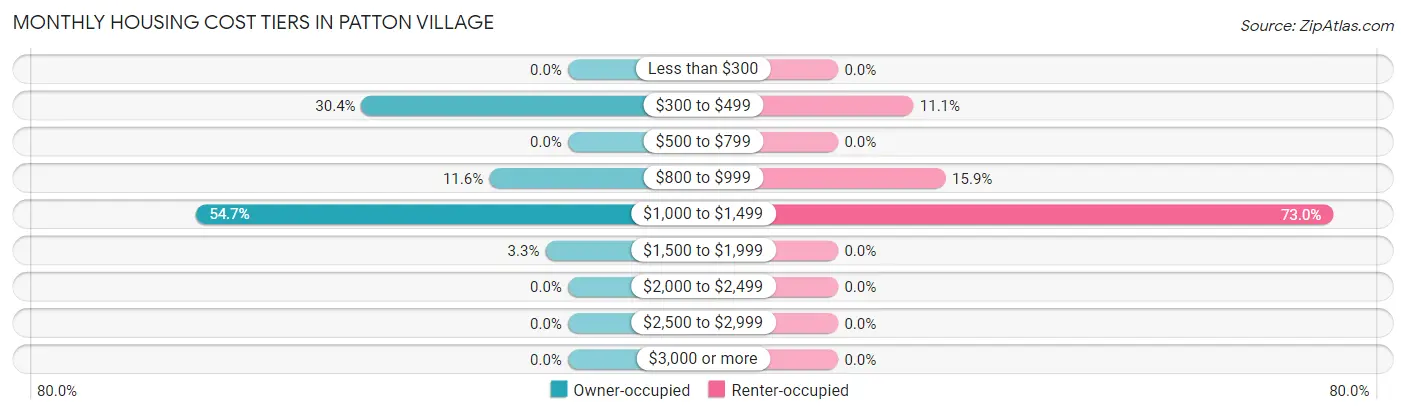
| Monthly Cost | Owner-occupied | Renter-occupied |
| Less than $300 | 0 (0.0%) | 0 (0.0%) |
| $300 to $499 | 55 (30.4%) | 7 (11.1%) |
| $500 to $799 | 0 (0.0%) | 0 (0.0%) |
| $800 to $999 | 21 (11.6%) | 10 (15.9%) |
| $1,000 to $1,499 | 99 (54.7%) | 46 (73.0%) |
| $1,500 to $1,999 | 6 (3.3%) | 0 (0.0%) |
| $2,000 to $2,499 | 0 (0.0%) | 0 (0.0%) |
| $2,500 to $2,999 | 0 (0.0%) | 0 (0.0%) |
| $3,000 or more | 0 (0.0%) | 0 (0.0%) |
| Total | 181 (100.0%) | 63 (100.0%) |
Physical Housing Characteristics in Patton Village
Housing Structures in Patton Village
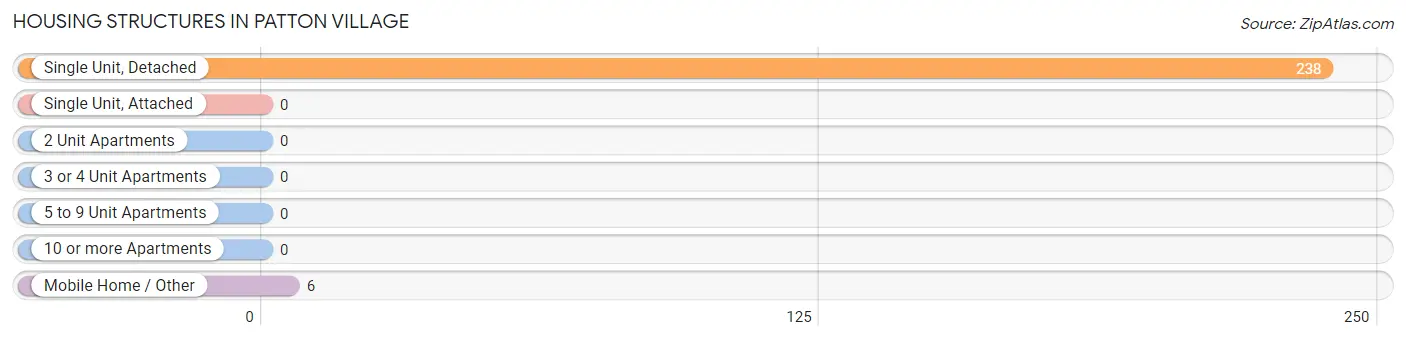
| Structure Type | # Housing Units | % Housing Units |
| Single Unit, Detached | 238 | 97.5% |
| Single Unit, Attached | 0 | 0.0% |
| 2 Unit Apartments | 0 | 0.0% |
| 3 or 4 Unit Apartments | 0 | 0.0% |
| 5 to 9 Unit Apartments | 0 | 0.0% |
| 10 or more Apartments | 0 | 0.0% |
| Mobile Home / Other | 6 | 2.5% |
| Total | 244 | 100.0% |
Housing Structures by Occupancy in Patton Village
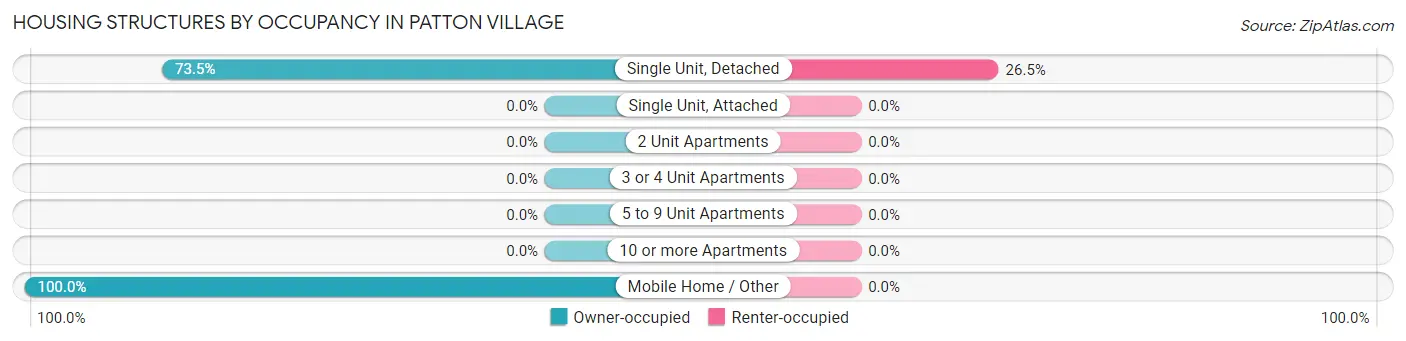
| Structure Type | Owner-occupied | Renter-occupied |
| Single Unit, Detached | 175 (73.5%) | 63 (26.5%) |
| Single Unit, Attached | 0 (0.0%) | 0 (0.0%) |
| 2 Unit Apartments | 0 (0.0%) | 0 (0.0%) |
| 3 or 4 Unit Apartments | 0 (0.0%) | 0 (0.0%) |
| 5 to 9 Unit Apartments | 0 (0.0%) | 0 (0.0%) |
| 10 or more Apartments | 0 (0.0%) | 0 (0.0%) |
| Mobile Home / Other | 6 (100.0%) | 0 (0.0%) |
| Total | 181 (74.2%) | 63 (25.8%) |
Housing Structures by Number of Rooms in Patton Village
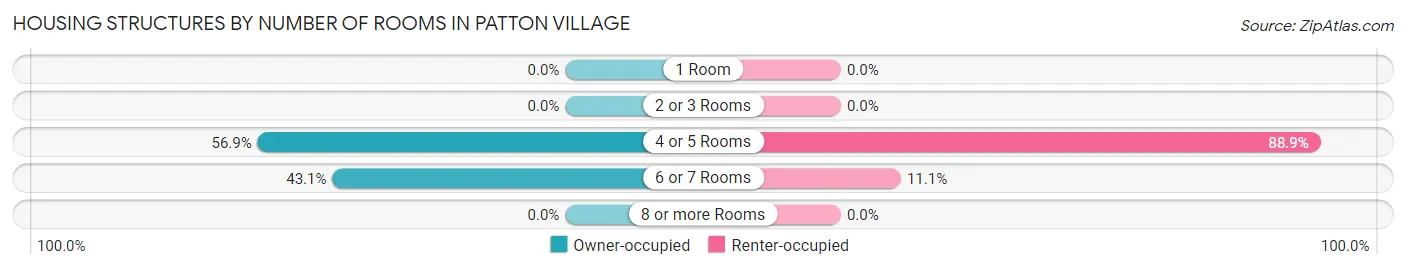
| Number of Rooms | Owner-occupied | Renter-occupied |
| 1 Room | 0 (0.0%) | 0 (0.0%) |
| 2 or 3 Rooms | 0 (0.0%) | 0 (0.0%) |
| 4 or 5 Rooms | 103 (56.9%) | 56 (88.9%) |
| 6 or 7 Rooms | 78 (43.1%) | 7 (11.1%) |
| 8 or more Rooms | 0 (0.0%) | 0 (0.0%) |
| Total | 181 (100.0%) | 63 (100.0%) |
Housing Structure by Heating Type in Patton Village
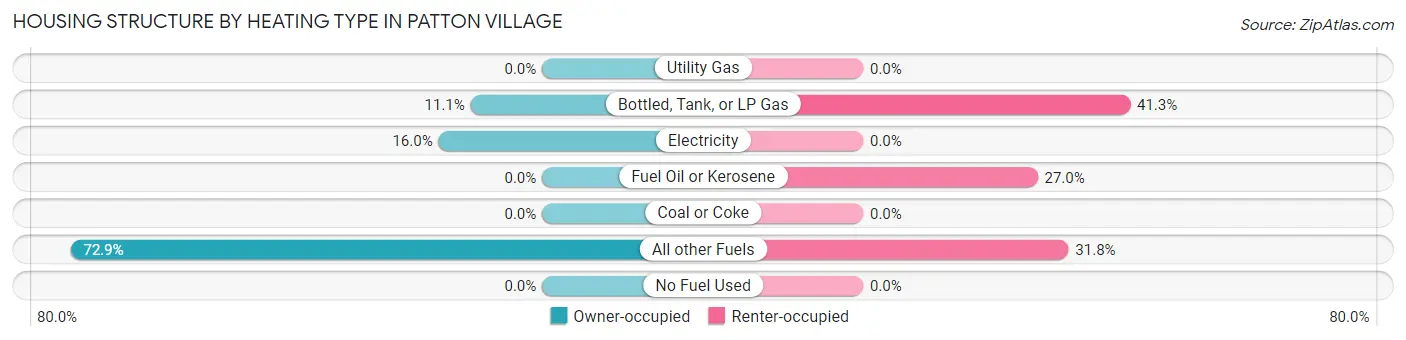
| Heating Type | Owner-occupied | Renter-occupied |
| Utility Gas | 0 (0.0%) | 0 (0.0%) |
| Bottled, Tank, or LP Gas | 20 (11.1%) | 26 (41.3%) |
| Electricity | 29 (16.0%) | 0 (0.0%) |
| Fuel Oil or Kerosene | 0 (0.0%) | 17 (27.0%) |
| Coal or Coke | 0 (0.0%) | 0 (0.0%) |
| All other Fuels | 132 (72.9%) | 20 (31.8%) |
| No Fuel Used | 0 (0.0%) | 0 (0.0%) |
| Total | 181 (100.0%) | 63 (100.0%) |
Household Vehicle Usage in Patton Village
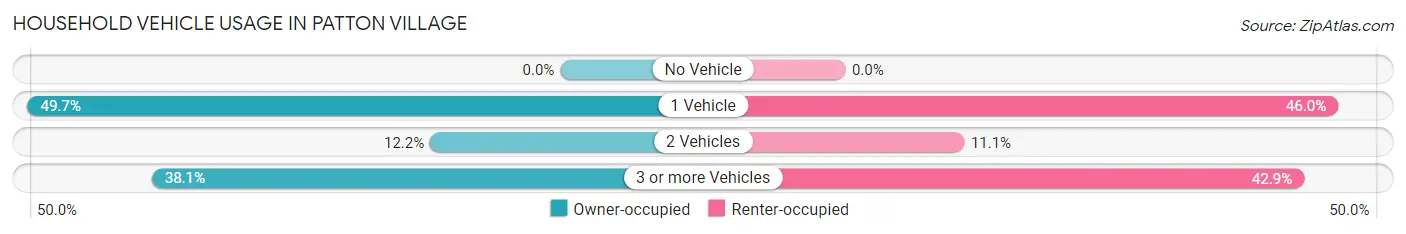
| Vehicles per Household | Owner-occupied | Renter-occupied |
| No Vehicle | 0 (0.0%) | 0 (0.0%) |
| 1 Vehicle | 90 (49.7%) | 29 (46.0%) |
| 2 Vehicles | 22 (12.1%) | 7 (11.1%) |
| 3 or more Vehicles | 69 (38.1%) | 27 (42.9%) |
| Total | 181 (100.0%) | 63 (100.0%) |
Real Estate & Mortgages in Patton Village
Real Estate and Mortgage Overview in Patton Village
| Characteristic | Without Mortgage | With Mortgage |
| Housing Units | 69 | 112 |
| Median Property Value | $66,300 | $66,700 |
| Median Household Income | - | - |
| Monthly Housing Costs | $381 | $0 |
| Real Estate Taxes | - | - |
Property Value by Mortgage Status in Patton Village
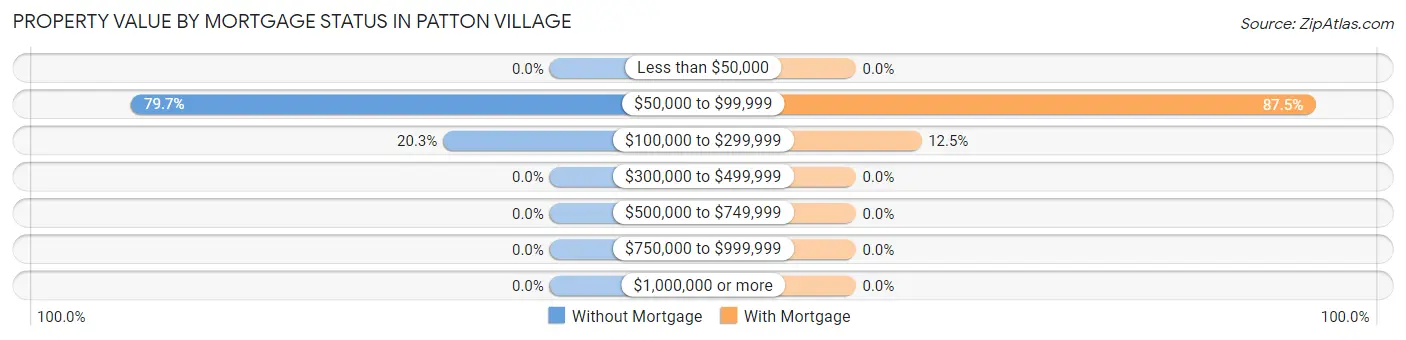
| Property Value | Without Mortgage | With Mortgage |
| Less than $50,000 | 0 (0.0%) | 0 (0.0%) |
| $50,000 to $99,999 | 55 (79.7%) | 98 (87.5%) |
| $100,000 to $299,999 | 14 (20.3%) | 14 (12.5%) |
| $300,000 to $499,999 | 0 (0.0%) | 0 (0.0%) |
| $500,000 to $749,999 | 0 (0.0%) | 0 (0.0%) |
| $750,000 to $999,999 | 0 (0.0%) | 0 (0.0%) |
| $1,000,000 or more | 0 (0.0%) | 0 (0.0%) |
| Total | 69 (100.0%) | 112 (100.0%) |
Household Income by Mortgage Status in Patton Village
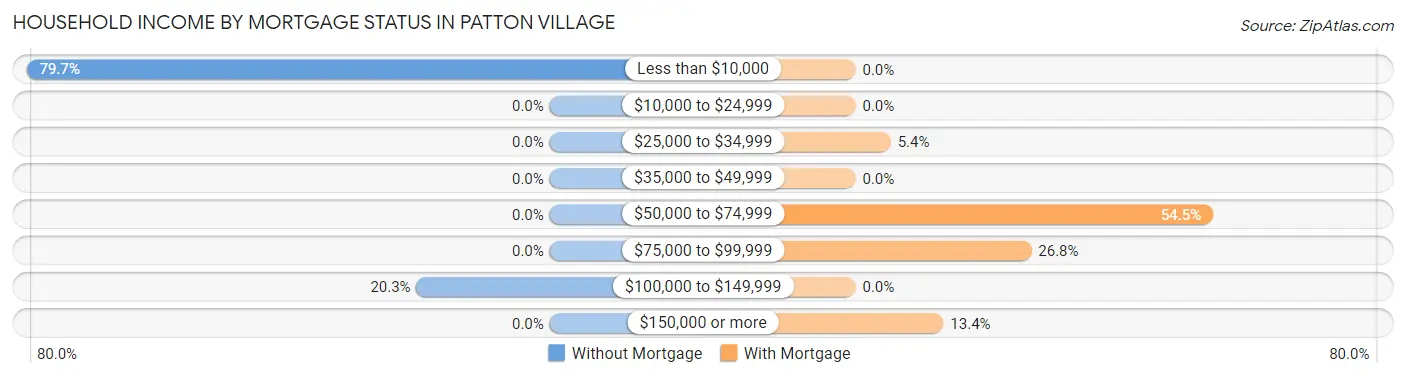
| Household Income | Without Mortgage | With Mortgage |
| Less than $10,000 | 55 (79.7%) | 0 (0.0%) |
| $10,000 to $24,999 | 0 (0.0%) | 0 (0.0%) |
| $25,000 to $34,999 | 0 (0.0%) | 6 (5.4%) |
| $35,000 to $49,999 | 0 (0.0%) | 0 (0.0%) |
| $50,000 to $74,999 | 0 (0.0%) | 61 (54.5%) |
| $75,000 to $99,999 | 0 (0.0%) | 30 (26.8%) |
| $100,000 to $149,999 | 14 (20.3%) | 0 (0.0%) |
| $150,000 or more | 0 (0.0%) | 15 (13.4%) |
| Total | 69 (100.0%) | 112 (100.0%) |
Property Value to Household Income Ratio in Patton Village
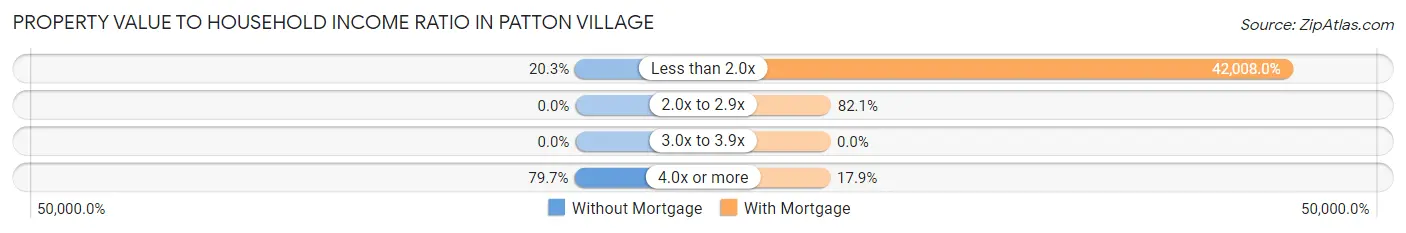
| Value-to-Income Ratio | Without Mortgage | With Mortgage |
| Less than 2.0x | 14 (20.3%) | 47,049 (42,008.0%) |
| 2.0x to 2.9x | 0 (0.0%) | 92 (82.1%) |
| 3.0x to 3.9x | 0 (0.0%) | 0 (0.0%) |
| 4.0x or more | 55 (79.7%) | 20 (17.9%) |
| Total | 69 (100.0%) | 112 (100.0%) |
Real Estate Taxes by Mortgage Status in Patton Village
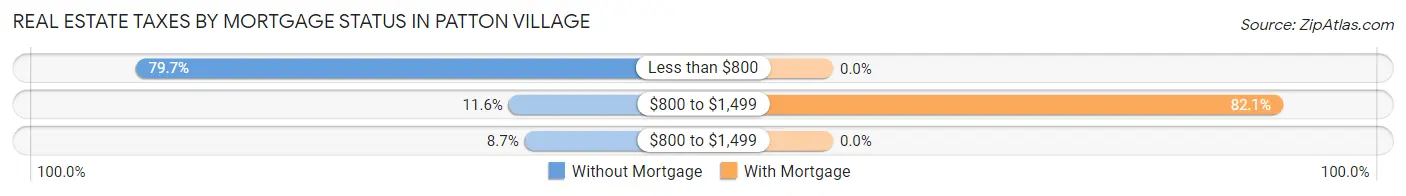
| Property Taxes | Without Mortgage | With Mortgage |
| Less than $800 | 55 (79.7%) | 0 (0.0%) |
| $800 to $1,499 | 8 (11.6%) | 92 (82.1%) |
| $800 to $1,499 | 6 (8.7%) | 0 (0.0%) |
| Total | 69 (100.0%) | 112 (100.0%) |
Health & Disability in Patton Village
Health Insurance Coverage by Age in Patton Village
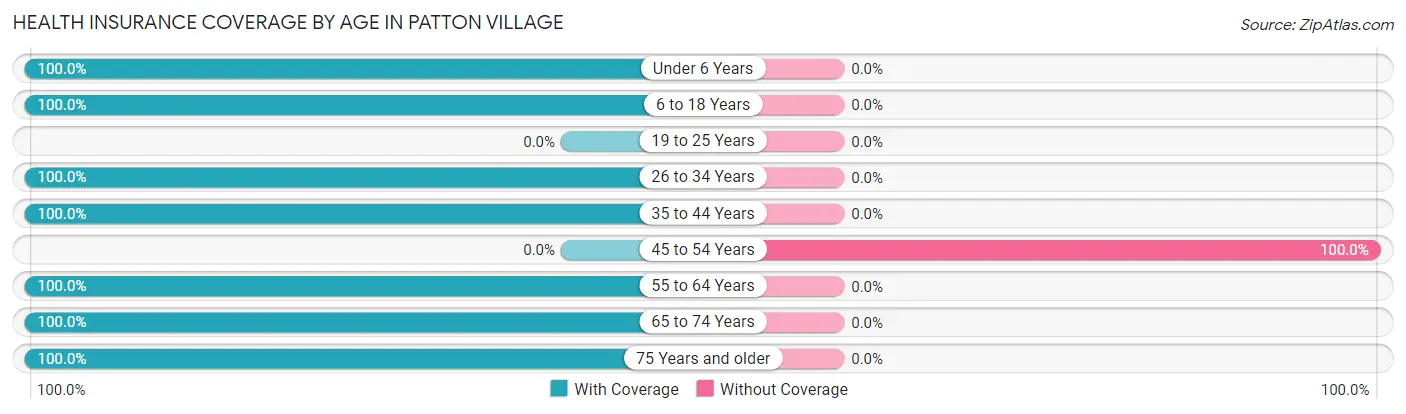
| Age Bracket | With Coverage | Without Coverage |
| Under 6 Years | 15 (100.0%) | 0 (0.0%) |
| 6 to 18 Years | 66 (100.0%) | 0 (0.0%) |
| 19 to 25 Years | 0 (0.0%) | 0 (0.0%) |
| 26 to 34 Years | 110 (100.0%) | 0 (0.0%) |
| 35 to 44 Years | 78 (100.0%) | 0 (0.0%) |
| 45 to 54 Years | 0 (0.0%) | 180 (100.0%) |
| 55 to 64 Years | 161 (100.0%) | 0 (0.0%) |
| 65 to 74 Years | 40 (100.0%) | 0 (0.0%) |
| 75 Years and older | 142 (100.0%) | 0 (0.0%) |
| Total | 612 (77.3%) | 180 (22.7%) |
Health Insurance Coverage by Citizenship Status in Patton Village
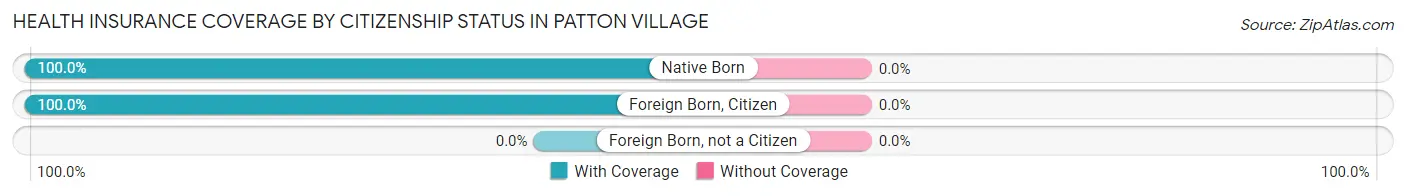
| Citizenship Status | With Coverage | Without Coverage |
| Native Born | 15 (100.0%) | 0 (0.0%) |
| Foreign Born, Citizen | 66 (100.0%) | 0 (0.0%) |
| Foreign Born, not a Citizen | 0 (0.0%) | 0 (0.0%) |
Health Insurance Coverage by Household Income in Patton Village
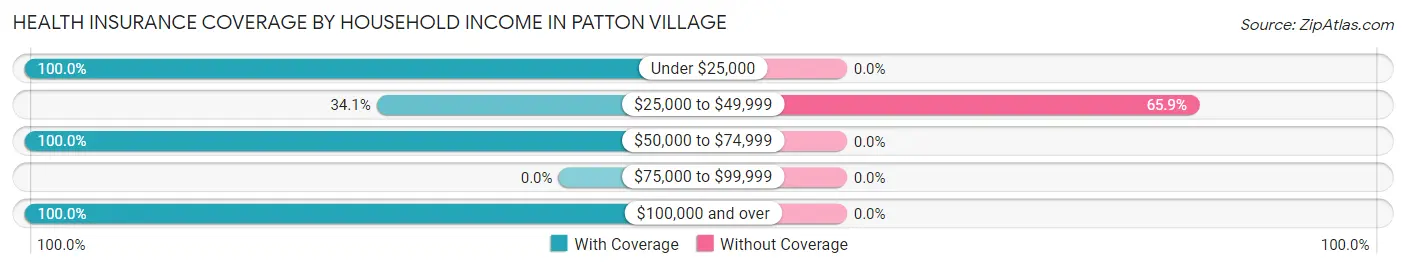
| Household Income | With Coverage | Without Coverage |
| Under $25,000 | 197 (100.0%) | 0 (0.0%) |
| $25,000 to $49,999 | 93 (34.1%) | 180 (65.9%) |
| $50,000 to $74,999 | 160 (100.0%) | 0 (0.0%) |
| $75,000 to $99,999 | 0 (0.0%) | 0 (0.0%) |
| $100,000 and over | 162 (100.0%) | 0 (0.0%) |
Public vs Private Health Insurance Coverage by Age in Patton Village
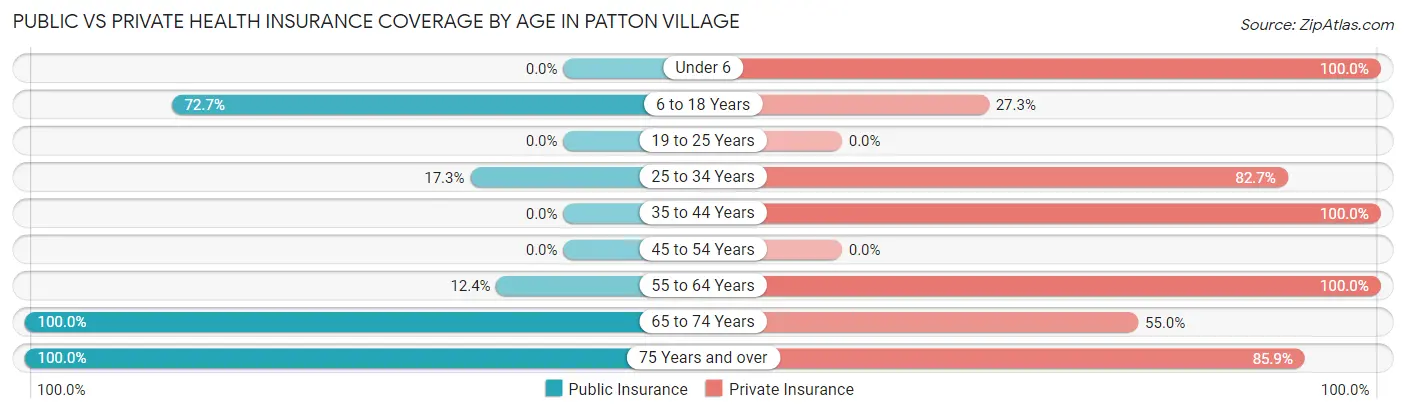
| Age Bracket | Public Insurance | Private Insurance |
| Under 6 | 0 (0.0%) | 15 (100.0%) |
| 6 to 18 Years | 48 (72.7%) | 18 (27.3%) |
| 19 to 25 Years | 0 (0.0%) | 0 (0.0%) |
| 25 to 34 Years | 19 (17.3%) | 91 (82.7%) |
| 35 to 44 Years | 0 (0.0%) | 78 (100.0%) |
| 45 to 54 Years | 0 (0.0%) | 0 (0.0%) |
| 55 to 64 Years | 20 (12.4%) | 161 (100.0%) |
| 65 to 74 Years | 40 (100.0%) | 22 (55.0%) |
| 75 Years and over | 142 (100.0%) | 122 (85.9%) |
| Total | 269 (34.0%) | 507 (64.0%) |
Disability Status by Sex by Age in Patton Village
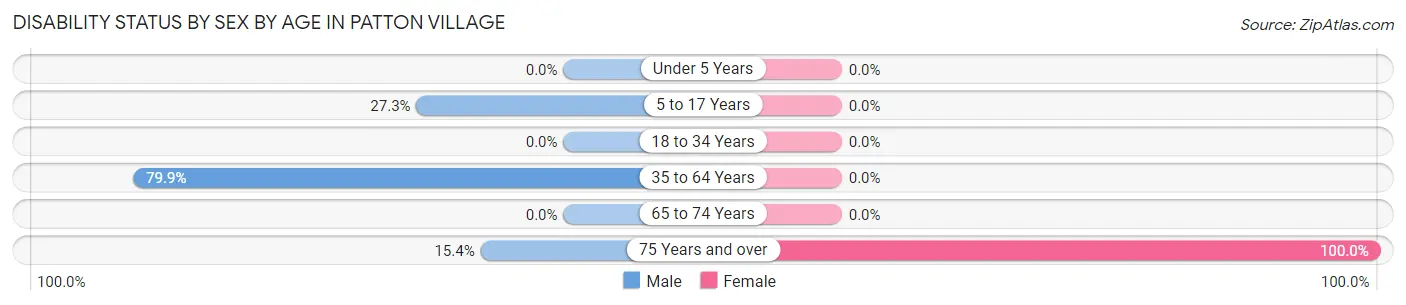
| Age Bracket | Male | Female |
| Under 5 Years | 0 (0.0%) | 0 (0.0%) |
| 5 to 17 Years | 15 (27.3%) | 0 (0.0%) |
| 18 to 34 Years | 0 (0.0%) | 0 (0.0%) |
| 35 to 64 Years | 238 (79.9%) | 0 (0.0%) |
| 65 to 74 Years | 0 (0.0%) | 0 (0.0%) |
| 75 Years and over | 10 (15.4%) | 77 (100.0%) |
Disability Class by Sex by Age in Patton Village
Disability Class: Hearing Difficulty
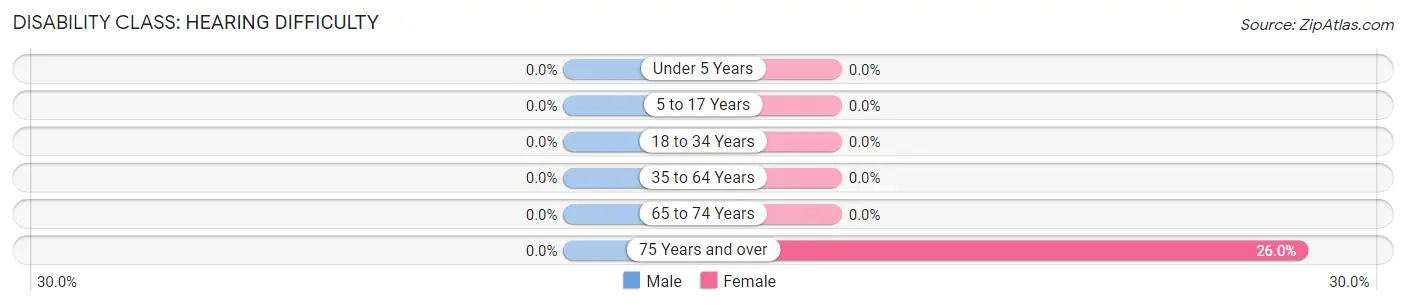
| Age Bracket | Male | Female |
| Under 5 Years | 0 (0.0%) | 0 (0.0%) |
| 5 to 17 Years | 0 (0.0%) | 0 (0.0%) |
| 18 to 34 Years | 0 (0.0%) | 0 (0.0%) |
| 35 to 64 Years | 0 (0.0%) | 0 (0.0%) |
| 65 to 74 Years | 0 (0.0%) | 0 (0.0%) |
| 75 Years and over | 0 (0.0%) | 20 (26.0%) |
Disability Class: Vision Difficulty
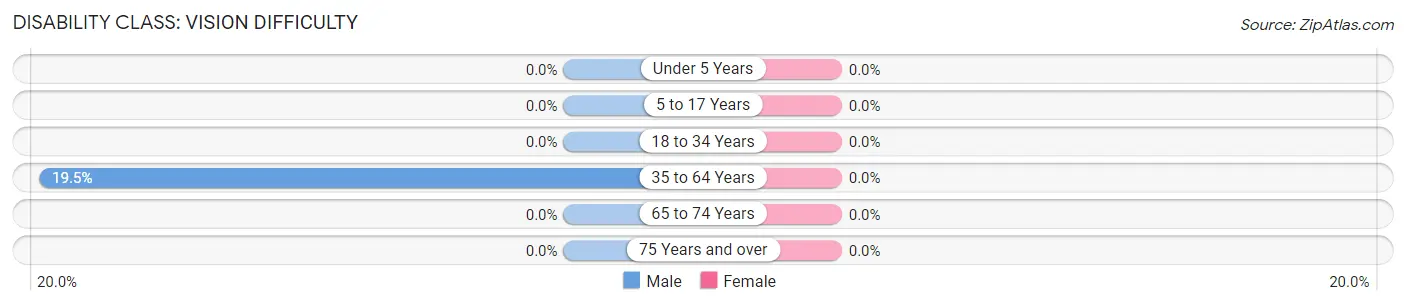
| Age Bracket | Male | Female |
| Under 5 Years | 0 (0.0%) | 0 (0.0%) |
| 5 to 17 Years | 0 (0.0%) | 0 (0.0%) |
| 18 to 34 Years | 0 (0.0%) | 0 (0.0%) |
| 35 to 64 Years | 58 (19.5%) | 0 (0.0%) |
| 65 to 74 Years | 0 (0.0%) | 0 (0.0%) |
| 75 Years and over | 0 (0.0%) | 0 (0.0%) |
Disability Class: Cognitive Difficulty
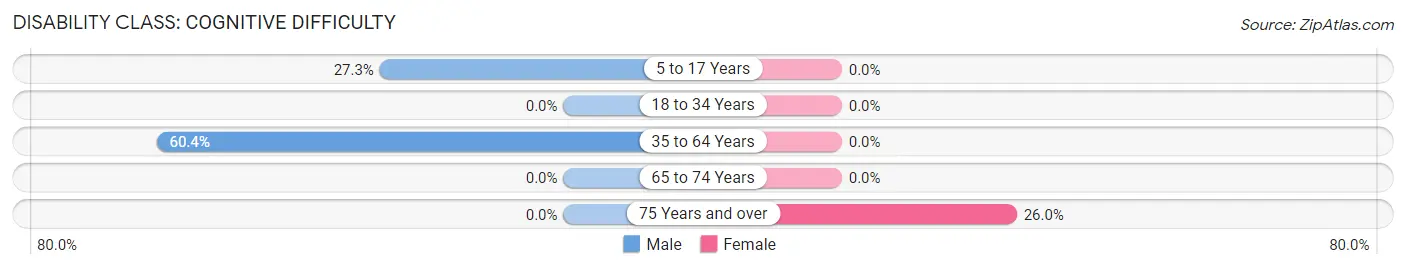
| Age Bracket | Male | Female |
| 5 to 17 Years | 15 (27.3%) | 0 (0.0%) |
| 18 to 34 Years | 0 (0.0%) | 0 (0.0%) |
| 35 to 64 Years | 180 (60.4%) | 0 (0.0%) |
| 65 to 74 Years | 0 (0.0%) | 0 (0.0%) |
| 75 Years and over | 0 (0.0%) | 20 (26.0%) |
Disability Class: Ambulatory Difficulty
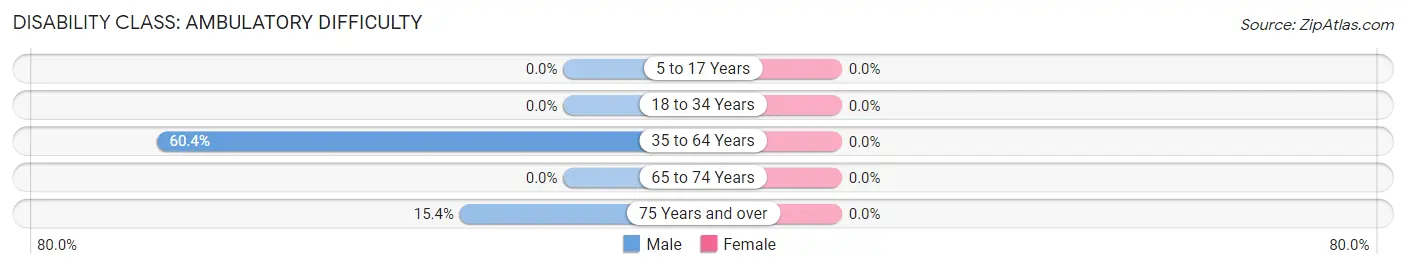
| Age Bracket | Male | Female |
| 5 to 17 Years | 0 (0.0%) | 0 (0.0%) |
| 18 to 34 Years | 0 (0.0%) | 0 (0.0%) |
| 35 to 64 Years | 180 (60.4%) | 0 (0.0%) |
| 65 to 74 Years | 0 (0.0%) | 0 (0.0%) |
| 75 Years and over | 10 (15.4%) | 0 (0.0%) |
Disability Class: Self-Care Difficulty
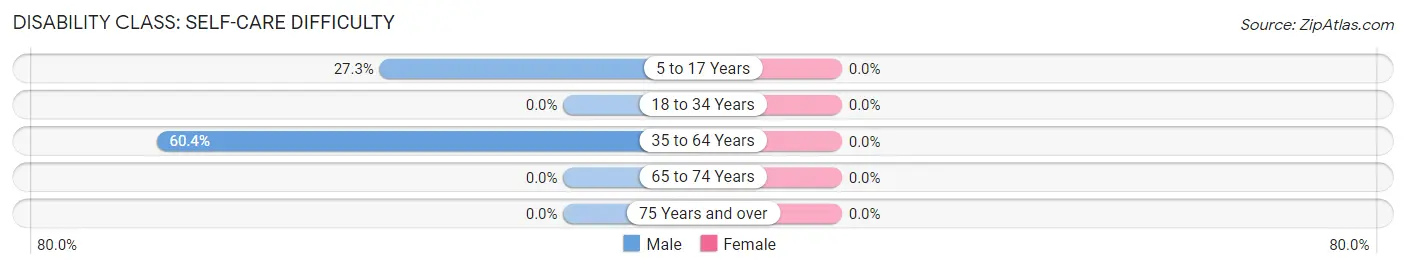
| Age Bracket | Male | Female |
| 5 to 17 Years | 15 (27.3%) | 0 (0.0%) |
| 18 to 34 Years | 0 (0.0%) | 0 (0.0%) |
| 35 to 64 Years | 180 (60.4%) | 0 (0.0%) |
| 65 to 74 Years | 0 (0.0%) | 0 (0.0%) |
| 75 Years and over | 0 (0.0%) | 0 (0.0%) |
Technology Access in Patton Village
Computing Device Access in Patton Village
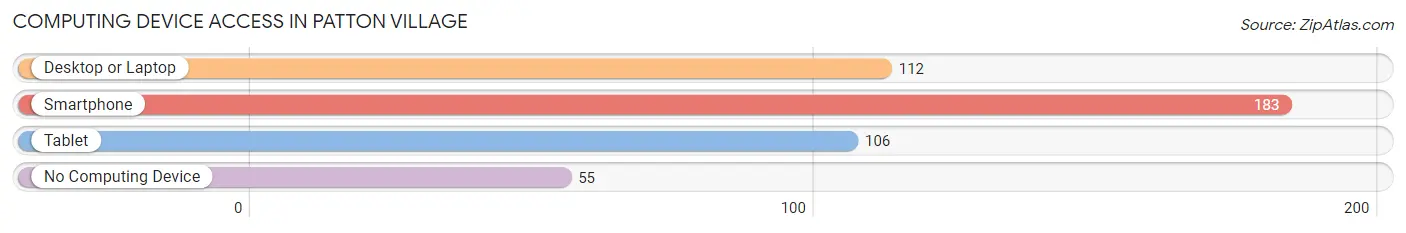
| Device Type | # Households | % Households |
| Desktop or Laptop | 112 | 45.9% |
| Smartphone | 183 | 75.0% |
| Tablet | 106 | 43.4% |
| No Computing Device | 55 | 22.5% |
| Total | 244 | 100.0% |
Internet Access in Patton Village
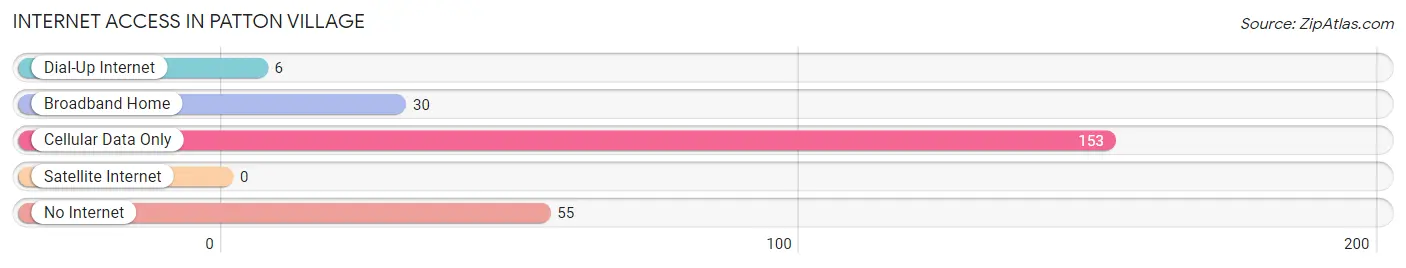
| Internet Type | # Households | % Households |
| Dial-Up Internet | 6 | 2.5% |
| Broadband Home | 30 | 12.3% |
| Cellular Data Only | 153 | 62.7% |
| Satellite Internet | 0 | 0.0% |
| No Internet | 55 | 22.5% |
| Total | 244 | 100.0% |
Patton Village Summary
Patton Village is a small town located in Montgomery County, Texas, United States. It is situated on the banks of Lake Conroe, approximately 40 miles north of Houston. The town was founded in the late 1800s by William Patton, a former Confederate soldier, and was named after him. The population of Patton Village was 1,845 at the 2010 census.
History
Patton Village was founded in the late 1800s by William Patton, a former Confederate soldier. He purchased land in the area and began to develop it into a small town. The town was named after him and was incorporated in the early 1900s.
The town grew slowly over the years, but it was not until the 1950s that it began to experience significant growth. This was due to the construction of Lake Conroe, which provided a source of recreation and economic development for the area.
In the 1970s, the town experienced a period of rapid growth as the population increased from 1,000 to over 4,000. This growth was largely due to the influx of people from Houston and other nearby cities.
Geography
Patton Village is located in Montgomery County, Texas, approximately 40 miles north of Houston. It is situated on the banks of Lake Conroe, which is a popular recreational area. The town is surrounded by forests and is home to several parks and nature preserves.
The climate in Patton Village is humid subtropical, with hot summers and mild winters. The average annual temperature is around 70 degrees Fahrenheit.
Economy
The economy of Patton Village is largely based on tourism and recreation. The town is home to several parks and nature preserves, as well as Lake Conroe, which is a popular destination for fishing, boating, and other outdoor activities.
In addition, Patton Village is home to several businesses, including restaurants, retail stores, and other services. The town also has a small manufacturing sector, which produces a variety of products, including furniture and clothing.
Demographics
As of the 2010 census, the population of Patton Village was 1,845. The racial makeup of the town was 79.3% White, 15.2% African American, 0.7% Native American, 0.7% Asian, 0.1% Pacific Islander, and 3.9% from other races.
The median household income in Patton Village was $45,938, and the median family income was $50,938. The per capita income was $20,938. The town had a poverty rate of 16.3%.
Conclusion
Patton Village is a small town located in Montgomery County, Texas, United States. It was founded in the late 1800s by William Patton, a former Confederate soldier, and was named after him. The town has experienced significant growth over the years, largely due to the construction of Lake Conroe and the influx of people from nearby cities. The economy of Patton Village is largely based on tourism and recreation, and the town is home to several businesses, parks, and nature preserves. As of the 2010 census, the population of Patton Village was 1,845.
Common Questions
What is Per Capita Income in Patton Village?
Per Capita income in Patton Village is $19,360.
What is the Median Household income in Patton Village?
Median Household Income in Patton Village is $46,311.
What is Inequality or Gini Index in Patton Village?
Inequality or Gini Index in Patton Village is 0.45.
What is the Total Population of Patton Village?
Total Population of Patton Village is 792.
What is the Total Male Population of Patton Village?
Total Male Population of Patton Village is 524.
What is the Total Female Population of Patton Village?
Total Female Population of Patton Village is 268.
What is the Ratio of Males per 100 Females in Patton Village?
There are 195.52 Males per 100 Females in Patton Village.
What is the Ratio of Females per 100 Males in Patton Village?
There are 51.15 Females per 100 Males in Patton Village.
What is the Median Population Age in Patton Village?
Median Population Age in Patton Village is 45.7 Years.
What is the Average Family Size in Patton Village
Average Family Size in Patton Village is 3.0 People.
What is the Average Household Size in Patton Village
Average Household Size in Patton Village is 3.2 People.
How Large is the Labor Force in Patton Village?
There are 241 People in the Labor Forcein in Patton Village.
What is the Percentage of People in the Labor Force in Patton Village?
33.1% of People are in the Labor Force in Patton Village.
What is the Unemployment Rate in Patton Village?
Unemployment Rate in Patton Village is 24.1%.