Cities with the Highest Percentage of South American Population in California
RELATED REPORTS & OPTIONS
South American
California
Compare Cities
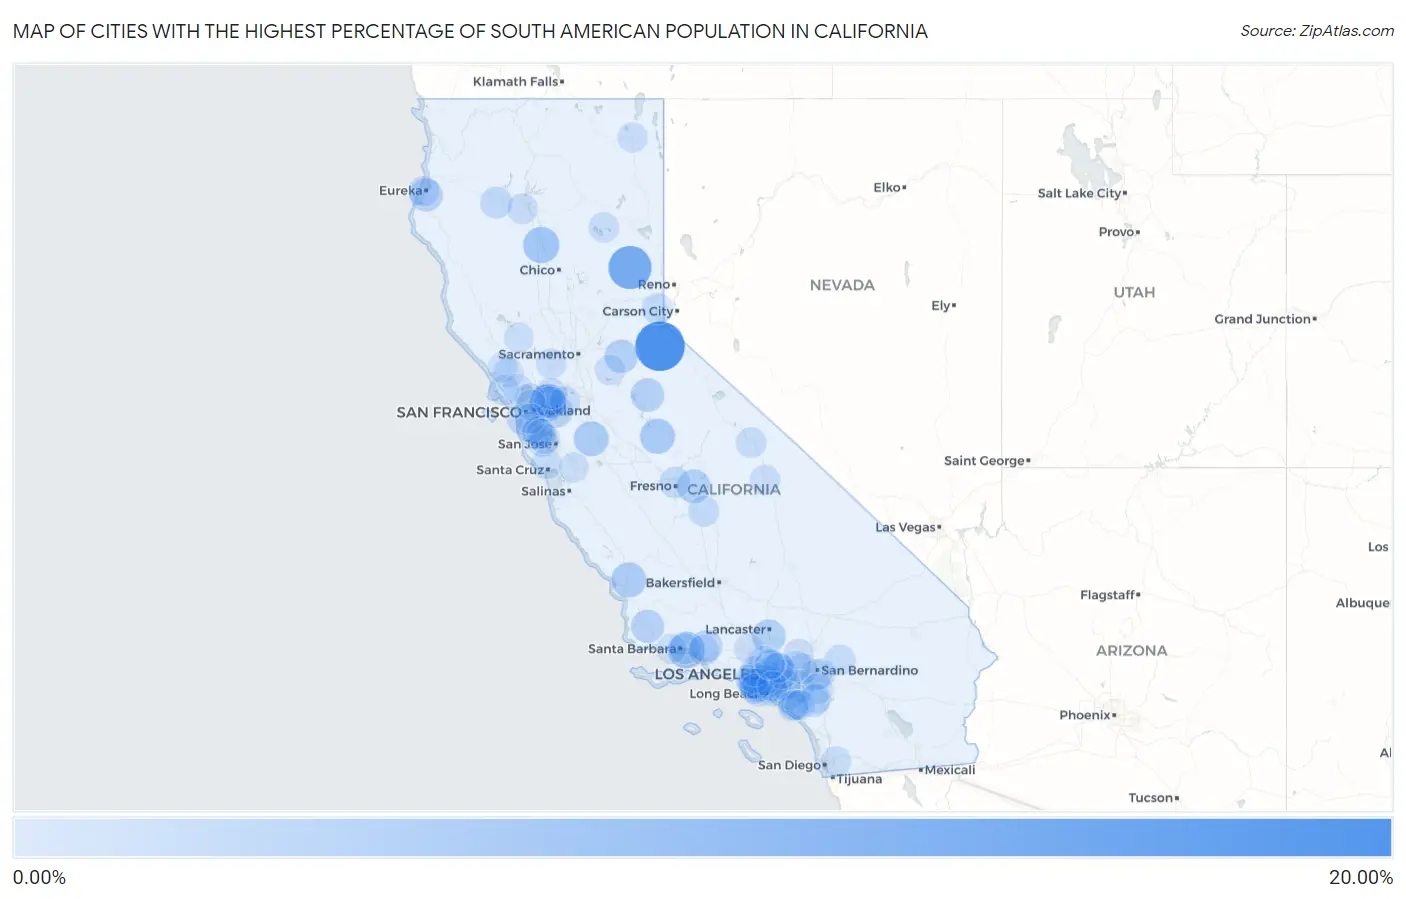
Map of Cities with the Highest Percentage of South American Population in California
0.00%
20.00%
Cities with the Highest Percentage of South American Population in California
| City | South American | vs State | vs National | |
| 1. | Kirkwood | 18.88% | 1.01%(+17.9)#1 | 1.28%(+17.6)#64 |
| 2. | Clio | 13.10% | 1.01%(+12.1)#2 | 1.28%(+11.8)#136 |
| 3. | El Macero | 8.98% | 1.01%(+7.97)#3 | 1.28%(+7.70)#251 |
| 4. | Shell Ridge | 8.17% | 1.01%(+7.15)#4 | 1.28%(+6.88)#291 |
| 5. | Summerland | 7.46% | 1.01%(+6.45)#5 | 1.28%(+6.17)#336 |
| 6. | Gerber | 7.10% | 1.01%(+6.09)#6 | 1.28%(+5.82)#361 |
| 7. | Strawberry Cdp Marin County | 6.98% | 1.01%(+5.97)#7 | 1.28%(+5.69)#370 |
| 8. | Catheys Valley | 6.22% | 1.01%(+5.21)#8 | 1.28%(+4.94)#445 |
| 9. | Garden Farms | 5.95% | 1.01%(+4.94)#9 | 1.28%(+4.66)#486 |
| 10. | Diablo Grande | 5.89% | 1.01%(+4.88)#10 | 1.28%(+4.60)#492 |
| 11. | Minkler | 4.98% | 1.01%(+3.97)#11 | 1.28%(+3.69)#610 |
| 12. | Desert View Highlands | 4.98% | 1.01%(+3.97)#12 | 1.28%(+3.69)#611 |
| 13. | Lawndale | 4.83% | 1.01%(+3.82)#13 | 1.28%(+3.55)#635 |
| 14. | Mono Vista | 4.72% | 1.01%(+3.71)#14 | 1.28%(+3.44)#663 |
| 15. | River Pines | 4.72% | 1.01%(+3.71)#15 | 1.28%(+3.44)#665 |
| 16. | Pine Hills | 4.50% | 1.01%(+3.49)#16 | 1.28%(+3.22)#707 |
| 17. | Los Alamos | 4.44% | 1.01%(+3.43)#17 | 1.28%(+3.15)#723 |
| 18. | Harmony Grove | 4.36% | 1.01%(+3.35)#18 | 1.28%(+3.08)#739 |
| 19. | Del Aire | 4.35% | 1.01%(+3.34)#19 | 1.28%(+3.07)#743 |
| 20. | Camino Tassajara | 4.23% | 1.01%(+3.22)#20 | 1.28%(+2.95)#783 |
| 21. | Contra Costa Centre | 4.07% | 1.01%(+3.06)#21 | 1.28%(+2.78)#831 |
| 22. | Ojai | 3.93% | 1.01%(+2.92)#22 | 1.28%(+2.65)#870 |
| 23. | Sonoma State University | 3.87% | 1.01%(+2.86)#23 | 1.28%(+2.58)#890 |
| 24. | Camp Pendleton Mainside | 3.52% | 1.01%(+2.51)#24 | 1.28%(+2.24)#995 |
| 25. | South Monrovia Island | 3.50% | 1.01%(+2.49)#25 | 1.28%(+2.21)#1,008 |
| 26. | North Gate | 3.44% | 1.01%(+2.43)#26 | 1.28%(+2.16)#1,026 |
| 27. | North Fair Oaks | 3.41% | 1.01%(+2.40)#27 | 1.28%(+2.13)#1,040 |
| 28. | Broadmoor | 3.39% | 1.01%(+2.38)#28 | 1.28%(+2.11)#1,045 |
| 29. | Douglas City | 3.35% | 1.01%(+2.34)#29 | 1.28%(+2.07)#1,063 |
| 30. | Marina Del Rey | 3.13% | 1.01%(+2.12)#30 | 1.28%(+1.85)#1,148 |
| 31. | North Tustin | 3.12% | 1.01%(+2.11)#31 | 1.28%(+1.84)#1,155 |
| 32. | Lakeland Village | 3.06% | 1.01%(+2.05)#32 | 1.28%(+1.77)#1,194 |
| 33. | La Palma | 2.94% | 1.01%(+1.93)#33 | 1.28%(+1.66)#1,244 |
| 34. | Old Fig Garden | 2.93% | 1.01%(+1.92)#34 | 1.28%(+1.65)#1,257 |
| 35. | Dollar Point | 2.92% | 1.01%(+1.91)#35 | 1.28%(+1.64)#1,261 |
| 36. | Coronita | 2.91% | 1.01%(+1.89)#36 | 1.28%(+1.62)#1,269 |
| 37. | Patterson Tract | 2.80% | 1.01%(+1.79)#37 | 1.28%(+1.51)#1,329 |
| 38. | Placentia | 2.79% | 1.01%(+1.78)#38 | 1.28%(+1.51)#1,333 |
| 39. | East Whittier | 2.79% | 1.01%(+1.78)#39 | 1.28%(+1.51)#1,335 |
| 40. | Downey | 2.72% | 1.01%(+1.71)#40 | 1.28%(+1.44)#1,378 |
| 41. | Loma Linda | 2.64% | 1.01%(+1.63)#41 | 1.28%(+1.35)#1,413 |
| 42. | Big Bear Lake | 2.61% | 1.01%(+1.60)#42 | 1.28%(+1.33)#1,427 |
| 43. | La Crescenta Montrose | 2.57% | 1.01%(+1.56)#43 | 1.28%(+1.29)#1,448 |
| 44. | Bay Point | 2.57% | 1.01%(+1.56)#44 | 1.28%(+1.29)#1,449 |
| 45. | Los Altos Hills | 2.57% | 1.01%(+1.56)#45 | 1.28%(+1.29)#1,451 |
| 46. | Mount Hermon | 2.56% | 1.01%(+1.54)#46 | 1.28%(+1.27)#1,461 |
| 47. | Montecito | 2.54% | 1.01%(+1.53)#47 | 1.28%(+1.26)#1,466 |
| 48. | El Sobrante Cdp Contra Costa County | 2.54% | 1.01%(+1.53)#48 | 1.28%(+1.26)#1,467 |
| 49. | Grand Terrace | 2.54% | 1.01%(+1.53)#49 | 1.28%(+1.26)#1,468 |
| 50. | Mayflower Village | 2.50% | 1.01%(+1.48)#50 | 1.28%(+1.21)#1,497 |
| 51. | Rossmoor | 2.49% | 1.01%(+1.48)#51 | 1.28%(+1.20)#1,504 |
| 52. | Oak View | 2.47% | 1.01%(+1.46)#52 | 1.28%(+1.19)#1,513 |
| 53. | San Pablo | 2.45% | 1.01%(+1.44)#53 | 1.28%(+1.17)#1,527 |
| 54. | San Mateo | 2.44% | 1.01%(+1.43)#54 | 1.28%(+1.16)#1,532 |
| 55. | Lomita | 2.44% | 1.01%(+1.43)#55 | 1.28%(+1.16)#1,536 |
| 56. | La Canada Flintridge | 2.44% | 1.01%(+1.43)#56 | 1.28%(+1.16)#1,538 |
| 57. | Walnut Park | 2.44% | 1.01%(+1.43)#57 | 1.28%(+1.15)#1,542 |
| 58. | Culver City | 2.41% | 1.01%(+1.40)#58 | 1.28%(+1.12)#1,561 |
| 59. | Centerville | 2.40% | 1.01%(+1.39)#59 | 1.28%(+1.12)#1,562 |
| 60. | Albany | 2.40% | 1.01%(+1.39)#60 | 1.28%(+1.12)#1,564 |
| 61. | West Bishop | 2.39% | 1.01%(+1.38)#61 | 1.28%(+1.10)#1,576 |
| 62. | Rancho Cucamonga | 2.38% | 1.01%(+1.37)#62 | 1.28%(+1.10)#1,582 |
| 63. | Mead Valley | 2.37% | 1.01%(+1.36)#63 | 1.28%(+1.09)#1,594 |
| 64. | Fairhaven | 2.35% | 1.01%(+1.34)#64 | 1.28%(+1.06)#1,611 |
| 65. | Allendale | 2.28% | 1.01%(+1.27)#65 | 1.28%(+1.000)#1,646 |
| 66. | Clear Creek | 2.28% | 1.01%(+1.27)#66 | 1.28%(+0.997)#1,647 |
| 67. | Brentwood | 2.26% | 1.01%(+1.25)#67 | 1.28%(+0.976)#1,665 |
| 68. | Aliso Viejo | 2.25% | 1.01%(+1.24)#68 | 1.28%(+0.968)#1,671 |
| 69. | Hawthorne | 2.25% | 1.01%(+1.24)#69 | 1.28%(+0.963)#1,676 |
| 70. | West Covina | 2.24% | 1.01%(+1.23)#70 | 1.28%(+0.956)#1,682 |
| 71. | El Segundo | 2.22% | 1.01%(+1.21)#71 | 1.28%(+0.942)#1,695 |
| 72. | Mission Viejo | 2.20% | 1.01%(+1.19)#72 | 1.28%(+0.919)#1,717 |
| 73. | Ione | 2.20% | 1.01%(+1.19)#73 | 1.28%(+0.917)#1,719 |
| 74. | Beverly Hills | 2.17% | 1.01%(+1.16)#74 | 1.28%(+0.889)#1,736 |
| 75. | Alturas | 2.16% | 1.01%(+1.15)#75 | 1.28%(+0.879)#1,747 |
| 76. | San Antonio Heights | 2.13% | 1.01%(+1.11)#76 | 1.28%(+0.842)#1,773 |
| 77. | Independence | 2.12% | 1.01%(+1.11)#77 | 1.28%(+0.835)#1,783 |
| 78. | Monrovia | 2.12% | 1.01%(+1.11)#78 | 1.28%(+0.833)#1,785 |
| 79. | Torrance | 2.11% | 1.01%(+1.10)#79 | 1.28%(+0.827)#1,798 |
| 80. | Redwood City | 2.10% | 1.01%(+1.09)#80 | 1.28%(+0.821)#1,801 |
| 81. | Point Reyes Station | 2.09% | 1.01%(+1.08)#81 | 1.28%(+0.806)#1,812 |
| 82. | Pasadena | 2.08% | 1.01%(+1.07)#82 | 1.28%(+0.800)#1,816 |
| 83. | Mountain View | 2.08% | 1.01%(+1.07)#83 | 1.28%(+0.796)#1,822 |
| 84. | Casa De Oro Mount Helix | 2.08% | 1.01%(+1.07)#84 | 1.28%(+0.796)#1,823 |
| 85. | Brisbane | 2.06% | 1.01%(+1.05)#85 | 1.28%(+0.777)#1,840 |
| 86. | Highlands | 2.05% | 1.01%(+1.04)#86 | 1.28%(+0.768)#1,845 |
| 87. | Cotati | 2.04% | 1.01%(+1.03)#87 | 1.28%(+0.758)#1,856 |
| 88. | Gilroy | 2.04% | 1.01%(+1.03)#88 | 1.28%(+0.753)#1,859 |
| 89. | Isla Vista | 2.03% | 1.01%(+1.02)#89 | 1.28%(+0.748)#1,868 |
| 90. | Lake Elsinore | 2.02% | 1.01%(+1.01)#90 | 1.28%(+0.740)#1,877 |
| 91. | Laguna Hills | 2.02% | 1.01%(+1.01)#91 | 1.28%(+0.738)#1,879 |
| 92. | Wrightwood | 2.02% | 1.01%(+1.01)#92 | 1.28%(+0.734)#1,884 |
| 93. | Hidden Valley Lake | 2.02% | 1.01%(+1.01)#93 | 1.28%(+0.733)#1,885 |
| 94. | Artesia | 2.01% | 1.01%(+0.997)#94 | 1.28%(+0.725)#1,893 |
| 95. | Sebastopol | 2.00% | 1.01%(+0.988)#95 | 1.28%(+0.716)#1,901 |
| 96. | Altadena | 2.00% | 1.01%(+0.986)#96 | 1.28%(+0.714)#1,903 |
| 97. | Novato | 1.98% | 1.01%(+0.965)#97 | 1.28%(+0.692)#1,921 |
| 98. | Santa Clarita | 1.96% | 1.01%(+0.946)#98 | 1.28%(+0.673)#1,938 |
| 99. | Menlo Park | 1.95% | 1.01%(+0.940)#99 | 1.28%(+0.667)#1,944 |
| 100. | Coto De Caza | 1.94% | 1.01%(+0.934)#100 | 1.28%(+0.662)#1,948 |
Common Questions
What are the Top 10 Cities with the Highest Percentage of South American Population in California?
Top 10 Cities with the Highest Percentage of South American Population in California are:
#1
18.88%
#2
13.10%
#3
8.17%
#4
7.46%
#5
7.10%
#6
6.22%
#7
5.95%
#8
5.89%
#9
4.98%
#10
4.98%
What city has the Highest Percentage of South American Population in California?
Kirkwood has the Highest Percentage of South American Population in California with 18.88%.
What is the Percentage of South American Population in the State of California?
Percentage of South American Population in California is 1.01%.
What is the Percentage of South American Population in the United States?
Percentage of South American Population in the United States is 1.28%.