Cities with the Most Immigrants from Israel in California
RELATED REPORTS & OPTIONS
Israel
California
Compare Cities
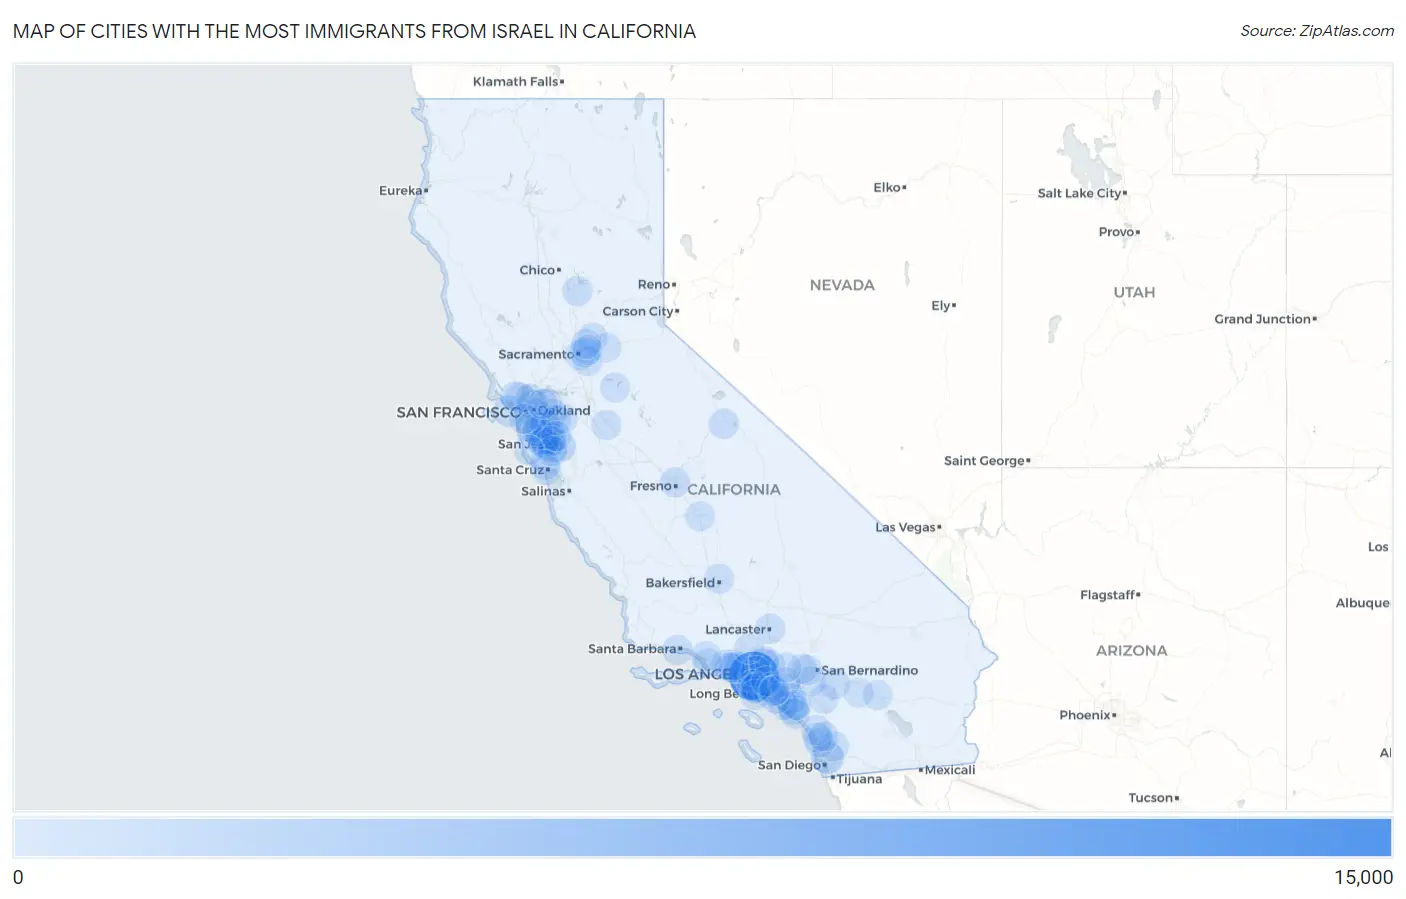
Map of Cities with the Most Immigrants from Israel in California
0
15,000
Cities with the Most Immigrants from Israel in California
| City | Israel | vs State | vs National | |
| 1. | Los Angeles | 11,800 | 33,029(35.73%)#1 | 139,089(8.48%)#2 |
| 2. | Sunnyvale | 1,749 | 33,029(5.30%)#2 | 139,089(1.26%)#3 |
| 3. | San Diego | 1,610 | 33,029(4.87%)#3 | 139,089(1.16%)#5 |
| 4. | San Jose | 1,004 | 33,029(3.04%)#4 | 139,089(0.72%)#11 |
| 5. | San Francisco | 781 | 33,029(2.36%)#5 | 139,089(0.56%)#14 |
| 6. | Irvine | 749 | 33,029(2.27%)#6 | 139,089(0.54%)#15 |
| 7. | Beverly Hills | 514 | 33,029(1.56%)#7 | 139,089(0.37%)#27 |
| 8. | Mountain View | 495 | 33,029(1.50%)#8 | 139,089(0.36%)#28 |
| 9. | West Hollywood | 452 | 33,029(1.37%)#9 | 139,089(0.32%)#32 |
| 10. | Berkeley | 368 | 33,029(1.11%)#10 | 139,089(0.26%)#41 |
| 11. | Menlo Park | 339 | 33,029(1.03%)#11 | 139,089(0.24%)#48 |
| 12. | Santa Monica | 330 | 33,029(1.00%)#12 | 139,089(0.24%)#49 |
| 13. | Culver City | 310 | 33,029(0.94%)#13 | 139,089(0.22%)#52 |
| 14. | Palo Alto | 282 | 33,029(0.85%)#14 | 139,089(0.20%)#60 |
| 15. | Anaheim | 255 | 33,029(0.77%)#15 | 139,089(0.18%)#66 |
| 16. | Mammoth Lakes | 231 | 33,029(0.70%)#16 | 139,089(0.17%)#74 |
| 17. | Calabasas | 215 | 33,029(0.65%)#17 | 139,089(0.15%)#82 |
| 18. | Thousand Oaks | 205 | 33,029(0.62%)#18 | 139,089(0.15%)#85 |
| 19. | Los Altos | 205 | 33,029(0.62%)#19 | 139,089(0.15%)#86 |
| 20. | Oakland | 198 | 33,029(0.60%)#20 | 139,089(0.14%)#89 |
| 21. | Oak Park | 193 | 33,029(0.58%)#21 | 139,089(0.14%)#91 |
| 22. | Agoura Hills | 191 | 33,029(0.58%)#22 | 139,089(0.14%)#92 |
| 23. | South San Francisco | 179 | 33,029(0.54%)#23 | 139,089(0.13%)#97 |
| 24. | Sacramento | 170 | 33,029(0.51%)#24 | 139,089(0.12%)#106 |
| 25. | Fremont | 166 | 33,029(0.50%)#25 | 139,089(0.12%)#109 |
| 26. | Cupertino | 163 | 33,029(0.49%)#26 | 139,089(0.12%)#111 |
| 27. | Livermore | 157 | 33,029(0.48%)#27 | 139,089(0.11%)#117 |
| 28. | Foster City | 157 | 33,029(0.48%)#28 | 139,089(0.11%)#119 |
| 29. | Glendale | 151 | 33,029(0.46%)#29 | 139,089(0.11%)#125 |
| 30. | San Mateo | 147 | 33,029(0.45%)#30 | 139,089(0.11%)#128 |
| 31. | Richmond | 141 | 33,029(0.43%)#31 | 139,089(0.10%)#136 |
| 32. | Long Beach | 138 | 33,029(0.42%)#32 | 139,089(0.10%)#139 |
| 33. | Lancaster | 138 | 33,029(0.42%)#33 | 139,089(0.10%)#140 |
| 34. | San Ramon | 137 | 33,029(0.41%)#34 | 139,089(0.10%)#143 |
| 35. | Laguna Niguel | 134 | 33,029(0.41%)#35 | 139,089(0.10%)#147 |
| 36. | Poway | 133 | 33,029(0.40%)#36 | 139,089(0.10%)#149 |
| 37. | Campbell | 129 | 33,029(0.39%)#37 | 139,089(0.09%)#156 |
| 38. | Redondo Beach | 118 | 33,029(0.36%)#38 | 139,089(0.08%)#170 |
| 39. | Hayward | 115 | 33,029(0.35%)#39 | 139,089(0.08%)#174 |
| 40. | Walnut Creek | 115 | 33,029(0.35%)#40 | 139,089(0.08%)#175 |
| 41. | Palermo | 115 | 33,029(0.35%)#41 | 139,089(0.08%)#176 |
| 42. | Fresno | 113 | 33,029(0.34%)#42 | 139,089(0.08%)#182 |
| 43. | Beaumont | 113 | 33,029(0.34%)#43 | 139,089(0.08%)#184 |
| 44. | Loyola | 113 | 33,029(0.34%)#44 | 139,089(0.08%)#186 |
| 45. | Pinon Hills | 111 | 33,029(0.34%)#45 | 139,089(0.08%)#189 |
| 46. | Pasadena | 108 | 33,029(0.33%)#46 | 139,089(0.08%)#194 |
| 47. | Santa Clara | 104 | 33,029(0.31%)#47 | 139,089(0.07%)#202 |
| 48. | Pleasanton | 104 | 33,029(0.31%)#48 | 139,089(0.07%)#203 |
| 49. | Santa Barbara | 100 | 33,029(0.30%)#49 | 139,089(0.07%)#210 |
| 50. | Riverside | 99 | 33,029(0.30%)#50 | 139,089(0.07%)#212 |
| 51. | Modesto | 93 | 33,029(0.28%)#51 | 139,089(0.07%)#221 |
| 52. | Encinitas | 93 | 33,029(0.28%)#52 | 139,089(0.07%)#222 |
| 53. | San Rafael | 90 | 33,029(0.27%)#53 | 139,089(0.06%)#231 |
| 54. | Aliso Viejo | 90 | 33,029(0.27%)#54 | 139,089(0.06%)#232 |
| 55. | Redwood City | 88 | 33,029(0.27%)#55 | 139,089(0.06%)#236 |
| 56. | Dana Point | 86 | 33,029(0.26%)#56 | 139,089(0.06%)#240 |
| 57. | Mission Viejo | 84 | 33,029(0.25%)#57 | 139,089(0.06%)#246 |
| 58. | Santa Cruz | 75 | 33,029(0.23%)#58 | 139,089(0.05%)#273 |
| 59. | Newport Beach | 73 | 33,029(0.22%)#59 | 139,089(0.05%)#280 |
| 60. | Brea | 71 | 33,029(0.21%)#60 | 139,089(0.05%)#287 |
| 61. | Oceanside | 69 | 33,029(0.21%)#61 | 139,089(0.05%)#290 |
| 62. | Rocklin | 69 | 33,029(0.21%)#62 | 139,089(0.05%)#292 |
| 63. | Westlake Village | 68 | 33,029(0.21%)#63 | 139,089(0.05%)#298 |
| 64. | Carlsbad | 66 | 33,029(0.20%)#64 | 139,089(0.05%)#303 |
| 65. | La Crescenta Montrose | 66 | 33,029(0.20%)#65 | 139,089(0.05%)#308 |
| 66. | Fairfax | 66 | 33,029(0.20%)#66 | 139,089(0.05%)#309 |
| 67. | Palm Springs | 63 | 33,029(0.19%)#67 | 139,089(0.05%)#320 |
| 68. | Los Gatos | 63 | 33,029(0.19%)#68 | 139,089(0.05%)#321 |
| 69. | Menifee | 62 | 33,029(0.19%)#69 | 139,089(0.04%)#325 |
| 70. | San Marcos | 62 | 33,029(0.19%)#70 | 139,089(0.04%)#327 |
| 71. | Cameron Park | 61 | 33,029(0.18%)#71 | 139,089(0.04%)#332 |
| 72. | Daly City | 59 | 33,029(0.18%)#72 | 139,089(0.04%)#340 |
| 73. | Huntington Beach | 58 | 33,029(0.18%)#73 | 139,089(0.04%)#342 |
| 74. | Oxnard | 57 | 33,029(0.17%)#74 | 139,089(0.04%)#347 |
| 75. | Rancho Palos Verdes | 57 | 33,029(0.17%)#75 | 139,089(0.04%)#349 |
| 76. | Oildale | 57 | 33,029(0.17%)#76 | 139,089(0.04%)#350 |
| 77. | Santa Clarita | 56 | 33,029(0.17%)#77 | 139,089(0.04%)#354 |
| 78. | Torrance | 55 | 33,029(0.17%)#78 | 139,089(0.04%)#363 |
| 79. | Lafayette | 54 | 33,029(0.16%)#79 | 139,089(0.04%)#369 |
| 80. | Lakewood | 52 | 33,029(0.16%)#80 | 139,089(0.04%)#377 |
| 81. | Fontana | 50 | 33,029(0.15%)#81 | 139,089(0.04%)#389 |
| 82. | Vineyard | 49 | 33,029(0.15%)#82 | 139,089(0.04%)#396 |
| 83. | Arden Arcade | 48 | 33,029(0.15%)#83 | 139,089(0.03%)#404 |
| 84. | Carmichael | 48 | 33,029(0.15%)#84 | 139,089(0.03%)#405 |
| 85. | Antelope | 47 | 33,029(0.14%)#85 | 139,089(0.03%)#415 |
| 86. | Visalia | 46 | 33,029(0.14%)#86 | 139,089(0.03%)#419 |
| 87. | El Sobrante Cdp Riverside County | 46 | 33,029(0.14%)#87 | 139,089(0.03%)#425 |
| 88. | Rancho Cucamonga | 45 | 33,029(0.14%)#88 | 139,089(0.03%)#430 |
| 89. | Milpitas | 45 | 33,029(0.14%)#89 | 139,089(0.03%)#431 |
| 90. | Manhattan Beach | 45 | 33,029(0.14%)#90 | 139,089(0.03%)#433 |
| 91. | Felton | 45 | 33,029(0.14%)#91 | 139,089(0.03%)#440 |
| 92. | Indio | 44 | 33,029(0.13%)#92 | 139,089(0.03%)#444 |
| 93. | Rancho Calaveras | 44 | 33,029(0.13%)#93 | 139,089(0.03%)#451 |
| 94. | South Gate | 43 | 33,029(0.13%)#94 | 139,089(0.03%)#455 |
| 95. | Cypress | 43 | 33,029(0.13%)#95 | 139,089(0.03%)#456 |
| 96. | Eastern Goleta Valley | 43 | 33,029(0.13%)#96 | 139,089(0.03%)#457 |
| 97. | Los Alamitos | 43 | 33,029(0.13%)#97 | 139,089(0.03%)#461 |
| 98. | Glendora | 42 | 33,029(0.13%)#98 | 139,089(0.03%)#468 |
| 99. | Pescadero | 42 | 33,029(0.13%)#99 | 139,089(0.03%)#476 |
| 100. | San Buenaventura Ventura | 41 | 33,029(0.12%)#100 | 139,089(0.03%)#477 |
Common Questions
What are the Top 10 Cities with the Most Immigrants from Israel in California?
Top 10 Cities with the Most Immigrants from Israel in California are:
#1
11,800
#2
1,749
#3
1,610
#4
1,004
#5
781
#6
749
#7
514
#8
495
#9
452
#10
368
What city has the Most Immigrants from Israel in California?
Los Angeles has the Most Immigrants from Israel in California with 11,800.
What is the Total Immigrants from Israel in the State of California?
Total Immigrants from Israel in California is 33,029.
What is the Total Immigrants from Israel in the United States?
Total Immigrants from Israel in the United States is 139,089.