Cities with the Highest Percentage of Population Employed in Law Enforcement in California
RELATED REPORTS & OPTIONS
Law Enforcement
California
Compare Cities
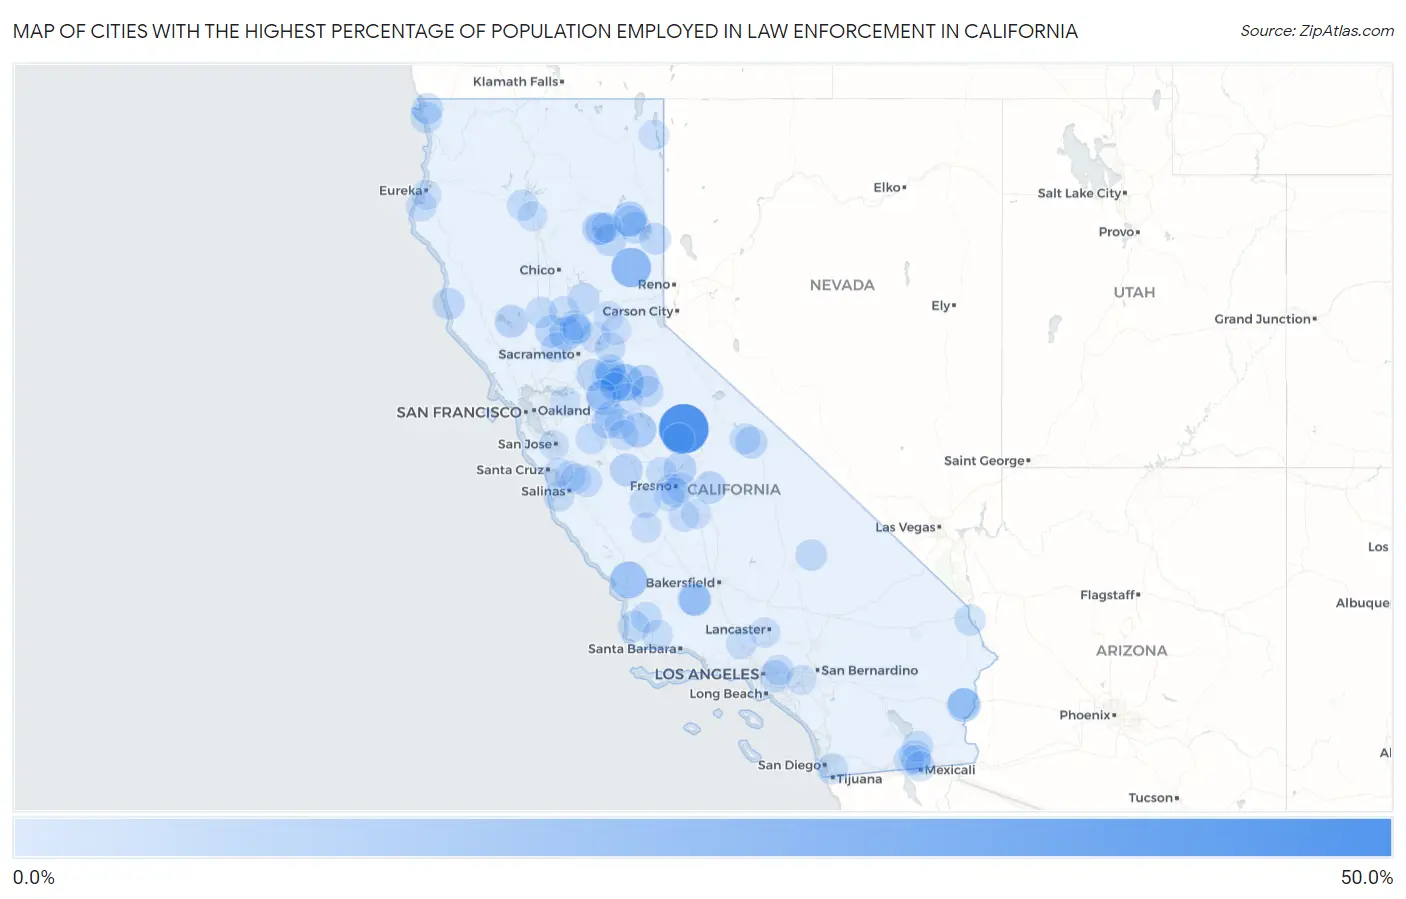
Map of Cities with the Highest Percentage of Population Employed in Law Enforcement in California
0.0%
50.0%
Cities with the Highest Percentage of Population Employed in Law Enforcement in California
| City | % Employed | vs State | vs National | |
| 1. | Igo | 47.6% | 0.80%(+46.8)#1 | 0.96%(+46.7)#14 |
| 2. | Wawona | 47.0% | 0.80%(+46.2)#2 | 0.96%(+46.0)#15 |
| 3. | C Road | 24.0% | 0.80%(+23.2)#3 | 0.96%(+23.0)#102 |
| 4. | Garden Farms | 18.0% | 0.80%(+17.2)#4 | 0.96%(+17.0)#154 |
| 5. | San Andreas | 17.9% | 0.80%(+17.1)#5 | 0.96%(+16.9)#155 |
| 6. | El Centro Naval Air Facility | 14.0% | 0.80%(+13.2)#6 | 0.96%(+13.1)#238 |
| 7. | Snelling | 13.6% | 0.80%(+12.8)#7 | 0.96%(+12.6)#256 |
| 8. | Peters | 12.3% | 0.80%(+11.5)#8 | 0.96%(+11.3)#310 |
| 9. | Susanville | 12.2% | 0.80%(+11.4)#9 | 0.96%(+11.2)#319 |
| 10. | Mesa Verde | 11.7% | 0.80%(+10.8)#10 | 0.96%(+10.7)#357 |
| 11. | Robbins | 11.0% | 0.80%(+10.2)#11 | 0.96%(+10.00)#408 |
| 12. | Lake Almanor Peninsula | 9.6% | 0.80%(+8.81)#12 | 0.96%(+8.65)#506 |
| 13. | Clearlake Oaks | 9.3% | 0.80%(+8.49)#13 | 0.96%(+8.34)#544 |
| 14. | South Dos Palos | 9.1% | 0.80%(+8.34)#14 | 0.96%(+8.18)#563 |
| 15. | Taft Heights | 8.9% | 0.80%(+8.11)#15 | 0.96%(+7.95)#593 |
| 16. | Avery | 8.8% | 0.80%(+7.99)#16 | 0.96%(+7.83)#611 |
| 17. | Friant | 8.8% | 0.80%(+7.99)#17 | 0.96%(+7.83)#612 |
| 18. | Greenville | 8.4% | 0.80%(+7.60)#18 | 0.96%(+7.44)#670 |
| 19. | Squaw Valley | 8.3% | 0.80%(+7.53)#19 | 0.96%(+7.38)#677 |
| 20. | Dunnigan | 8.0% | 0.80%(+7.17)#20 | 0.96%(+7.02)#740 |
| 21. | Herald | 7.9% | 0.80%(+7.07)#21 | 0.96%(+6.91)#755 |
| 22. | Taft | 7.7% | 0.80%(+6.89)#22 | 0.96%(+6.73)#780 |
| 23. | West Bishop | 7.4% | 0.80%(+6.64)#23 | 0.96%(+6.48)#831 |
| 24. | Hamilton Branch | 7.3% | 0.80%(+6.51)#24 | 0.96%(+6.35)#857 |
| 25. | Airport | 7.2% | 0.80%(+6.42)#25 | 0.96%(+6.26)#874 |
| 26. | Little River | 7.1% | 0.80%(+6.34)#26 | 0.96%(+6.18)#891 |
| 27. | Janesville | 7.1% | 0.80%(+6.31)#27 | 0.96%(+6.15)#904 |
| 28. | Johnstonville | 7.1% | 0.80%(+6.26)#28 | 0.96%(+6.11)#923 |
| 29. | Imperial | 7.0% | 0.80%(+6.19)#29 | 0.96%(+6.03)#936 |
| 30. | Amador Pines | 7.0% | 0.80%(+6.18)#30 | 0.96%(+6.02)#940 |
| 31. | Valley Springs | 6.9% | 0.80%(+6.05)#31 | 0.96%(+5.89)#970 |
| 32. | Herlong | 6.8% | 0.80%(+5.99)#32 | 0.96%(+5.83)#984 |
| 33. | Loma Rica | 6.8% | 0.80%(+5.99)#33 | 0.96%(+5.83)#985 |
| 34. | Camanche Village | 6.8% | 0.80%(+5.97)#34 | 0.96%(+5.81)#989 |
| 35. | Cold Springs Cdp El Dorado County | 6.7% | 0.80%(+5.88)#35 | 0.96%(+5.72)#1,013 |
| 36. | Rose Hills | 6.5% | 0.80%(+5.69)#36 | 0.96%(+5.53)#1,072 |
| 37. | Vandenberg Afb | 6.5% | 0.80%(+5.68)#37 | 0.96%(+5.52)#1,073 |
| 38. | Searles Valley | 6.5% | 0.80%(+5.65)#38 | 0.96%(+5.49)#1,078 |
| 39. | Buena Vista | 6.1% | 0.80%(+5.25)#39 | 0.96%(+5.09)#1,202 |
| 40. | East Nicolaus | 6.0% | 0.80%(+5.17)#40 | 0.96%(+5.01)#1,223 |
| 41. | Ione | 6.0% | 0.80%(+5.15)#41 | 0.96%(+5.00)#1,227 |
| 42. | Cantua Creek | 5.8% | 0.80%(+5.04)#42 | 0.96%(+4.88)#1,273 |
| 43. | Ridgemark | 5.8% | 0.80%(+5.00)#43 | 0.96%(+4.84)#1,284 |
| 44. | Cedar Ridge | 5.8% | 0.80%(+4.98)#44 | 0.96%(+4.83)#1,292 |
| 45. | Bertsch Oceanview | 5.8% | 0.80%(+4.98)#45 | 0.96%(+4.82)#1,293 |
| 46. | Shasta | 5.7% | 0.80%(+4.88)#46 | 0.96%(+4.73)#1,327 |
| 47. | Blythe | 5.7% | 0.80%(+4.86)#47 | 0.96%(+4.70)#1,336 |
| 48. | Needles | 5.7% | 0.80%(+4.86)#48 | 0.96%(+4.70)#1,337 |
| 49. | Fort Dick | 5.6% | 0.80%(+4.79)#49 | 0.96%(+4.63)#1,368 |
| 50. | Nipinnawasee | 5.5% | 0.80%(+4.71)#50 | 0.96%(+4.55)#1,395 |
| 51. | Diablo Grande | 5.5% | 0.80%(+4.66)#51 | 0.96%(+4.50)#1,423 |
| 52. | Sisquoc | 5.5% | 0.80%(+4.65)#52 | 0.96%(+4.49)#1,428 |
| 53. | Bonita | 5.4% | 0.80%(+4.61)#53 | 0.96%(+4.45)#1,445 |
| 54. | Williams | 5.3% | 0.80%(+4.47)#54 | 0.96%(+4.31)#1,506 |
| 55. | Di Giorgio | 5.2% | 0.80%(+4.40)#55 | 0.96%(+4.25)#1,541 |
| 56. | Brawley | 5.0% | 0.80%(+4.23)#56 | 0.96%(+4.08)#1,614 |
| 57. | Round Valley | 5.0% | 0.80%(+4.20)#57 | 0.96%(+4.04)#1,629 |
| 58. | Copperopolis | 4.9% | 0.80%(+4.13)#58 | 0.96%(+3.97)#1,661 |
| 59. | Loomis | 4.8% | 0.80%(+3.99)#59 | 0.96%(+3.83)#1,731 |
| 60. | Millerton | 4.8% | 0.80%(+3.97)#60 | 0.96%(+3.81)#1,740 |
| 61. | Hanford | 4.8% | 0.80%(+3.96)#61 | 0.96%(+3.80)#1,745 |
| 62. | Santa Ynez | 4.7% | 0.80%(+3.93)#62 | 0.96%(+3.77)#1,758 |
| 63. | Seeley | 4.7% | 0.80%(+3.87)#63 | 0.96%(+3.71)#1,794 |
| 64. | Del Rey Oaks | 4.7% | 0.80%(+3.86)#64 | 0.96%(+3.70)#1,801 |
| 65. | Parkwood | 4.5% | 0.80%(+3.71)#65 | 0.96%(+3.56)#1,878 |
| 66. | Irwindale | 4.5% | 0.80%(+3.66)#66 | 0.96%(+3.50)#1,923 |
| 67. | Aromas | 4.3% | 0.80%(+3.52)#67 | 0.96%(+3.36)#2,020 |
| 68. | Castaic | 4.3% | 0.80%(+3.51)#68 | 0.96%(+3.35)#2,030 |
| 69. | Riverbank | 4.3% | 0.80%(+3.48)#69 | 0.96%(+3.32)#2,051 |
| 70. | Shingle Springs | 4.3% | 0.80%(+3.45)#70 | 0.96%(+3.30)#2,066 |
| 71. | Coalinga | 4.2% | 0.80%(+3.39)#71 | 0.96%(+3.23)#2,112 |
| 72. | Sutter | 4.2% | 0.80%(+3.38)#72 | 0.96%(+3.22)#2,117 |
| 73. | El Centro | 4.2% | 0.80%(+3.36)#73 | 0.96%(+3.20)#2,145 |
| 74. | Hickman | 4.1% | 0.80%(+3.34)#74 | 0.96%(+3.18)#2,154 |
| 75. | North Fork | 4.1% | 0.80%(+3.28)#75 | 0.96%(+3.12)#2,213 |
| 76. | Cedarville | 4.1% | 0.80%(+3.26)#76 | 0.96%(+3.11)#2,224 |
| 77. | Ferndale | 4.0% | 0.80%(+3.22)#77 | 0.96%(+3.06)#2,242 |
| 78. | Westwood | 4.0% | 0.80%(+3.21)#78 | 0.96%(+3.05)#2,252 |
| 79. | Rancho Calaveras | 4.0% | 0.80%(+3.21)#79 | 0.96%(+3.05)#2,257 |
| 80. | Quartz Hill | 4.0% | 0.80%(+3.20)#80 | 0.96%(+3.04)#2,261 |
| 81. | Plumas Lake | 3.9% | 0.80%(+3.13)#81 | 0.96%(+2.97)#2,332 |
| 82. | Monument Hills | 3.9% | 0.80%(+3.11)#82 | 0.96%(+2.95)#2,341 |
| 83. | San Juan Bautista | 3.9% | 0.80%(+3.08)#83 | 0.96%(+2.92)#2,365 |
| 84. | Ballico | 3.8% | 0.80%(+3.04)#84 | 0.96%(+2.88)#2,392 |
| 85. | West Park | 3.8% | 0.80%(+3.01)#85 | 0.96%(+2.86)#2,423 |
| 86. | Linden | 3.6% | 0.80%(+2.76)#86 | 0.96%(+2.60)#2,655 |
| 87. | Calexico | 3.5% | 0.80%(+2.71)#87 | 0.96%(+2.56)#2,696 |
| 88. | Burbank | 3.4% | 0.80%(+2.61)#88 | 0.96%(+2.45)#2,797 |
| 89. | Pine Hills | 3.4% | 0.80%(+2.61)#89 | 0.96%(+2.45)#2,800 |
| 90. | Trowbridge | 3.4% | 0.80%(+2.60)#90 | 0.96%(+2.45)#2,806 |
| 91. | Brentwood | 3.4% | 0.80%(+2.57)#91 | 0.96%(+2.41)#2,836 |
| 92. | Raisin City | 3.4% | 0.80%(+2.57)#92 | 0.96%(+2.41)#2,839 |
| 93. | Eastvale | 3.3% | 0.80%(+2.51)#93 | 0.96%(+2.35)#2,915 |
| 94. | Goshen | 3.3% | 0.80%(+2.49)#94 | 0.96%(+2.33)#2,938 |
| 95. | Sunnyside | 3.2% | 0.80%(+2.42)#95 | 0.96%(+2.26)#2,999 |
| 96. | Colfax | 3.2% | 0.80%(+2.41)#96 | 0.96%(+2.25)#3,034 |
| 97. | Easton | 3.2% | 0.80%(+2.40)#97 | 0.96%(+2.24)#3,045 |
| 98. | Georgetown | 3.2% | 0.80%(+2.39)#98 | 0.96%(+2.23)#3,057 |
| 99. | Anderson | 3.2% | 0.80%(+2.36)#99 | 0.96%(+2.20)#3,107 |
| 100. | La Selva Beach | 3.1% | 0.80%(+2.29)#100 | 0.96%(+2.14)#3,168 |
Common Questions
What are the Top 10 Cities with the Highest Percentage of Population Employed in Law Enforcement in California?
Top 10 Cities with the Highest Percentage of Population Employed in Law Enforcement in California are:
#1
47.0%
#2
24.0%
#3
18.0%
#4
17.9%
#5
13.6%
#6
12.3%
#7
12.2%
#8
11.7%
#9
11.0%
#10
9.6%
What city has the Highest Percentage of Population Employed in Law Enforcement in California?
Wawona has the Highest Percentage of Population Employed in Law Enforcement in California with 47.0%.
What is the Percentage of Population Employed in Law Enforcement in the State of California?
Percentage of Population Employed in Law Enforcement in California is 0.80%.
What is the Percentage of Population Employed in Law Enforcement in the United States?
Percentage of Population Employed in Law Enforcement in the United States is 0.96%.