McKittrick, CA Map & Demographics
McKittrick Map
McKittrick Overview
$19,891
PER CAPITA INCOME
$43,750
AVG HOUSEHOLD INCOME
89.5%
WAGE / INCOME GAP [ % ]
10.5¢/ $1
WAGE / INCOME GAP [ $ ]
0.39
INEQUALITY / GINI INDEX
93
TOTAL POPULATION
41
MALE POPULATION
52
FEMALE POPULATION
78.85
MALES / 100 FEMALES
126.83
FEMALES / 100 MALES
52.6
MEDIAN AGE
2.4
AVG FAMILY SIZE
2.4
AVG HOUSEHOLD SIZE
46
LABOR FORCE [ PEOPLE ]
58.2%
PERCENT IN LABOR FORCE
13.0%
UNEMPLOYMENT RATE
Income in McKittrick
Income Overview in McKittrick
| Characteristic | Number | Measure |
| Per Capita Income | 93 | $19,891 |
| Median Family Income | 30 | $0 |
| Mean Family Income | 30 | $37,007 |
| Median Household Income | 36 | $43,750 |
| Mean Household Income | 36 | $44,944 |
| Income Deficit | 30 | $0 |
| Wage / Income Gap (%) | 93 | 89.50% |
| Wage / Income Gap ($) | 93 | 10.50¢ per $1 |
| Gini / Inequality Index | 93 | 0.39 |
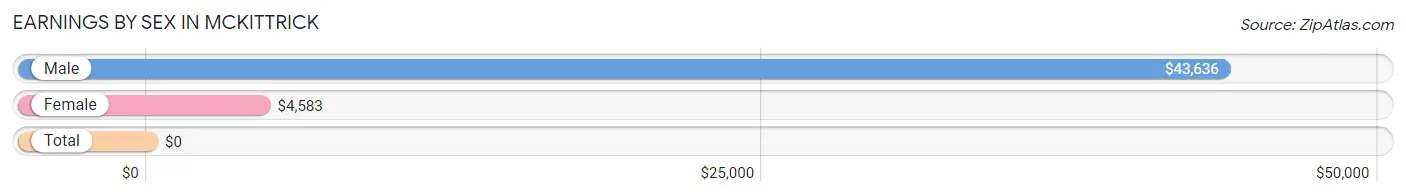
Earnings by Sex in McKittrick
| Sex | Number | Average Earnings |
| Male | 30 (62.5%) | $43,636 |
| Female | 18 (37.5%) | $4,583 |
| Total | 48 (100.0%) | $0 |
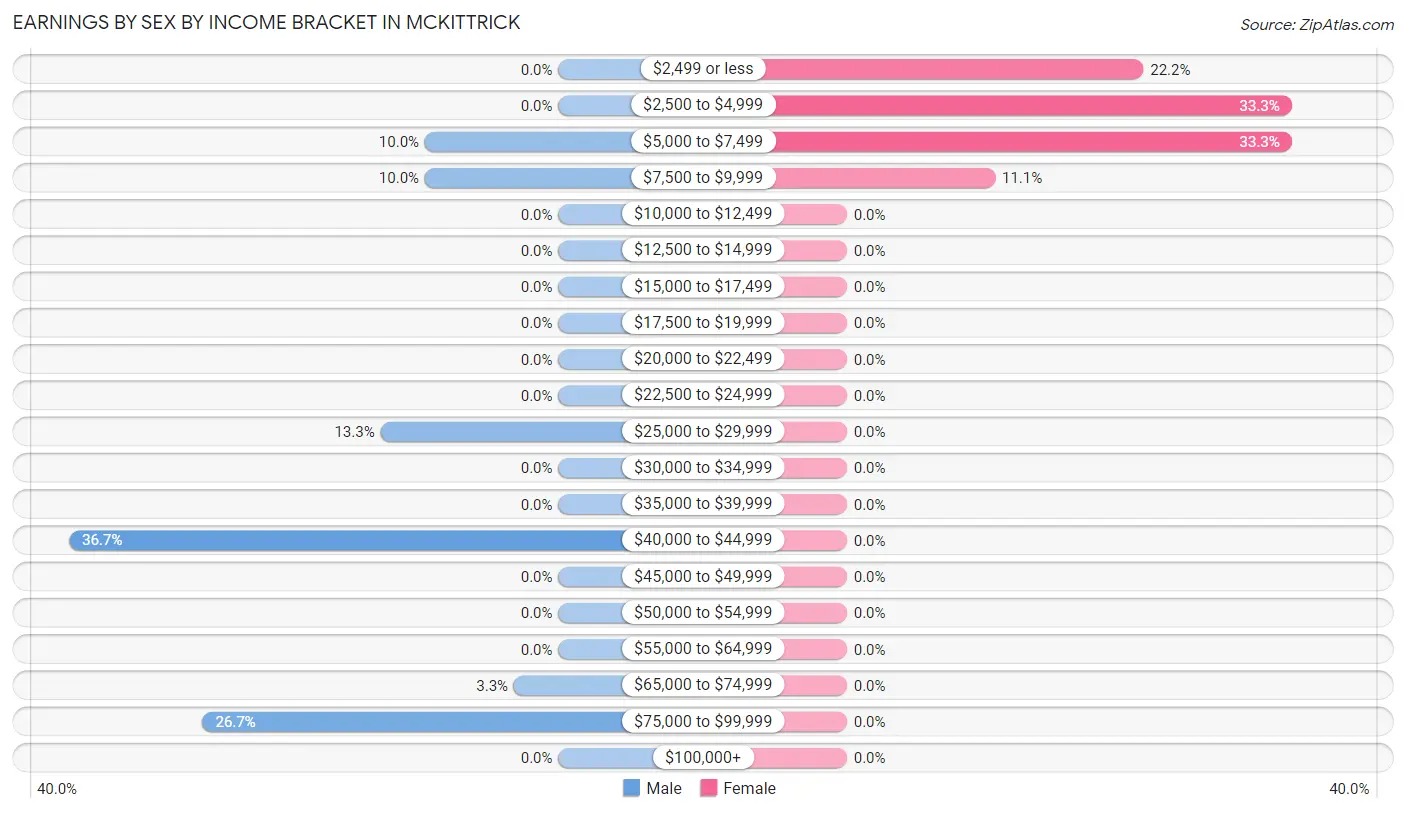
Earnings by Sex by Income Bracket in McKittrick
The most common earnings brackets in McKittrick are $40,000 to $44,999 for men (11 | 36.7%) and $2,500 to $4,999 for women (6 | 33.3%).
| Income | Male | Female |
| $2,499 or less | 0 (0.0%) | 4 (22.2%) |
| $2,500 to $4,999 | 0 (0.0%) | 6 (33.3%) |
| $5,000 to $7,499 | 3 (10.0%) | 6 (33.3%) |
| $7,500 to $9,999 | 3 (10.0%) | 2 (11.1%) |
| $10,000 to $12,499 | 0 (0.0%) | 0 (0.0%) |
| $12,500 to $14,999 | 0 (0.0%) | 0 (0.0%) |
| $15,000 to $17,499 | 0 (0.0%) | 0 (0.0%) |
| $17,500 to $19,999 | 0 (0.0%) | 0 (0.0%) |
| $20,000 to $22,499 | 0 (0.0%) | 0 (0.0%) |
| $22,500 to $24,999 | 0 (0.0%) | 0 (0.0%) |
| $25,000 to $29,999 | 4 (13.3%) | 0 (0.0%) |
| $30,000 to $34,999 | 0 (0.0%) | 0 (0.0%) |
| $35,000 to $39,999 | 0 (0.0%) | 0 (0.0%) |
| $40,000 to $44,999 | 11 (36.7%) | 0 (0.0%) |
| $45,000 to $49,999 | 0 (0.0%) | 0 (0.0%) |
| $50,000 to $54,999 | 0 (0.0%) | 0 (0.0%) |
| $55,000 to $64,999 | 0 (0.0%) | 0 (0.0%) |
| $65,000 to $74,999 | 1 (3.3%) | 0 (0.0%) |
| $75,000 to $99,999 | 8 (26.7%) | 0 (0.0%) |
| $100,000+ | 0 (0.0%) | 0 (0.0%) |
| Total | 30 (100.0%) | 18 (100.0%) |
Earnings by Sex by Educational Attainment in McKittrick
| Educational Attainment | Male Income | Female Income |
| Less than High School | - | - |
| High School Diploma | - | - |
| College or Associate's Degree | - | - |
| Bachelor's Degree | - | - |
| Graduate Degree | - | - |
| Total | $43,977 | $5,417 |
Family Income in McKittrick
Family Income Brackets in McKittrick
According to the McKittrick family income data, there are 8 families falling into the less than $10,000 income range, which is the most common income bracket and makes up 26.7% of all families.
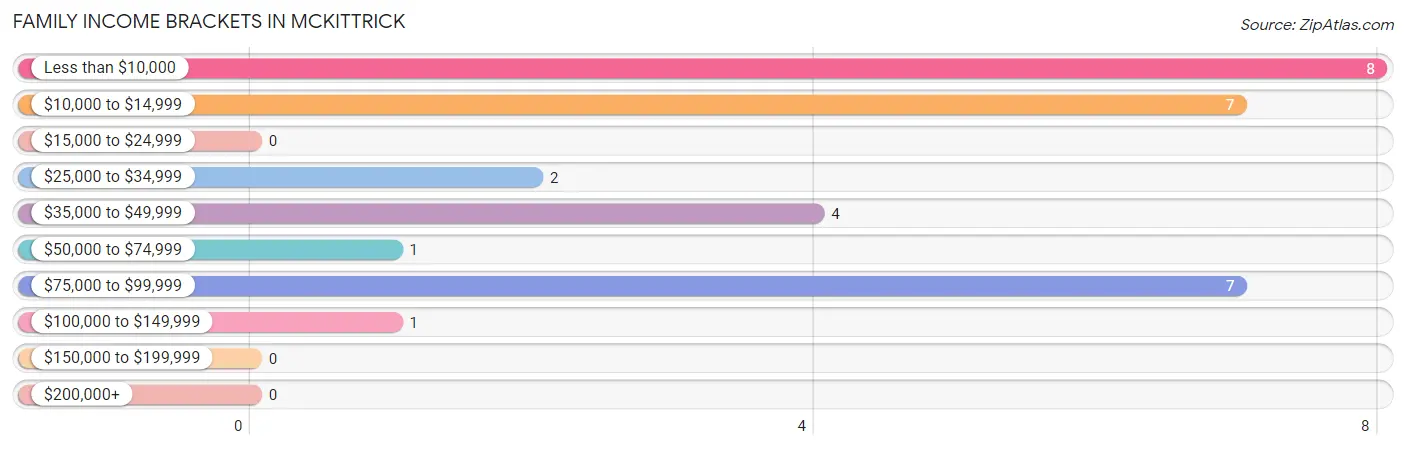
| Income Bracket | # Families | % Families |
| Less than $10,000 | 8 | 26.7% |
| $10,000 to $14,999 | 7 | 23.3% |
| $15,000 to $24,999 | 0 | 0.0% |
| $25,000 to $34,999 | 2 | 6.7% |
| $35,000 to $49,999 | 4 | 13.3% |
| $50,000 to $74,999 | 1 | 3.3% |
| $75,000 to $99,999 | 7 | 23.3% |
| $100,000 to $149,999 | 1 | 3.3% |
| $150,000 to $199,999 | 0 | 0.0% |
| $200,000+ | 0 | 0.0% |
Family Income by Famaliy Size in McKittrick
| Income Bracket | # Families | Median Income |
| 2-Person Families | 26 (86.7%) | $0 |
| 3-Person Families | 4 (13.3%) | $0 |
| 4-Person Families | 0 (0.0%) | $0 |
| 5-Person Families | 0 (0.0%) | $0 |
| 6-Person Families | 0 (0.0%) | $0 |
| 7+ Person Families | 0 (0.0%) | $0 |
| Total | 30 (100.0%) | $0 |
Family Income by Number of Earners in McKittrick
| Number of Earners | # Families | Median Income |
| No Earners | 3 (10.0%) | $0 |
| 1 Earner | 24 (80.0%) | $0 |
| 2 Earners | 3 (10.0%) | $0 |
| 3+ Earners | 0 (0.0%) | $0 |
| Total | 30 (100.0%) | $0 |
Household Income in McKittrick
Household Income Brackets in McKittrick
With 8 households falling in the category, the less than $10,000 income range is the most frequent in McKittrick, accounting for 22.2% of all households.
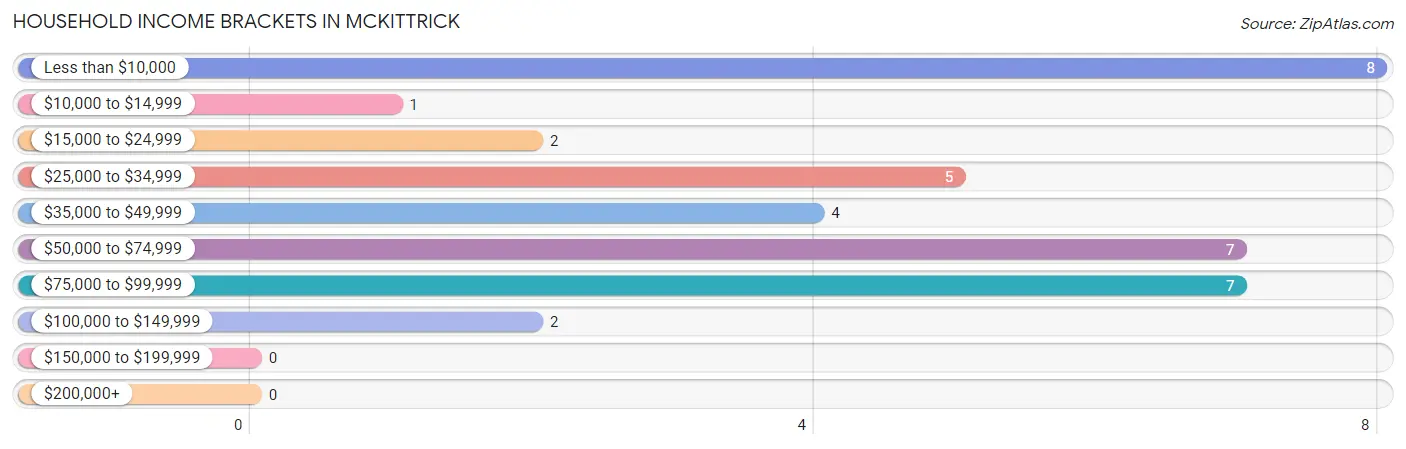
| Income Bracket | # Households | % Households |
| Less than $10,000 | 8 | 22.2% |
| $10,000 to $14,999 | 1 | 2.8% |
| $15,000 to $24,999 | 2 | 5.6% |
| $25,000 to $34,999 | 5 | 13.9% |
| $35,000 to $49,999 | 4 | 11.1% |
| $50,000 to $74,999 | 7 | 19.4% |
| $75,000 to $99,999 | 7 | 19.4% |
| $100,000 to $149,999 | 2 | 5.6% |
| $150,000 to $199,999 | 0 | 0.0% |
| $200,000+ | 0 | 0.0% |
Household Income by Householder Age in McKittrick
The median household income in McKittrick is $43,750, with the highest median household income of $20,000 found in the 65+ years age bracket for the primary householder. A total of 6 households (16.7%) fall into this category.
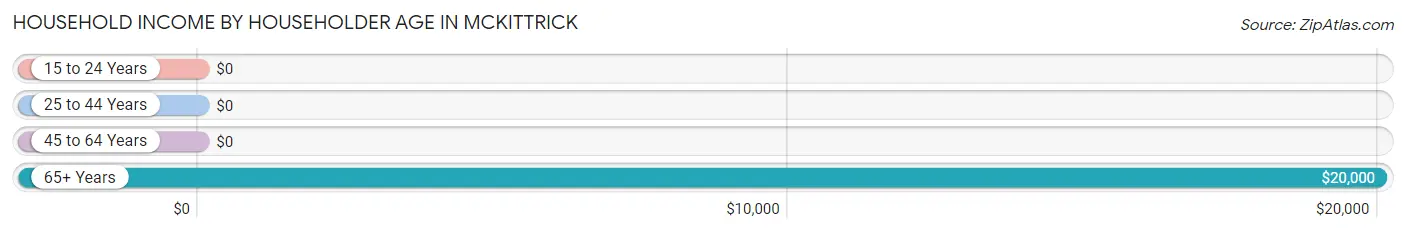
| Income Bracket | # Households | Median Income |
| 15 to 24 Years | 0 (0.0%) | $0 |
| 25 to 44 Years | 12 (33.3%) | $0 |
| 45 to 64 Years | 18 (50.0%) | $0 |
| 65+ Years | 6 (16.7%) | $20,000 |
| Total | 36 (100.0%) | $43,750 |
Poverty in McKittrick
Income Below Poverty by Sex and Age in McKittrick
With 31.7% poverty level for males and 50.0% for females among the residents of McKittrick, under 5 year old males and 6 to 11 year old females are the most vulnerable to poverty, with 8 males (100.0%) and 6 females (100.0%) in their respective age groups living below the poverty level.
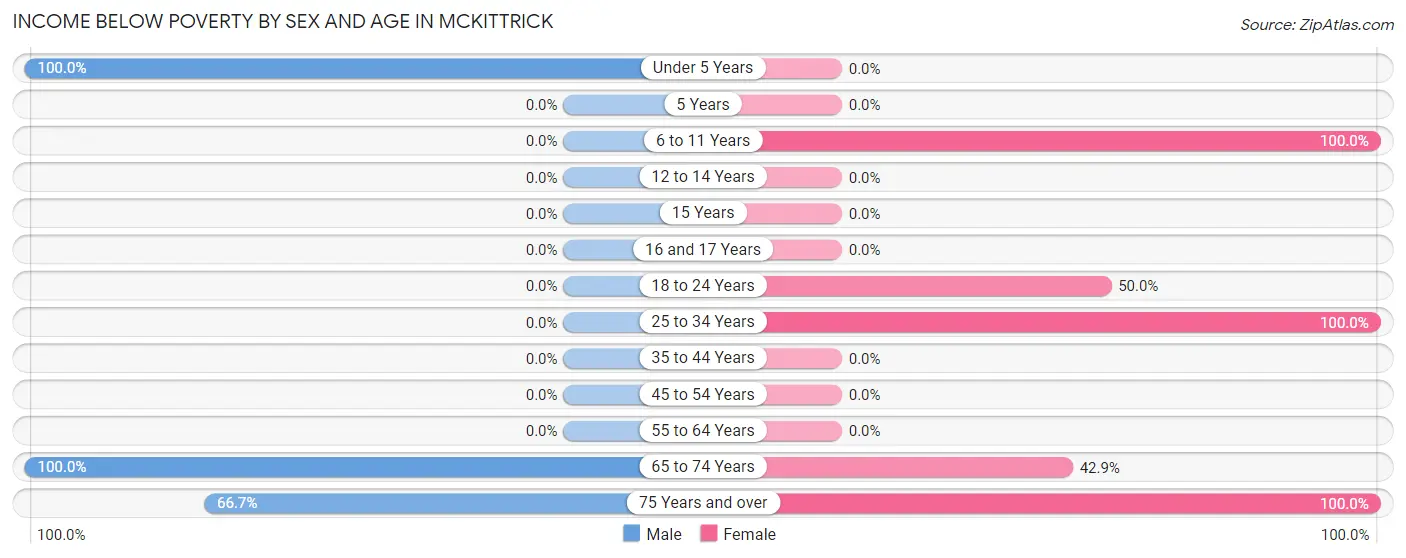
| Age Bracket | Male | Female |
| Under 5 Years | 8 (100.0%) | 0 (0.0%) |
| 5 Years | 0 (0.0%) | 0 (0.0%) |
| 6 to 11 Years | 0 (0.0%) | 6 (100.0%) |
| 12 to 14 Years | 0 (0.0%) | 0 (0.0%) |
| 15 Years | 0 (0.0%) | 0 (0.0%) |
| 16 and 17 Years | 0 (0.0%) | 0 (0.0%) |
| 18 to 24 Years | 0 (0.0%) | 2 (50.0%) |
| 25 to 34 Years | 0 (0.0%) | 12 (100.0%) |
| 35 to 44 Years | 0 (0.0%) | 0 (0.0%) |
| 45 to 54 Years | 0 (0.0%) | 0 (0.0%) |
| 55 to 64 Years | 0 (0.0%) | 0 (0.0%) |
| 65 to 74 Years | 3 (100.0%) | 3 (42.9%) |
| 75 Years and over | 2 (66.7%) | 3 (100.0%) |
| Total | 13 (31.7%) | 26 (50.0%) |
Income Above Poverty by Sex and Age in McKittrick
According to the poverty statistics in McKittrick, males aged 18 to 24 years and females aged 45 to 54 years are the age groups that are most secure financially, with 100.0% of males and 100.0% of females in these age groups living above the poverty line.
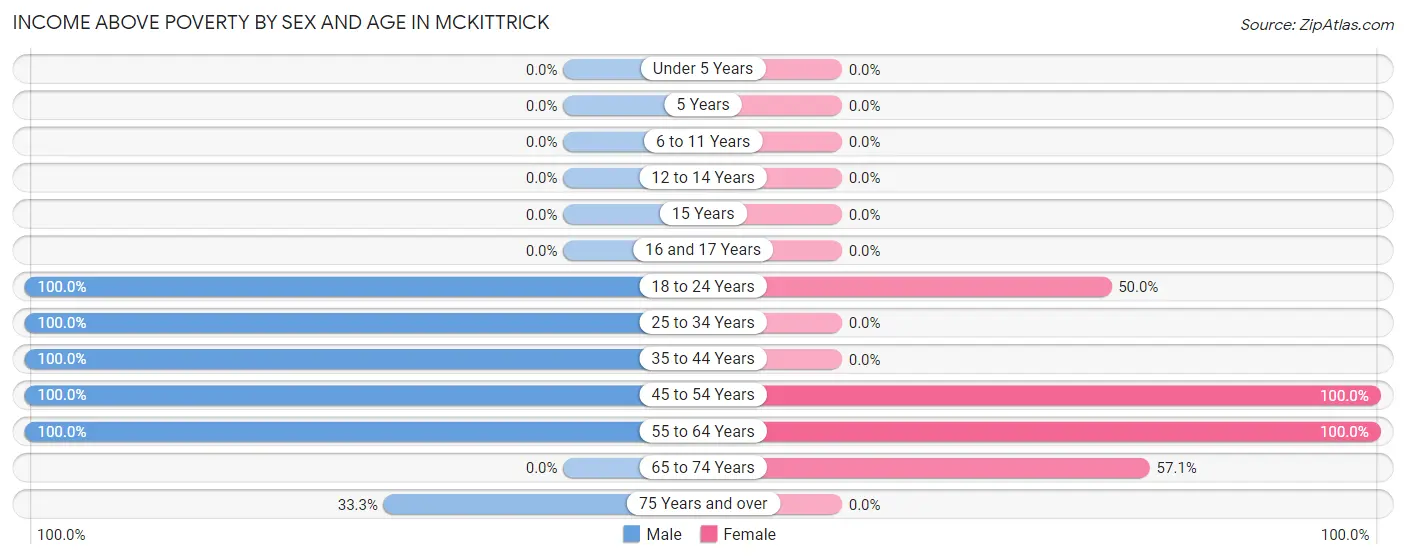
| Age Bracket | Male | Female |
| Under 5 Years | 0 (0.0%) | 0 (0.0%) |
| 5 Years | 0 (0.0%) | 0 (0.0%) |
| 6 to 11 Years | 0 (0.0%) | 0 (0.0%) |
| 12 to 14 Years | 0 (0.0%) | 0 (0.0%) |
| 15 Years | 0 (0.0%) | 0 (0.0%) |
| 16 and 17 Years | 0 (0.0%) | 0 (0.0%) |
| 18 to 24 Years | 3 (100.0%) | 2 (50.0%) |
| 25 to 34 Years | 4 (100.0%) | 0 (0.0%) |
| 35 to 44 Years | 7 (100.0%) | 0 (0.0%) |
| 45 to 54 Years | 8 (100.0%) | 11 (100.0%) |
| 55 to 64 Years | 5 (100.0%) | 9 (100.0%) |
| 65 to 74 Years | 0 (0.0%) | 4 (57.1%) |
| 75 Years and over | 1 (33.3%) | 0 (0.0%) |
| Total | 28 (68.3%) | 26 (50.0%) |
Income Below Poverty Among Married-Couple Families in McKittrick
The poverty statistics for married-couple families in McKittrick show that 13.3% or 2 of the total 15 families live below the poverty line. Families with no children have the highest poverty rate of 13.3%, comprising of 2 families. On the other hand, families with no children have the lowest poverty rate of 13.3%, which includes 2 families.
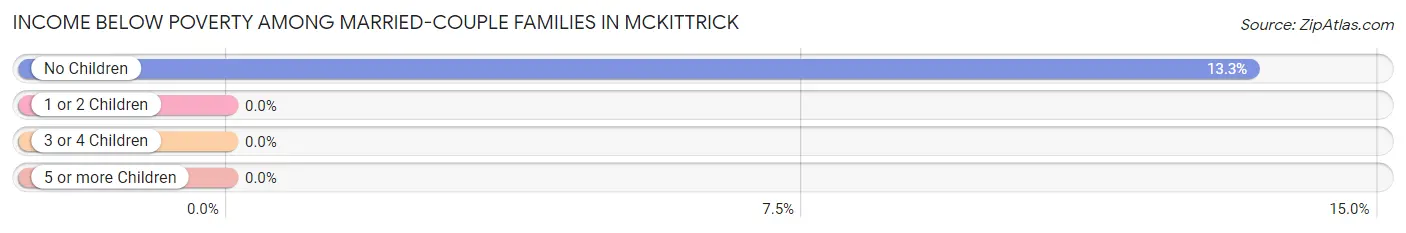
| Children | Above Poverty | Below Poverty |
| No Children | 13 (86.7%) | 2 (13.3%) |
| 1 or 2 Children | 0 (0.0%) | 0 (0.0%) |
| 3 or 4 Children | 0 (0.0%) | 0 (0.0%) |
| 5 or more Children | 0 (0.0%) | 0 (0.0%) |
| Total | 13 (86.7%) | 2 (13.3%) |
Income Below Poverty Among Single-Parent Households in McKittrick
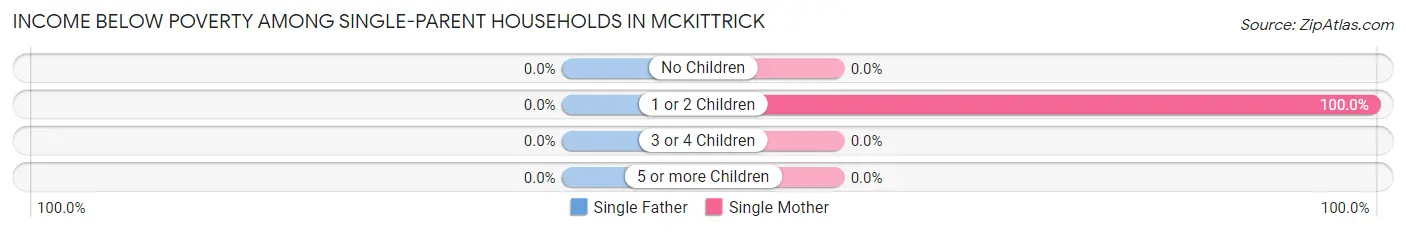
| Children | Single Father | Single Mother |
| No Children | 0 (0.0%) | 0 (0.0%) |
| 1 or 2 Children | 0 (0.0%) | 13 (100.0%) |
| 3 or 4 Children | 0 (0.0%) | 0 (0.0%) |
| 5 or more Children | 0 (0.0%) | 0 (0.0%) |
| Total | 0 (0.0%) | 13 (86.7%) |
Income Below Poverty Among Married-Couple vs Single-Parent Households in McKittrick
The poverty data for McKittrick shows that 2 of the married-couple family households (13.3%) and 13 of the single-parent households (86.7%) are living below the poverty level. Within the married-couple family households, those with no children have the highest poverty rate, with 2 households (13.3%) falling below the poverty line. Among the single-parent households, those with 1 or 2 children have the highest poverty rate, with 13 household (100.0%) living below poverty.
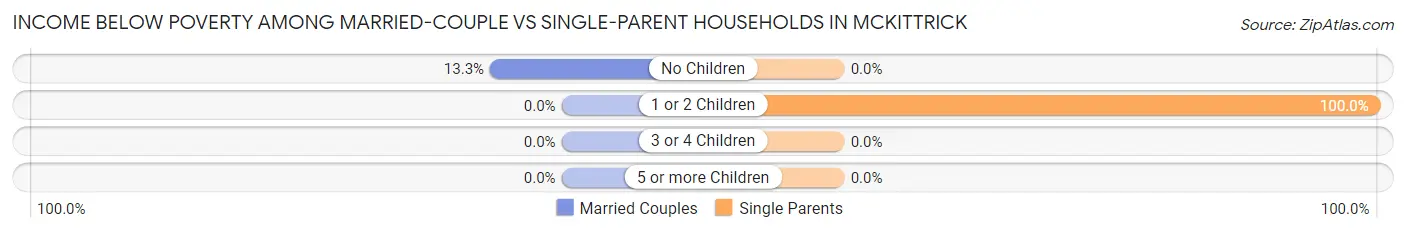
| Children | Married-Couple Families | Single-Parent Households |
| No Children | 2 (13.3%) | 0 (0.0%) |
| 1 or 2 Children | 0 (0.0%) | 13 (100.0%) |
| 3 or 4 Children | 0 (0.0%) | 0 (0.0%) |
| 5 or more Children | 0 (0.0%) | 0 (0.0%) |
| Total | 2 (13.3%) | 13 (86.7%) |
Race in McKittrick
The most populous races in McKittrick are White / Caucasian (74 | 79.6%), Two or more Races (13 | 14.0%), and Hispanic or Latino (12 | 12.9%).
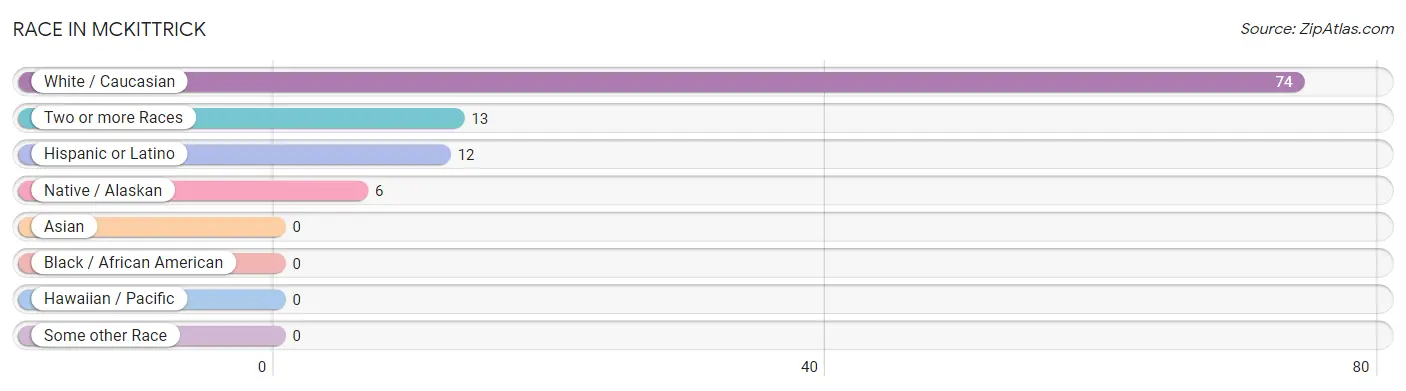
| Race | # Population | % Population |
| Asian | 0 | 0.0% |
| Black / African American | 0 | 0.0% |
| Hawaiian / Pacific | 0 | 0.0% |
| Hispanic or Latino | 12 | 12.9% |
| Native / Alaskan | 6 | 6.5% |
| White / Caucasian | 74 | 79.6% |
| Two or more Races | 13 | 14.0% |
| Some other Race | 0 | 0.0% |
| Total | 93 | 100.0% |
Ancestry in McKittrick
The most populous ancestries reported in McKittrick are English (21 | 22.6%), Cherokee (14 | 15.0%), Scottish (14 | 15.0%), Blackfeet (12 | 12.9%), and Mexican (12 | 12.9%), together accounting for 78.5% of all McKittrick residents.
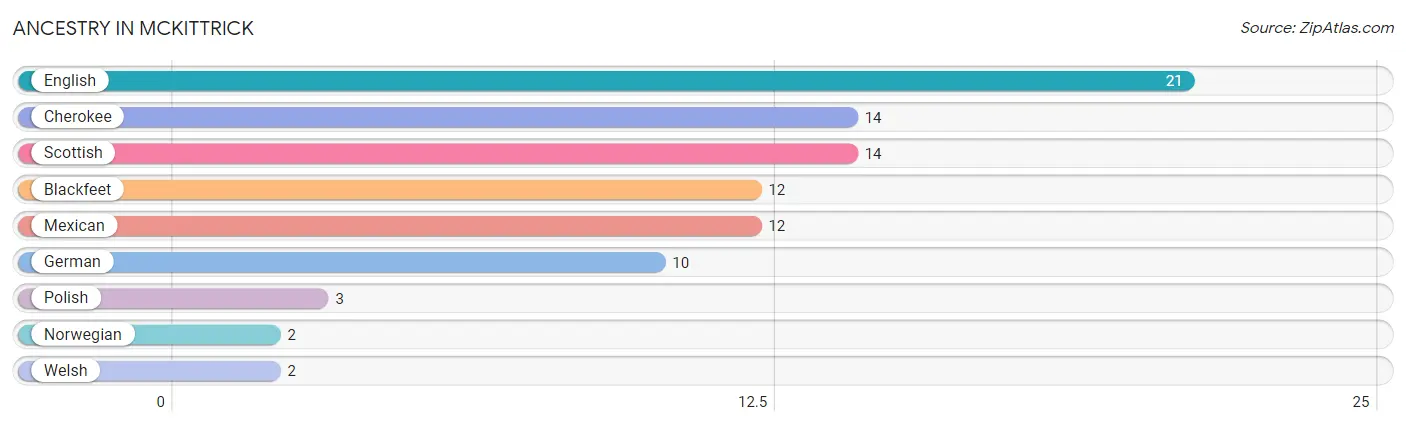
| Ancestry | # Population | % Population |
| Blackfeet | 12 | 12.9% |
| Cherokee | 14 | 15.0% |
| English | 21 | 22.6% |
| German | 10 | 10.7% |
| Mexican | 12 | 12.9% |
| Norwegian | 2 | 2.1% |
| Polish | 3 | 3.2% |
| Scottish | 14 | 15.0% |
| Welsh | 2 | 2.1% | View All 9 Rows |
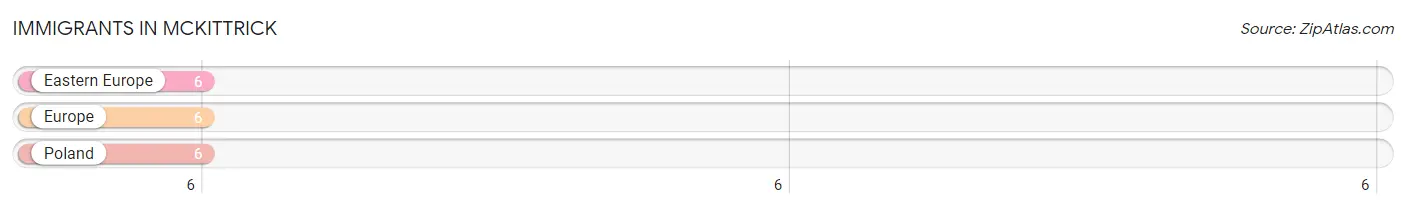
Immigrants in McKittrick
The most numerous immigrant groups reported in McKittrick came from Eastern Europe (6 | 6.5%), Europe (6 | 6.5%), and Poland (6 | 6.5%), together accounting for 19.4% of all McKittrick residents.
| Immigration Origin | # Population | % Population |
| Eastern Europe | 6 | 6.5% |
| Europe | 6 | 6.5% |
| Poland | 6 | 6.5% | View All 3 Rows |
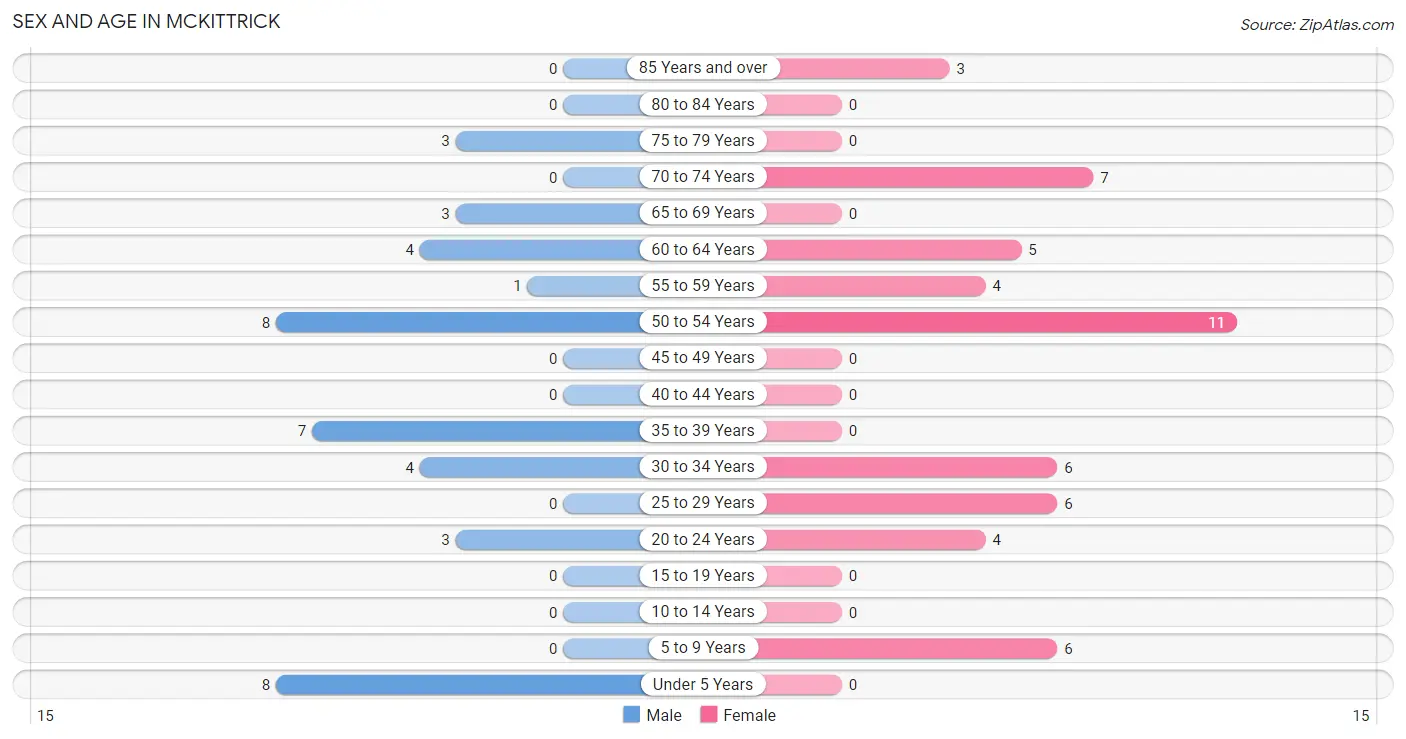
Sex and Age in McKittrick
Sex and Age in McKittrick
The most populous age groups in McKittrick are Under 5 Years (8 | 19.5%) for men and 50 to 54 Years (11 | 21.1%) for women.
| Age Bracket | Male | Female |
| Under 5 Years | 8 (19.5%) | 0 (0.0%) |
| 5 to 9 Years | 0 (0.0%) | 6 (11.5%) |
| 10 to 14 Years | 0 (0.0%) | 0 (0.0%) |
| 15 to 19 Years | 0 (0.0%) | 0 (0.0%) |
| 20 to 24 Years | 3 (7.3%) | 4 (7.7%) |
| 25 to 29 Years | 0 (0.0%) | 6 (11.5%) |
| 30 to 34 Years | 4 (9.8%) | 6 (11.5%) |
| 35 to 39 Years | 7 (17.1%) | 0 (0.0%) |
| 40 to 44 Years | 0 (0.0%) | 0 (0.0%) |
| 45 to 49 Years | 0 (0.0%) | 0 (0.0%) |
| 50 to 54 Years | 8 (19.5%) | 11 (21.1%) |
| 55 to 59 Years | 1 (2.4%) | 4 (7.7%) |
| 60 to 64 Years | 4 (9.8%) | 5 (9.6%) |
| 65 to 69 Years | 3 (7.3%) | 0 (0.0%) |
| 70 to 74 Years | 0 (0.0%) | 7 (13.5%) |
| 75 to 79 Years | 3 (7.3%) | 0 (0.0%) |
| 80 to 84 Years | 0 (0.0%) | 0 (0.0%) |
| 85 Years and over | 0 (0.0%) | 3 (5.8%) |
| Total | 41 (100.0%) | 52 (100.0%) |
Families and Households in McKittrick
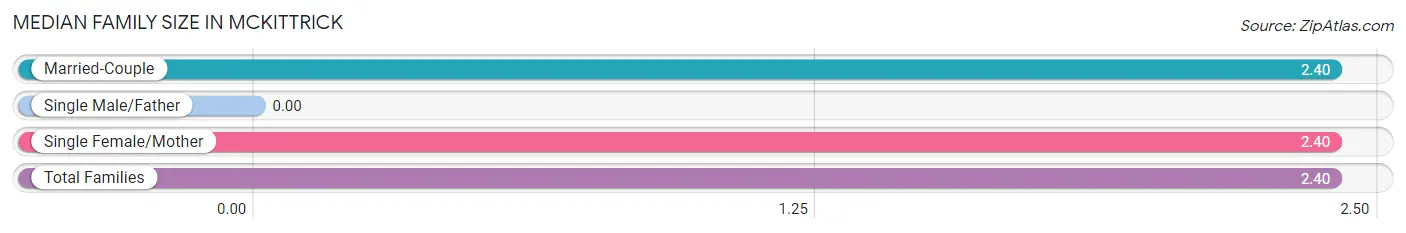
Median Family Size in McKittrick
| Family Type | # Families | Family Size |
| Married-Couple | 15 (50.0%) | 2.40 |
| Single Male/Father | 0 (0.0%) | - |
| Single Female/Mother | 15 (50.0%) | 2.40 |
| Total Families | 30 (100.0%) | 2.40 |
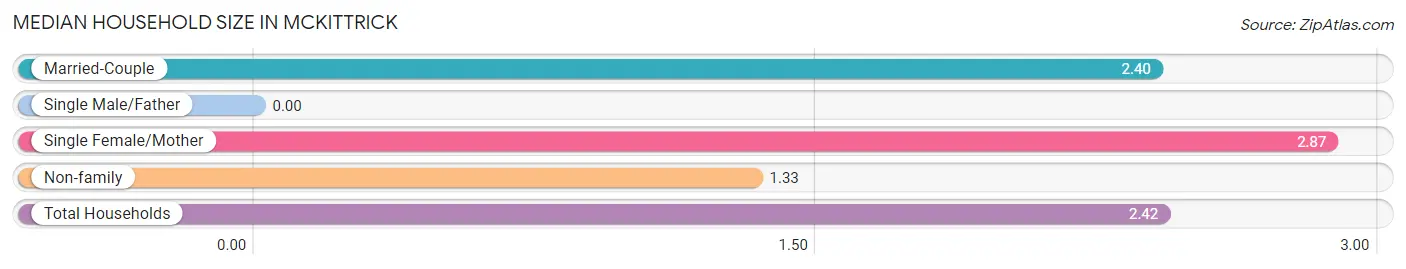
Median Household Size in McKittrick
| Household Type | # Households | Household Size |
| Married-Couple | 15 (41.7%) | 2.40 |
| Single Male/Father | 0 (0.0%) | - |
| Single Female/Mother | 15 (41.7%) | 2.87 |
| Non-family | 6 (16.7%) | 1.33 |
| Total Households | 36 (100.0%) | 2.42 |
Household Size by Marriage Status in McKittrick
Out of a total of 36 households in McKittrick, 30 (83.3%) are family households, while 6 (16.7%) are nonfamily households. The most numerous type of family households are 2-person households, comprising 20, and the most common type of nonfamily households are 1-person households, comprising 5.
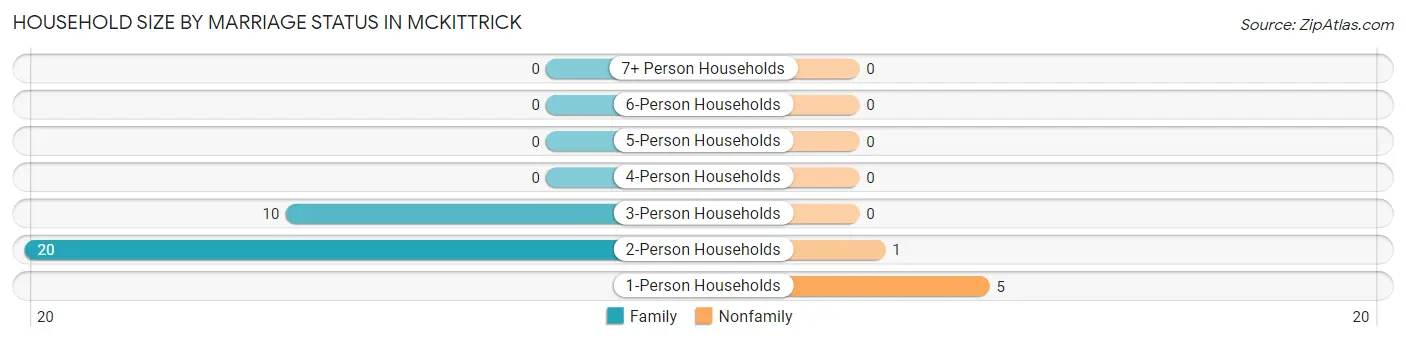
| Household Size | Family Households | Nonfamily Households |
| 1-Person Households | - | 5 (13.9%) |
| 2-Person Households | 20 (55.6%) | 1 (2.8%) |
| 3-Person Households | 10 (27.8%) | 0 (0.0%) |
| 4-Person Households | 0 (0.0%) | 0 (0.0%) |
| 5-Person Households | 0 (0.0%) | 0 (0.0%) |
| 6-Person Households | 0 (0.0%) | 0 (0.0%) |
| 7+ Person Households | 0 (0.0%) | 0 (0.0%) |
| Total | 30 (83.3%) | 6 (16.7%) |
Female Fertility in McKittrick
Fertility by Age in McKittrick
| Age Bracket | Women with Births | Births / 1,000 Women |
| 15 to 19 years | 0 (0.0%) | 0.0 |
| 20 to 34 years | 0 (0.0%) | 0.0 |
| 35 to 50 years | 0 (0.0%) | 0.0 |
| Total | 0 (0.0%) | 0.0 |
Fertility by Age by Marriage Status in McKittrick
| Age Bracket | Married | Unmarried |
| 15 to 19 years | 0 (0.0%) | 0 (0.0%) |
| 20 to 34 years | 0 (0.0%) | 0 (0.0%) |
| 35 to 50 years | 0 (0.0%) | 0 (0.0%) |
| Total | 0 (0.0%) | 0 (0.0%) |
Fertility by Education in McKittrick
| Educational Attainment | Women with Births | Births / 1,000 Women |
| Less than High School | 0 (0.0%) | 0.0 |
| High School Diploma | 0 (0.0%) | 0.0 |
| College or Associate's Degree | 0 (0.0%) | 0.0 |
| Bachelor's Degree | 0 (0.0%) | 0.0 |
| Graduate Degree | 0 (0.0%) | 0.0 |
| Total | 0 (0.0%) | 0.0 |
Fertility by Education by Marriage Status in McKittrick
| Educational Attainment | Married | Unmarried |
| Less than High School | 0 (0.0%) | 0 (0.0%) |
| High School Diploma | 0 (0.0%) | 0 (0.0%) |
| College or Associate's Degree | 0 (0.0%) | 0 (0.0%) |
| Bachelor's Degree | 0 (0.0%) | 0 (0.0%) |
| Graduate Degree | 0 (0.0%) | 0 (0.0%) |
| Total | 0 (0.0%) | 0 (0.0%) |
Employment Characteristics in McKittrick
Employment by Class of Employer in McKittrick
Among the 40 employed individuals in McKittrick, private company employees (22 | 55.0%), local government employees (7 | 17.5%), and self-employed (not incorporated) (6 | 15.0%) make up the most common classes of employment.
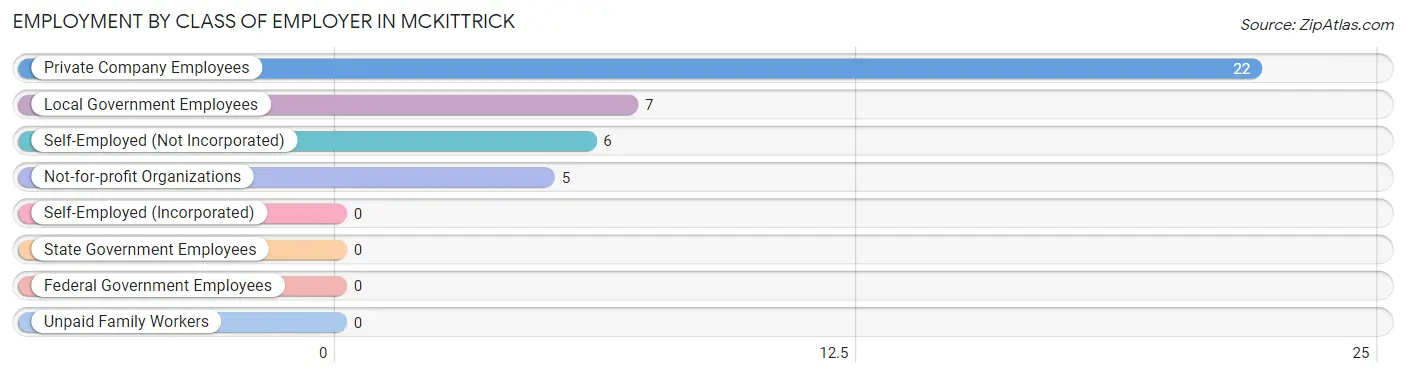
| Employer Class | # Employees | % Employees |
| Private Company Employees | 22 | 55.0% |
| Self-Employed (Incorporated) | 0 | 0.0% |
| Self-Employed (Not Incorporated) | 6 | 15.0% |
| Not-for-profit Organizations | 5 | 12.5% |
| Local Government Employees | 7 | 17.5% |
| State Government Employees | 0 | 0.0% |
| Federal Government Employees | 0 | 0.0% |
| Unpaid Family Workers | 0 | 0.0% |
| Total | 40 | 100.0% |
Employment Status by Age in McKittrick
According to the labor force statistics for McKittrick, out of the total population over 16 years of age (79), 58.2% or 46 individuals are in the labor force, with 13.0% or 6 of them unemployed. The age group with the highest labor force participation rate is 25 to 29 years, with 100.0% or 6 individuals in the labor force. Within the labor force, the 20 to 24 years age range has the highest percentage of unemployed individuals, with 100.0% or 5 of them being unemployed.
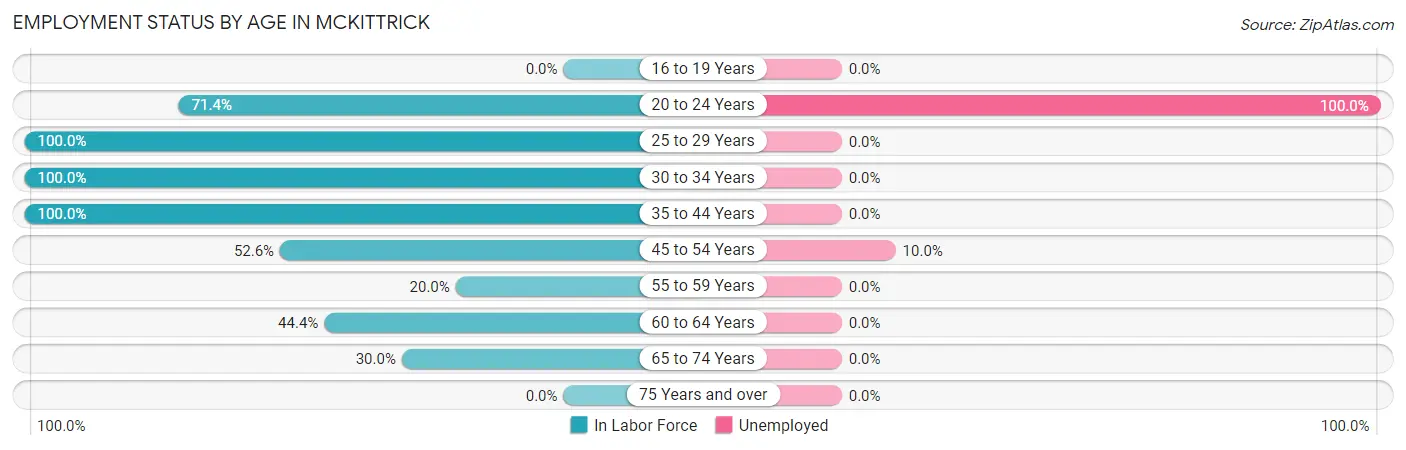
| Age Bracket | In Labor Force | Unemployed |
| 16 to 19 Years | 0 (0.0%) | 0 (0.0%) |
| 20 to 24 Years | 5 (71.4%) | 5 (100.0%) |
| 25 to 29 Years | 6 (100.0%) | 0 (0.0%) |
| 30 to 34 Years | 10 (100.0%) | 0 (0.0%) |
| 35 to 44 Years | 7 (100.0%) | 0 (0.0%) |
| 45 to 54 Years | 10 (52.6%) | 1 (10.0%) |
| 55 to 59 Years | 1 (20.0%) | 0 (0.0%) |
| 60 to 64 Years | 4 (44.4%) | 0 (0.0%) |
| 65 to 74 Years | 3 (30.0%) | 0 (0.0%) |
| 75 Years and over | 0 (0.0%) | 0 (0.0%) |
| Total | 46 (58.2%) | 6 (13.0%) |
Employment Status by Educational Attainment in McKittrick
According to labor force statistics for McKittrick, 67.9% of individuals (38) out of the total population between 25 and 64 years of age (56) are in the labor force, with 2.6% or 1 of them being unemployed. The group with the highest labor force participation rate are those with the educational attainment of less than high school, with 100.0% or 9 individuals in the labor force. Within the labor force, individuals with less than high school education have the highest percentage of unemployment, with 11.1% or 1 of them being unemployed.
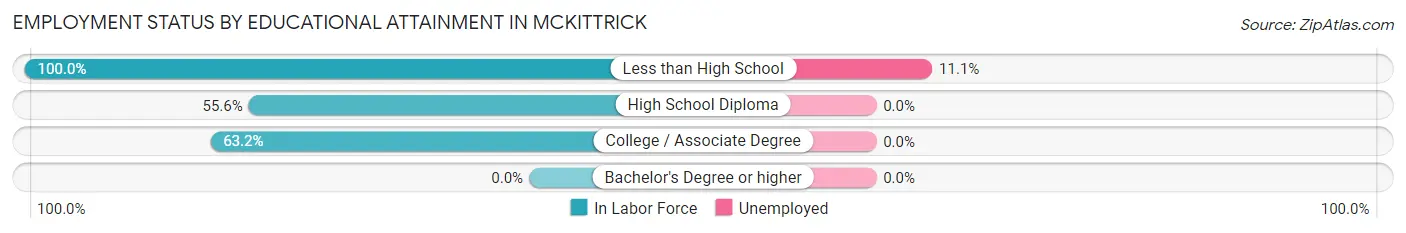
| Educational Attainment | In Labor Force | Unemployed |
| Less than High School | 9 (100.0%) | 1 (11.1%) |
| High School Diploma | 5 (55.6%) | 0 (0.0%) |
| College / Associate Degree | 24 (63.2%) | 0 (0.0%) |
| Bachelor's Degree or higher | 0 (0.0%) | 0 (0.0%) |
| Total | 38 (67.9%) | 1 (2.6%) |
Employment Occupations by Sex in McKittrick
Management, Business, Science and Arts Occupations
The most common Management, Business, Science and Arts occupations in McKittrick are Community & Social Service (3 | 7.5%), and Education, Arts & Media (3 | 7.5%).
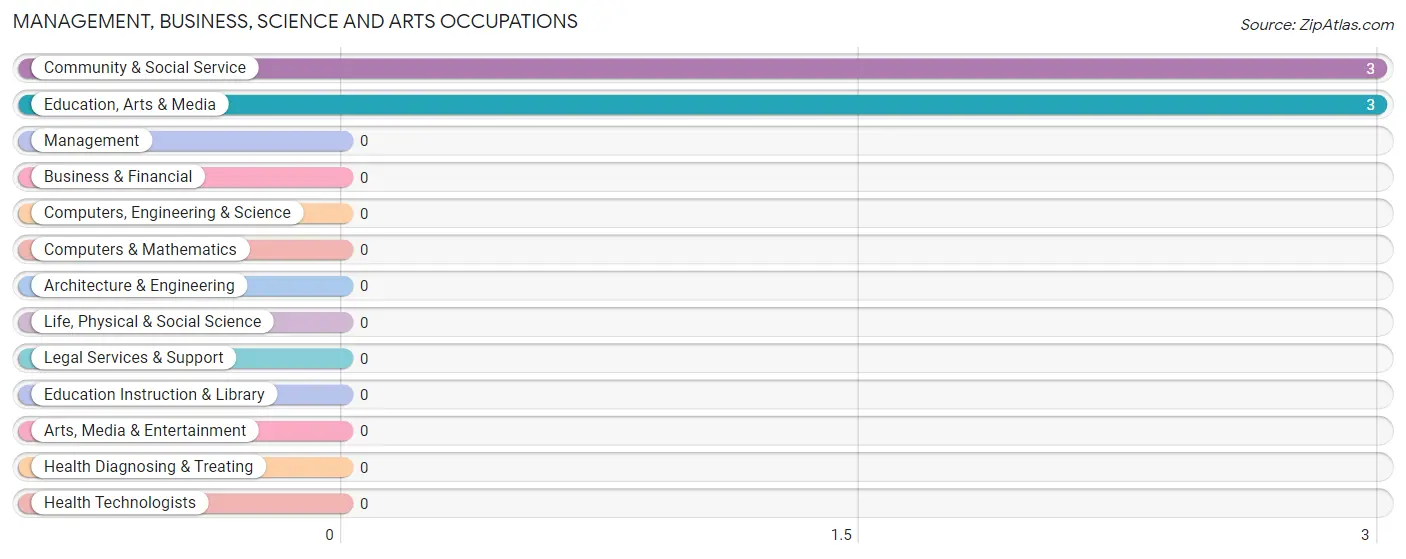
Management, Business, Science and Arts Occupations by Sex
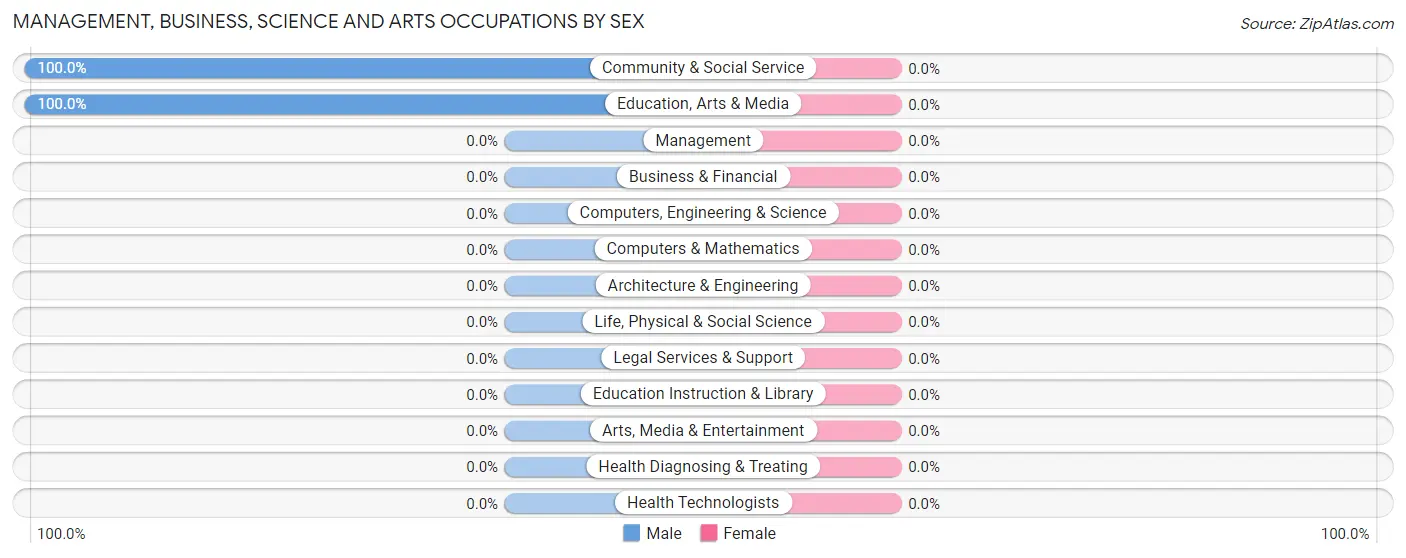
| Occupation | Male | Female |
| Management | 0 (0.0%) | 0 (0.0%) |
| Business & Financial | 0 (0.0%) | 0 (0.0%) |
| Computers, Engineering & Science | 0 (0.0%) | 0 (0.0%) |
| Computers & Mathematics | 0 (0.0%) | 0 (0.0%) |
| Architecture & Engineering | 0 (0.0%) | 0 (0.0%) |
| Life, Physical & Social Science | 0 (0.0%) | 0 (0.0%) |
| Community & Social Service | 3 (100.0%) | 0 (0.0%) |
| Education, Arts & Media | 3 (100.0%) | 0 (0.0%) |
| Legal Services & Support | 0 (0.0%) | 0 (0.0%) |
| Education Instruction & Library | 0 (0.0%) | 0 (0.0%) |
| Arts, Media & Entertainment | 0 (0.0%) | 0 (0.0%) |
| Health Diagnosing & Treating | 0 (0.0%) | 0 (0.0%) |
| Health Technologists | 0 (0.0%) | 0 (0.0%) |
| Total (Category) | 3 (100.0%) | 0 (0.0%) |
| Total (Overall) | 26 (65.0%) | 14 (35.0%) |
Services Occupations
The most common Services occupations in McKittrick are Cleaning & Maintenance (6 | 15.0%), and Food Preparation & Serving (2 | 5.0%).
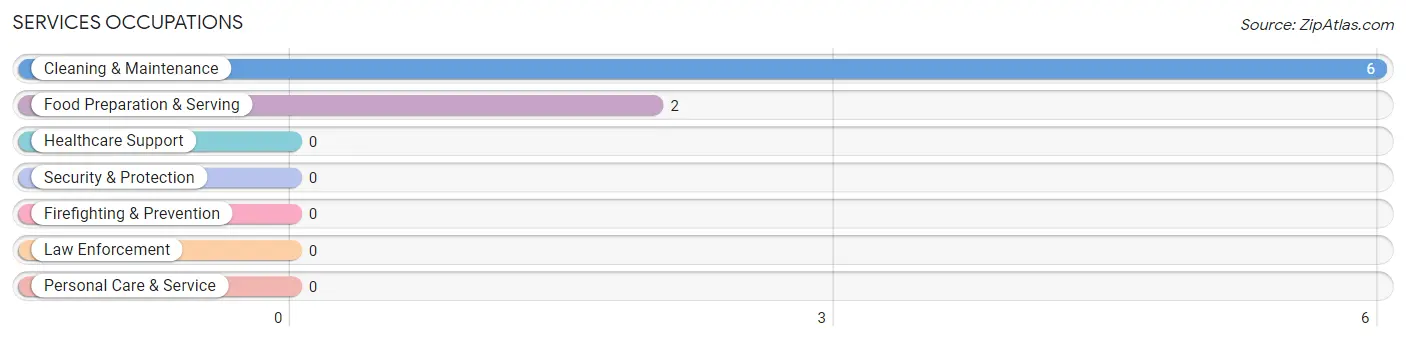
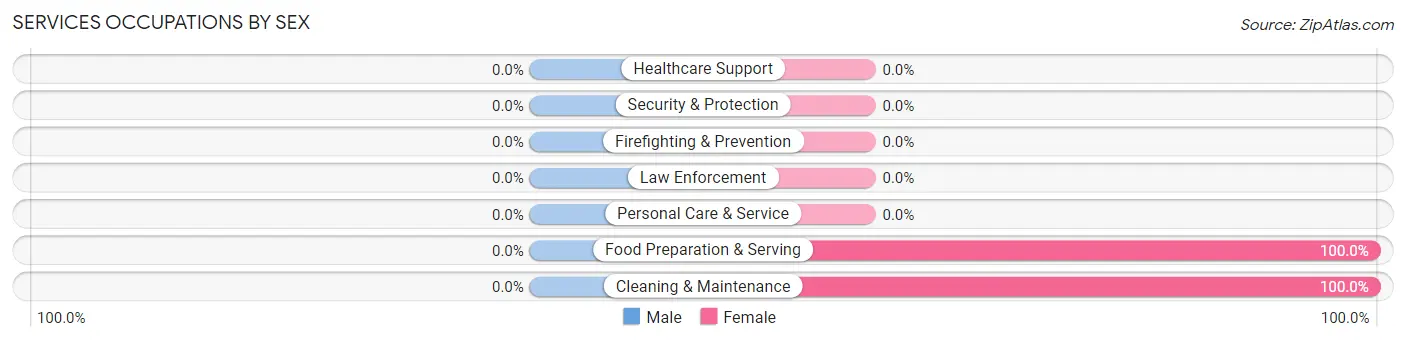
Services Occupations by Sex
| Occupation | Male | Female |
| Healthcare Support | 0 (0.0%) | 0 (0.0%) |
| Security & Protection | 0 (0.0%) | 0 (0.0%) |
| Firefighting & Prevention | 0 (0.0%) | 0 (0.0%) |
| Law Enforcement | 0 (0.0%) | 0 (0.0%) |
| Food Preparation & Serving | 0 (0.0%) | 2 (100.0%) |
| Cleaning & Maintenance | 0 (0.0%) | 6 (100.0%) |
| Personal Care & Service | 0 (0.0%) | 0 (0.0%) |
| Total (Category) | 0 (0.0%) | 8 (100.0%) |
| Total (Overall) | 26 (65.0%) | 14 (35.0%) |
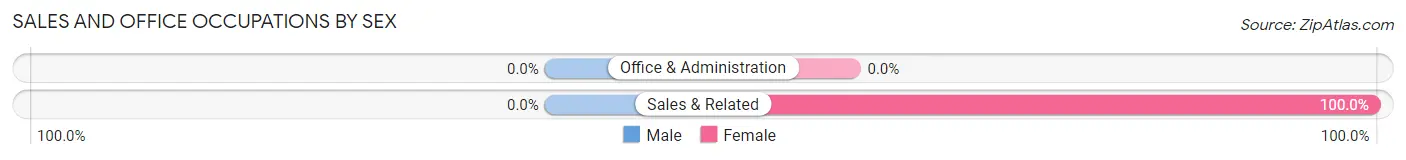
Sales and Office Occupations
The most common Sales and Office occupations in McKittrick are , and Sales & Related (6 | 15.0%).
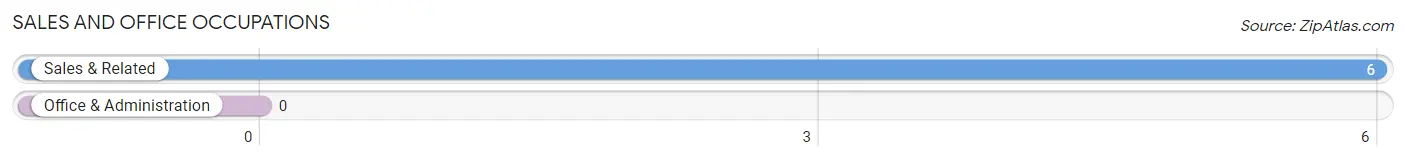
Sales and Office Occupations by Sex
| Occupation | Male | Female |
| Sales & Related | 0 (0.0%) | 6 (100.0%) |
| Office & Administration | 0 (0.0%) | 0 (0.0%) |
| Total (Category) | 0 (0.0%) | 6 (100.0%) |
| Total (Overall) | 26 (65.0%) | 14 (35.0%) |
Natural Resources, Construction and Maintenance Occupations
The most common Natural Resources, Construction and Maintenance occupations in McKittrick are Installation, Maintenance & Repair (8 | 20.0%), and Construction & Extraction (7 | 17.5%).
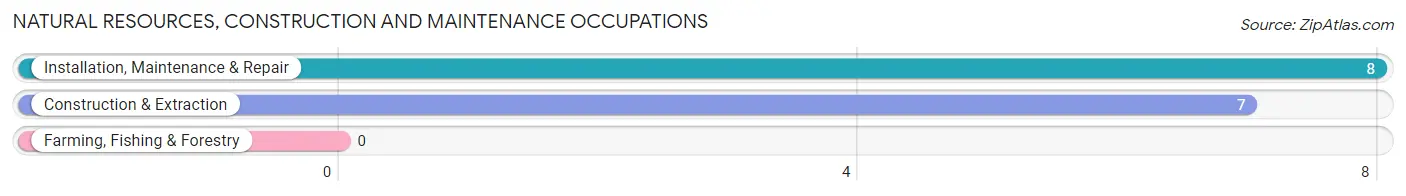
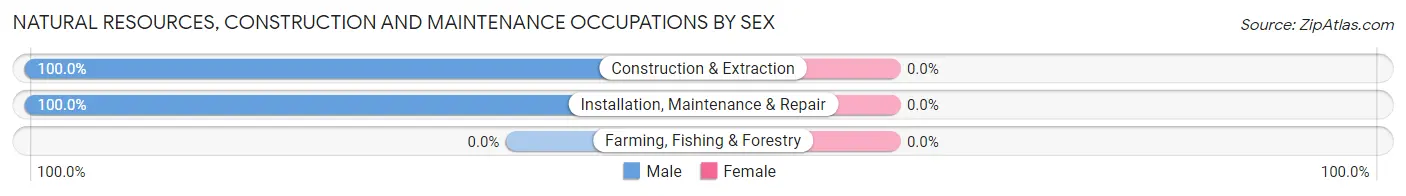
Natural Resources, Construction and Maintenance Occupations by Sex
| Occupation | Male | Female |
| Farming, Fishing & Forestry | 0 (0.0%) | 0 (0.0%) |
| Construction & Extraction | 7 (100.0%) | 0 (0.0%) |
| Installation, Maintenance & Repair | 8 (100.0%) | 0 (0.0%) |
| Total (Category) | 15 (100.0%) | 0 (0.0%) |
| Total (Overall) | 26 (65.0%) | 14 (35.0%) |
Production, Transportation and Moving Occupations
The most common Production, Transportation and Moving occupations in McKittrick are Production (4 | 10.0%), and Transportation (4 | 10.0%).
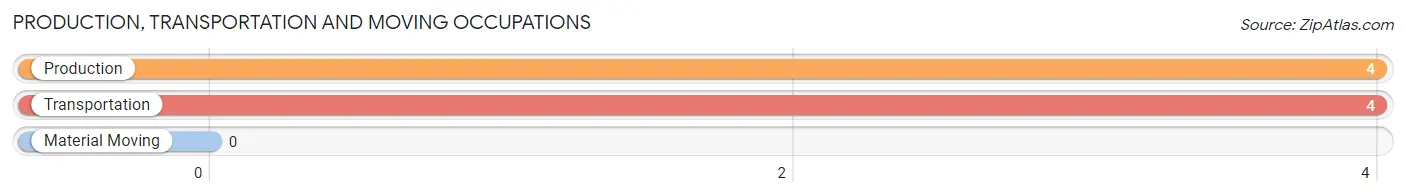
Production, Transportation and Moving Occupations by Sex
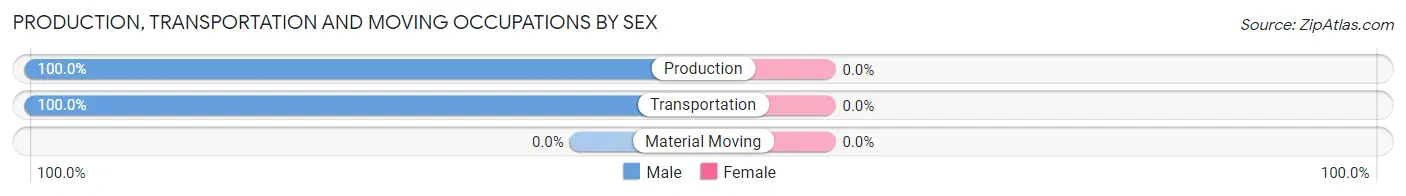
| Occupation | Male | Female |
| Production | 4 (100.0%) | 0 (0.0%) |
| Transportation | 4 (100.0%) | 0 (0.0%) |
| Material Moving | 0 (0.0%) | 0 (0.0%) |
| Total (Category) | 8 (100.0%) | 0 (0.0%) |
| Total (Overall) | 26 (65.0%) | 14 (35.0%) |
Employment Industries by Sex in McKittrick
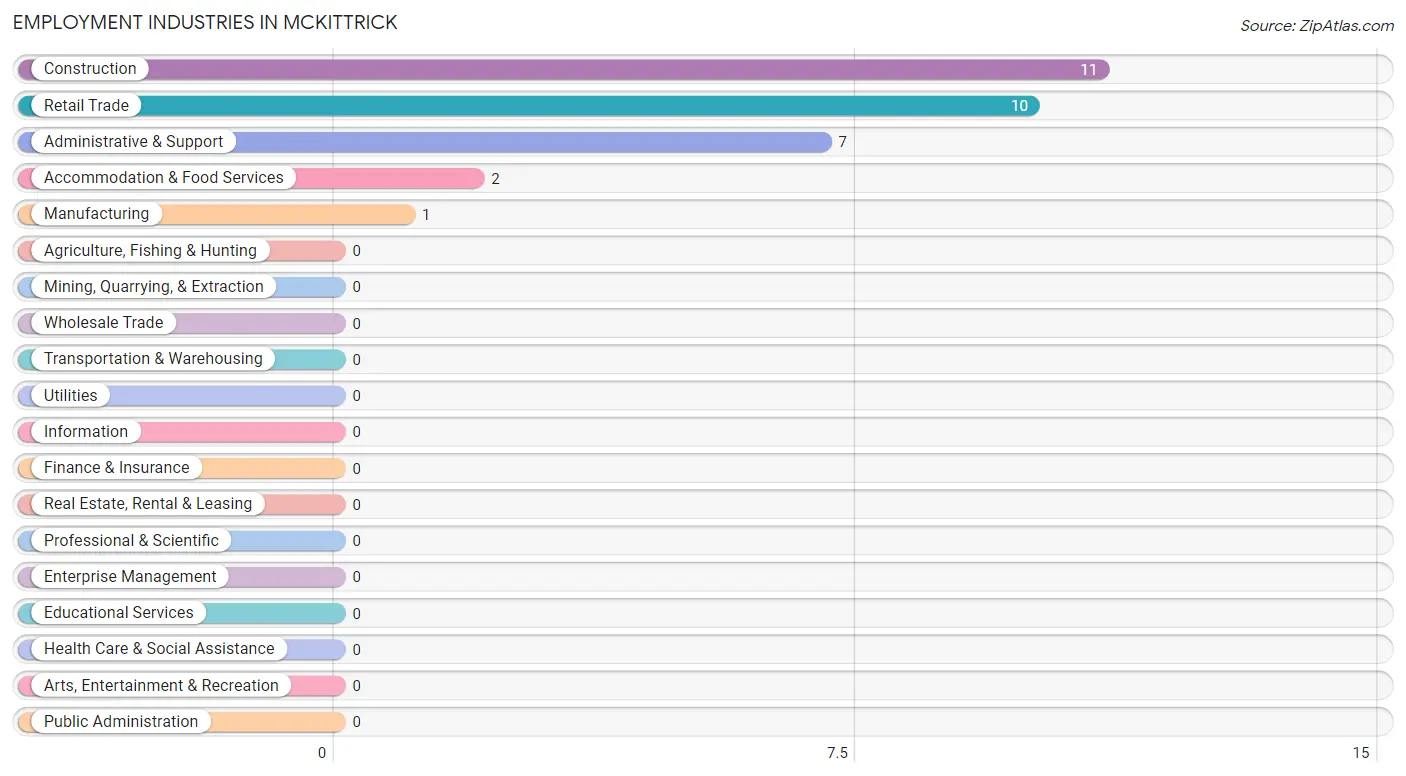
Employment Industries in McKittrick
The major employment industries in McKittrick include Construction (11 | 27.5%), Retail Trade (10 | 25.0%), Administrative & Support (7 | 17.5%), Accommodation & Food Services (2 | 5.0%), and Manufacturing (1 | 2.5%).
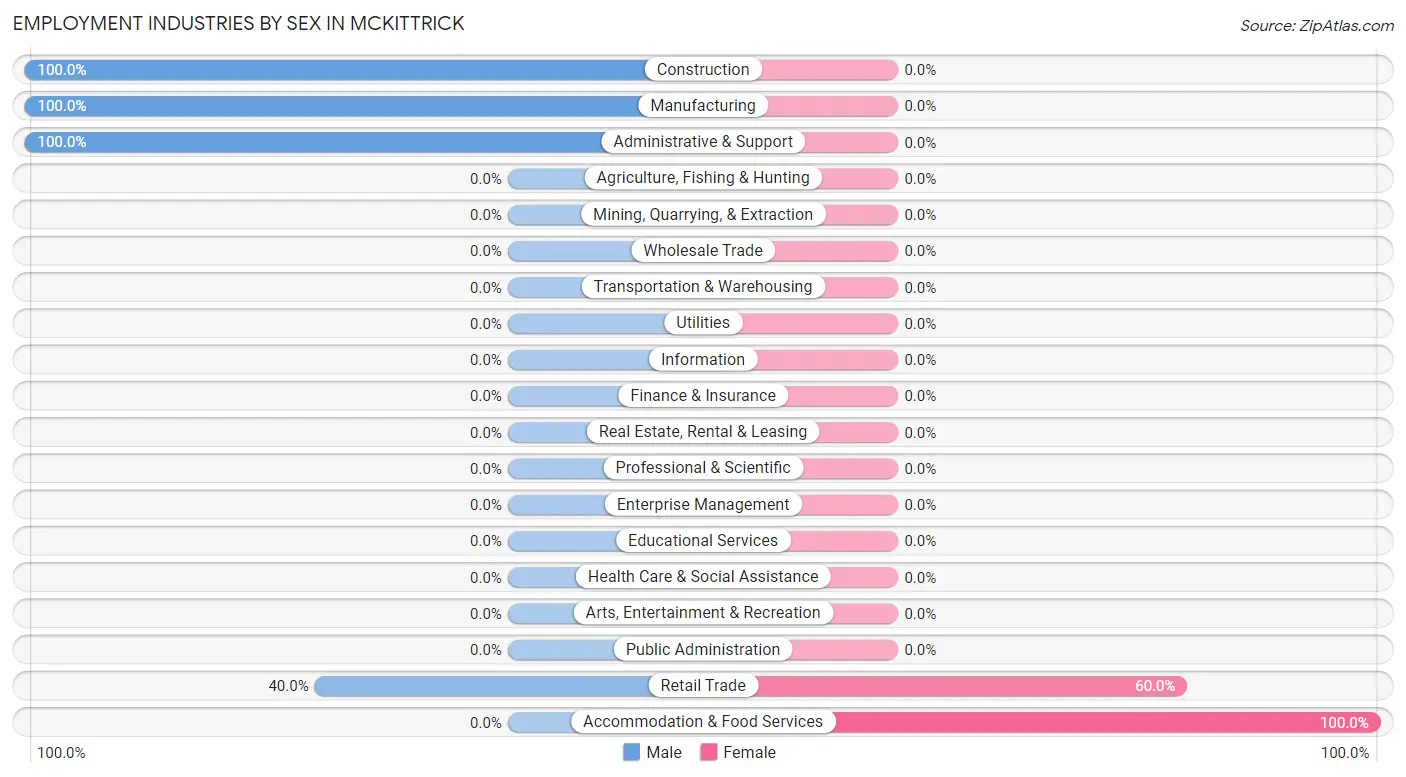
Employment Industries by Sex in McKittrick
The McKittrick industries that see more men than women are Construction (100.0%), Manufacturing (100.0%), and Administrative & Support (100.0%), whereas the industries that tend to have a higher number of women are Accommodation & Food Services (100.0%), and Retail Trade (60.0%).
| Industry | Male | Female |
| Agriculture, Fishing & Hunting | 0 (0.0%) | 0 (0.0%) |
| Mining, Quarrying, & Extraction | 0 (0.0%) | 0 (0.0%) |
| Construction | 11 (100.0%) | 0 (0.0%) |
| Manufacturing | 1 (100.0%) | 0 (0.0%) |
| Wholesale Trade | 0 (0.0%) | 0 (0.0%) |
| Retail Trade | 4 (40.0%) | 6 (60.0%) |
| Transportation & Warehousing | 0 (0.0%) | 0 (0.0%) |
| Utilities | 0 (0.0%) | 0 (0.0%) |
| Information | 0 (0.0%) | 0 (0.0%) |
| Finance & Insurance | 0 (0.0%) | 0 (0.0%) |
| Real Estate, Rental & Leasing | 0 (0.0%) | 0 (0.0%) |
| Professional & Scientific | 0 (0.0%) | 0 (0.0%) |
| Enterprise Management | 0 (0.0%) | 0 (0.0%) |
| Administrative & Support | 7 (100.0%) | 0 (0.0%) |
| Educational Services | 0 (0.0%) | 0 (0.0%) |
| Health Care & Social Assistance | 0 (0.0%) | 0 (0.0%) |
| Arts, Entertainment & Recreation | 0 (0.0%) | 0 (0.0%) |
| Accommodation & Food Services | 0 (0.0%) | 2 (100.0%) |
| Public Administration | 0 (0.0%) | 0 (0.0%) |
| Total | 26 (65.0%) | 14 (35.0%) |
Education in McKittrick
School Enrollment in McKittrick
The most common levels of schooling among the 17 students in McKittrick are nursery / preschool (6 | 35.3%), elementary school (6 | 35.3%), and college / undergraduate (5 | 29.4%).
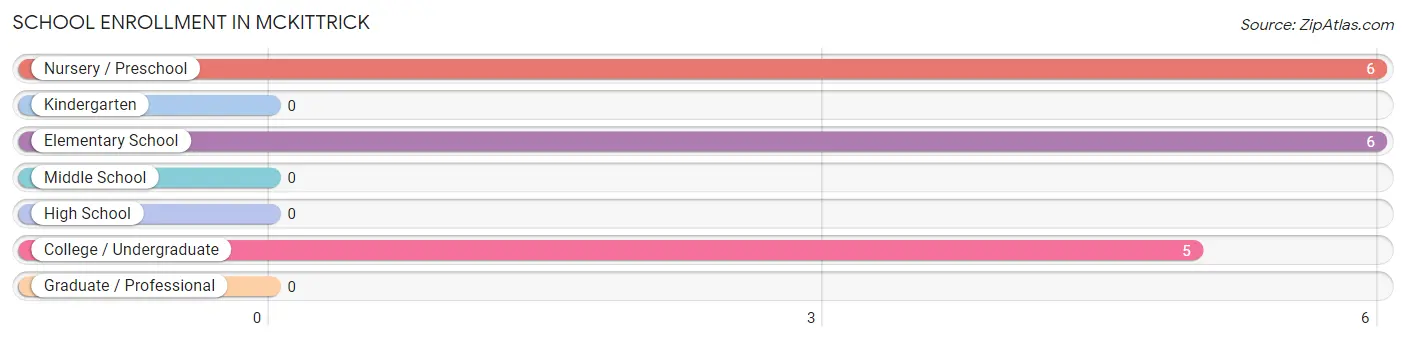
| School Level | # Students | % Students |
| Nursery / Preschool | 6 | 35.3% |
| Kindergarten | 0 | 0.0% |
| Elementary School | 6 | 35.3% |
| Middle School | 0 | 0.0% |
| High School | 0 | 0.0% |
| College / Undergraduate | 5 | 29.4% |
| Graduate / Professional | 0 | 0.0% |
| Total | 17 | 100.0% |
School Enrollment by Age by Funding Source in McKittrick
Out of a total of 17 students who are enrolled in schools in McKittrick, 6 (35.3%) attend a private institution, while the remaining 11 (64.7%) are enrolled in public schools. The age group of 3 to 4 year olds has the highest likelihood of being enrolled in private schools, with 6 (100.0% in the age bracket) enrolled. Conversely, the age group of 5 to 9 year old has the lowest likelihood of being enrolled in a private school, with 6 (100.0% in the age bracket) attending a public institution.
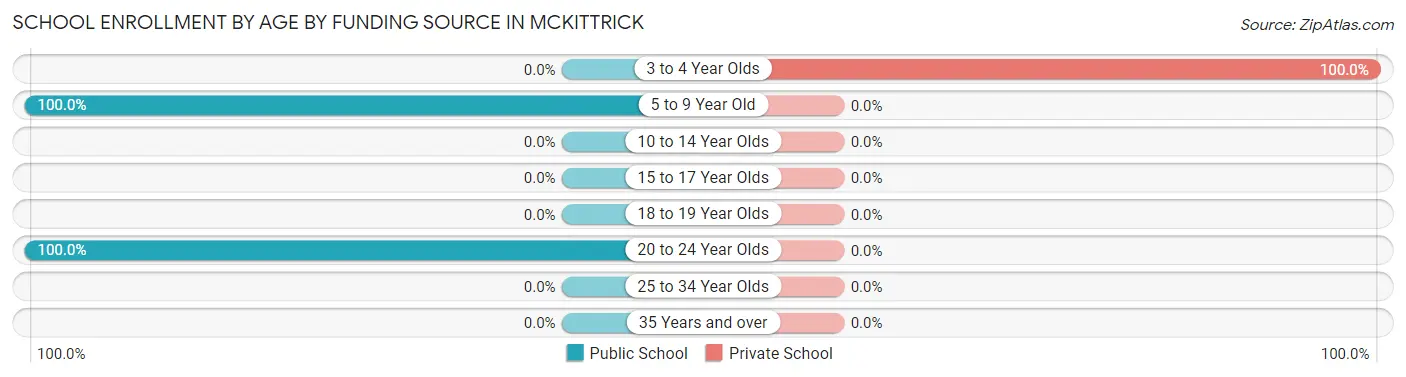
| Age Bracket | Public School | Private School |
| 3 to 4 Year Olds | 0 (0.0%) | 6 (100.0%) |
| 5 to 9 Year Old | 6 (100.0%) | 0 (0.0%) |
| 10 to 14 Year Olds | 0 (0.0%) | 0 (0.0%) |
| 15 to 17 Year Olds | 0 (0.0%) | 0 (0.0%) |
| 18 to 19 Year Olds | 0 (0.0%) | 0 (0.0%) |
| 20 to 24 Year Olds | 5 (100.0%) | 0 (0.0%) |
| 25 to 34 Year Olds | 0 (0.0%) | 0 (0.0%) |
| 35 Years and over | 0 (0.0%) | 0 (0.0%) |
| Total | 11 (64.7%) | 6 (35.3%) |
Educational Attainment by Field of Study in McKittrick
Bio, nature & agricultural (3 | 50.0%), and literature & languages (3 | 50.0%) are the most common fields of study among 6 individuals in McKittrick who have obtained a bachelor's degree or higher.
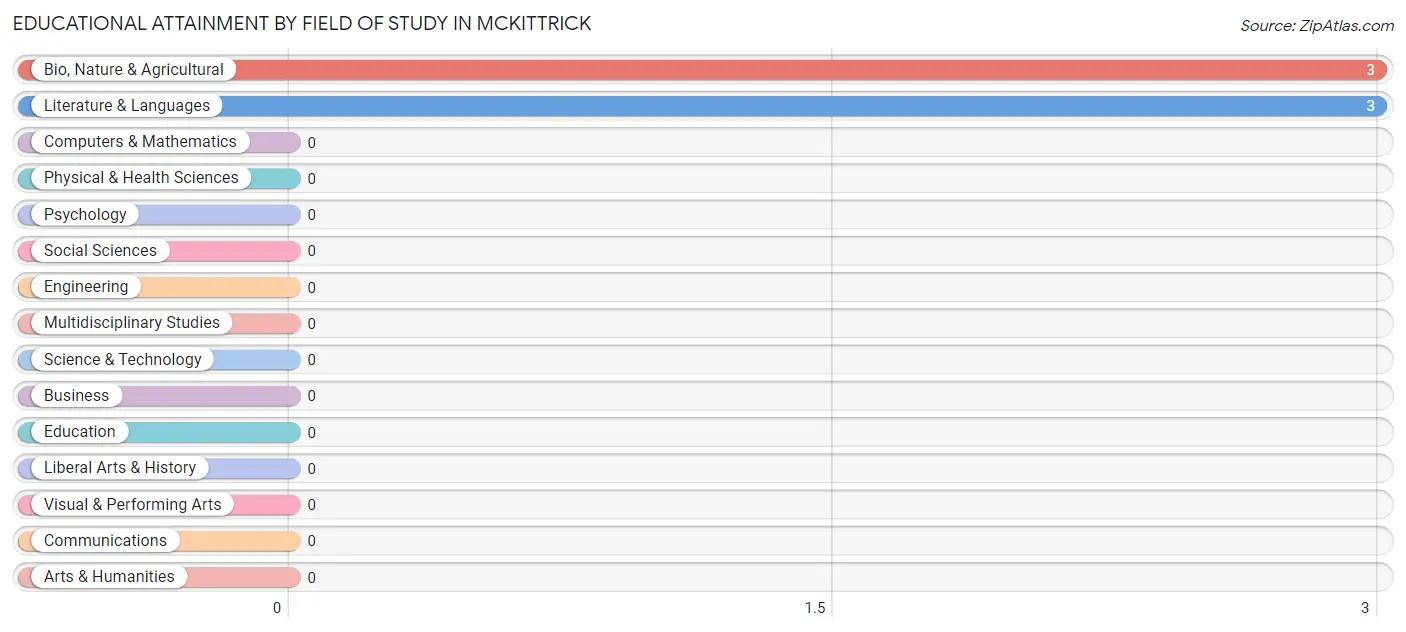
| Field of Study | # Graduates | % Graduates |
| Computers & Mathematics | 0 | 0.0% |
| Bio, Nature & Agricultural | 3 | 50.0% |
| Physical & Health Sciences | 0 | 0.0% |
| Psychology | 0 | 0.0% |
| Social Sciences | 0 | 0.0% |
| Engineering | 0 | 0.0% |
| Multidisciplinary Studies | 0 | 0.0% |
| Science & Technology | 0 | 0.0% |
| Business | 0 | 0.0% |
| Education | 0 | 0.0% |
| Literature & Languages | 3 | 50.0% |
| Liberal Arts & History | 0 | 0.0% |
| Visual & Performing Arts | 0 | 0.0% |
| Communications | 0 | 0.0% |
| Arts & Humanities | 0 | 0.0% |
| Total | 6 | 100.0% |
Transportation & Commute in McKittrick
Vehicle Availability by Sex in McKittrick
The most prevalent vehicle ownership categories in McKittrick are males with 3 vehicles (9, accounting for 39.1%) and females with 3 vehicles (0, making up 64.3%).
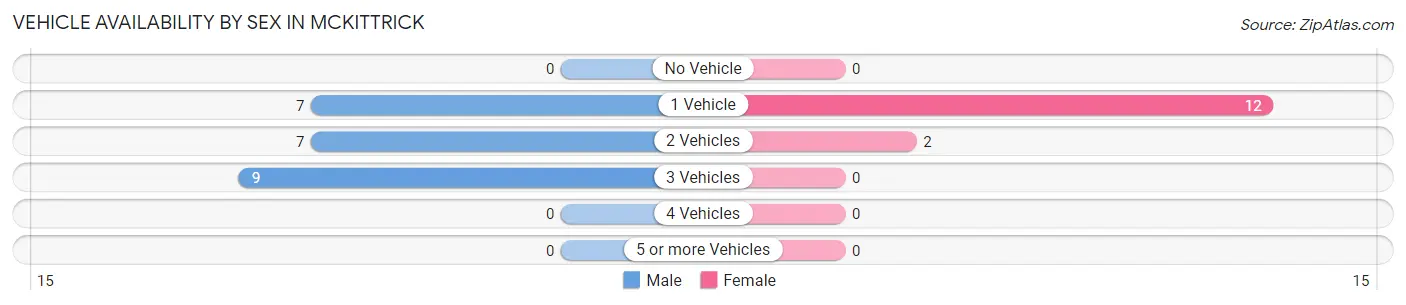
| Vehicles Available | Male | Female |
| No Vehicle | 0 (0.0%) | 0 (0.0%) |
| 1 Vehicle | 7 (30.4%) | 12 (85.7%) |
| 2 Vehicles | 7 (30.4%) | 2 (14.3%) |
| 3 Vehicles | 9 (39.1%) | 0 (0.0%) |
| 4 Vehicles | 0 (0.0%) | 0 (0.0%) |
| 5 or more Vehicles | 0 (0.0%) | 0 (0.0%) |
| Total | 23 (100.0%) | 14 (100.0%) |
Commute Time in McKittrick
The most frequently occuring commute durations in McKittrick are 10 to 14 minutes (10 commuters, 25.0%), 20 to 24 minutes (7 commuters, 17.5%), and 5 to 9 minutes (6 commuters, 15.0%).
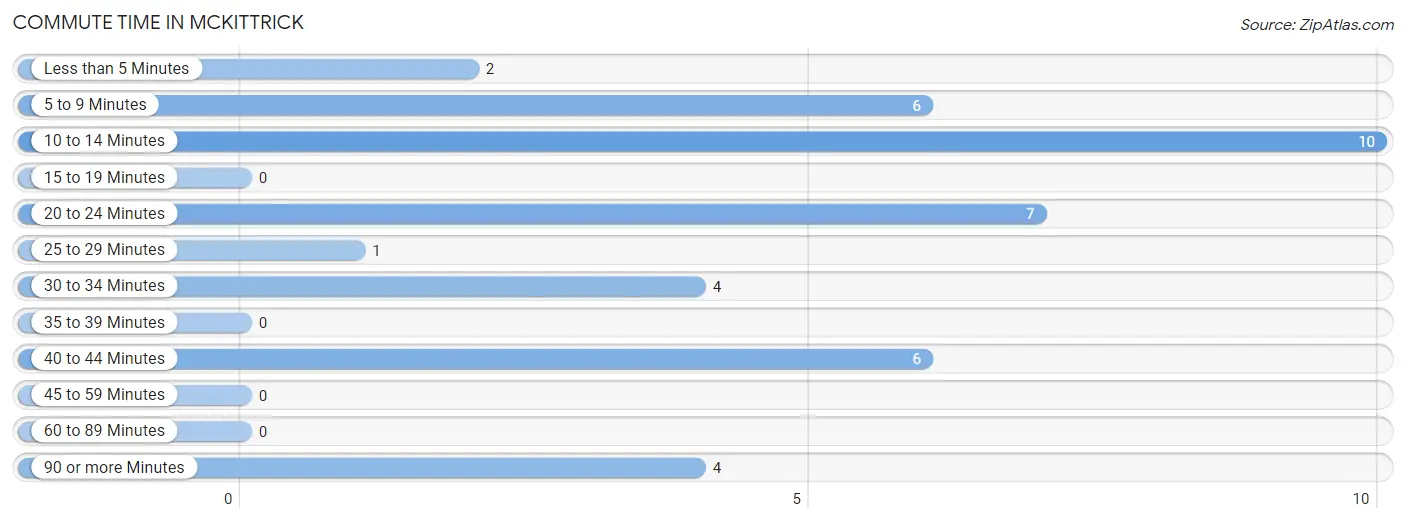
| Commute Time | # Commuters | % Commuters |
| Less than 5 Minutes | 2 | 5.0% |
| 5 to 9 Minutes | 6 | 15.0% |
| 10 to 14 Minutes | 10 | 25.0% |
| 15 to 19 Minutes | 0 | 0.0% |
| 20 to 24 Minutes | 7 | 17.5% |
| 25 to 29 Minutes | 1 | 2.5% |
| 30 to 34 Minutes | 4 | 10.0% |
| 35 to 39 Minutes | 0 | 0.0% |
| 40 to 44 Minutes | 6 | 15.0% |
| 45 to 59 Minutes | 0 | 0.0% |
| 60 to 89 Minutes | 0 | 0.0% |
| 90 or more Minutes | 4 | 10.0% |
Commute Time by Sex in McKittrick
The most common commute times in McKittrick are 10 to 14 minutes (10 commuters, 38.5%) for males and 5 to 9 minutes (6 commuters, 42.9%) for females.
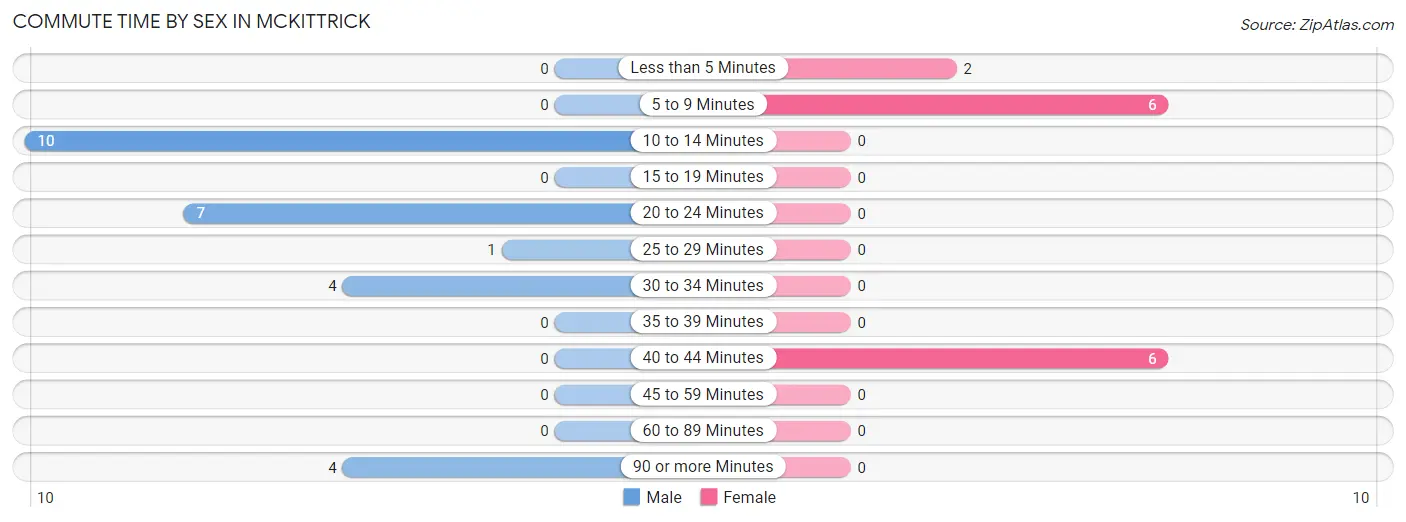
| Commute Time | Male | Female |
| Less than 5 Minutes | 0 (0.0%) | 2 (14.3%) |
| 5 to 9 Minutes | 0 (0.0%) | 6 (42.9%) |
| 10 to 14 Minutes | 10 (38.5%) | 0 (0.0%) |
| 15 to 19 Minutes | 0 (0.0%) | 0 (0.0%) |
| 20 to 24 Minutes | 7 (26.9%) | 0 (0.0%) |
| 25 to 29 Minutes | 1 (3.8%) | 0 (0.0%) |
| 30 to 34 Minutes | 4 (15.4%) | 0 (0.0%) |
| 35 to 39 Minutes | 0 (0.0%) | 0 (0.0%) |
| 40 to 44 Minutes | 0 (0.0%) | 6 (42.9%) |
| 45 to 59 Minutes | 0 (0.0%) | 0 (0.0%) |
| 60 to 89 Minutes | 0 (0.0%) | 0 (0.0%) |
| 90 or more Minutes | 4 (15.4%) | 0 (0.0%) |
Time of Departure to Work by Sex in McKittrick
The most frequent times of departure to work in McKittrick are 6:00 AM to 6:29 AM (7, 26.9%) for males and 12:00 AM to 4:59 AM (6, 42.9%) for females.
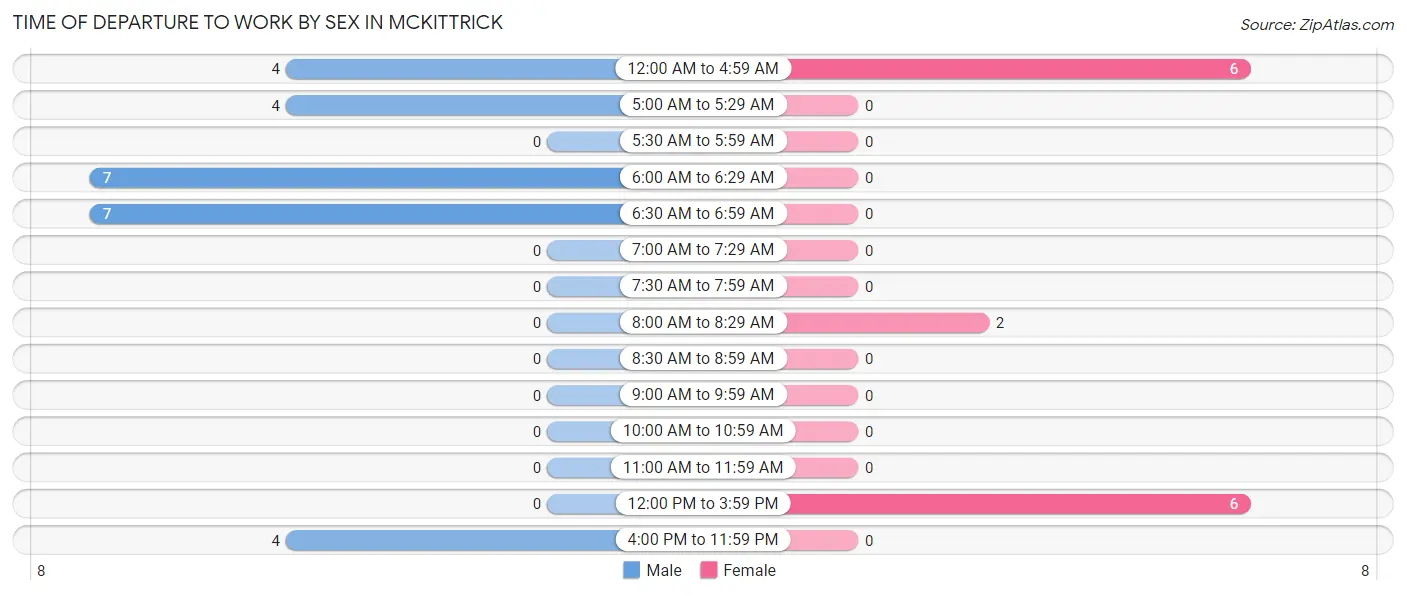
| Time of Departure | Male | Female |
| 12:00 AM to 4:59 AM | 4 (15.4%) | 6 (42.9%) |
| 5:00 AM to 5:29 AM | 4 (15.4%) | 0 (0.0%) |
| 5:30 AM to 5:59 AM | 0 (0.0%) | 0 (0.0%) |
| 6:00 AM to 6:29 AM | 7 (26.9%) | 0 (0.0%) |
| 6:30 AM to 6:59 AM | 7 (26.9%) | 0 (0.0%) |
| 7:00 AM to 7:29 AM | 0 (0.0%) | 0 (0.0%) |
| 7:30 AM to 7:59 AM | 0 (0.0%) | 0 (0.0%) |
| 8:00 AM to 8:29 AM | 0 (0.0%) | 2 (14.3%) |
| 8:30 AM to 8:59 AM | 0 (0.0%) | 0 (0.0%) |
| 9:00 AM to 9:59 AM | 0 (0.0%) | 0 (0.0%) |
| 10:00 AM to 10:59 AM | 0 (0.0%) | 0 (0.0%) |
| 11:00 AM to 11:59 AM | 0 (0.0%) | 0 (0.0%) |
| 12:00 PM to 3:59 PM | 0 (0.0%) | 6 (42.9%) |
| 4:00 PM to 11:59 PM | 4 (15.4%) | 0 (0.0%) |
| Total | 26 (100.0%) | 14 (100.0%) |
Housing Occupancy in McKittrick
Occupancy by Ownership in McKittrick
Of the total 36 dwellings in McKittrick, owner-occupied units account for 20 (55.6%), while renter-occupied units make up 16 (44.4%).
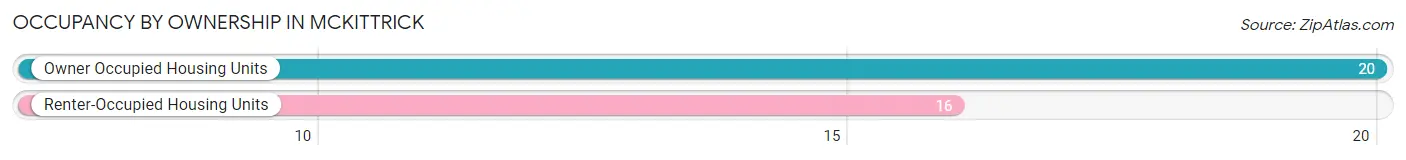
| Occupancy | # Housing Units | % Housing Units |
| Owner Occupied Housing Units | 20 | 55.6% |
| Renter-Occupied Housing Units | 16 | 44.4% |
| Total Occupied Housing Units | 36 | 100.0% |
Occupancy by Household Size in McKittrick
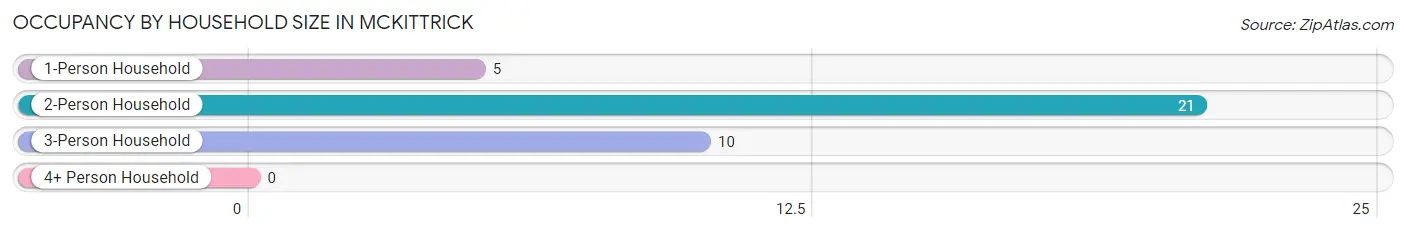
| Household Size | # Housing Units | % Housing Units |
| 1-Person Household | 5 | 13.9% |
| 2-Person Household | 21 | 58.3% |
| 3-Person Household | 10 | 27.8% |
| 4+ Person Household | 0 | 0.0% |
| Total Housing Units | 36 | 100.0% |
Occupancy by Ownership by Household Size in McKittrick
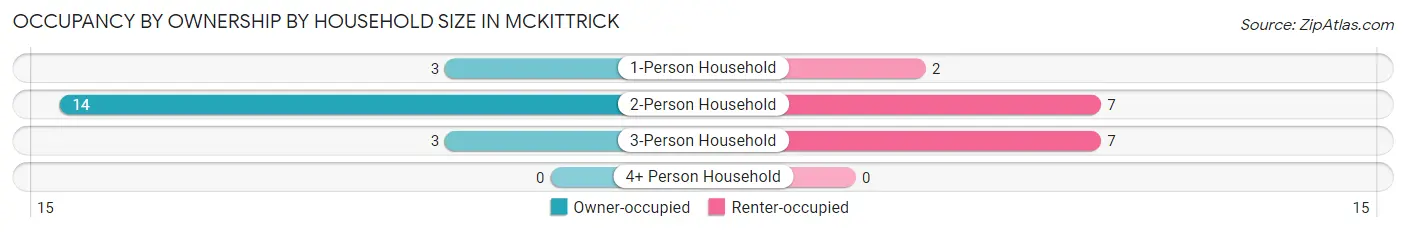
| Household Size | Owner-occupied | Renter-occupied |
| 1-Person Household | 3 (60.0%) | 2 (40.0%) |
| 2-Person Household | 14 (66.7%) | 7 (33.3%) |
| 3-Person Household | 3 (30.0%) | 7 (70.0%) |
| 4+ Person Household | 0 (0.0%) | 0 (0.0%) |
| Total Housing Units | 20 (55.6%) | 16 (44.4%) |
Occupancy by Educational Attainment in McKittrick
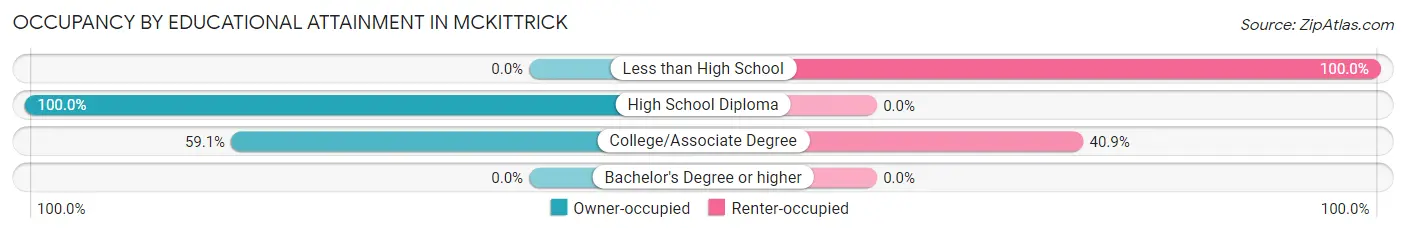
| Household Size | Owner-occupied | Renter-occupied |
| Less than High School | 0 (0.0%) | 7 (100.0%) |
| High School Diploma | 7 (100.0%) | 0 (0.0%) |
| College/Associate Degree | 13 (59.1%) | 9 (40.9%) |
| Bachelor's Degree or higher | 0 (0.0%) | 0 (0.0%) |
Occupancy by Age of Householder in McKittrick
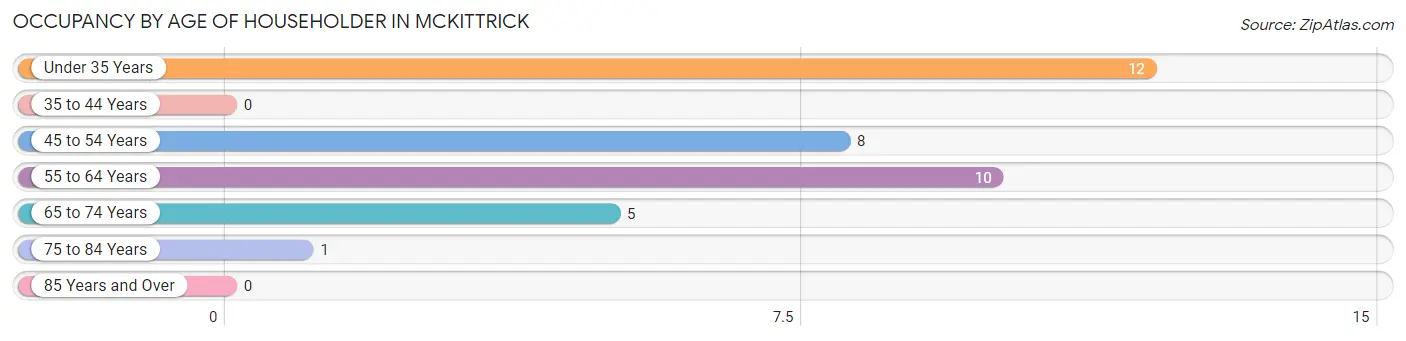
| Age Bracket | # Households | % Households |
| Under 35 Years | 12 | 33.3% |
| 35 to 44 Years | 0 | 0.0% |
| 45 to 54 Years | 8 | 22.2% |
| 55 to 64 Years | 10 | 27.8% |
| 65 to 74 Years | 5 | 13.9% |
| 75 to 84 Years | 1 | 2.8% |
| 85 Years and Over | 0 | 0.0% |
| Total | 36 | 100.0% |
Housing Finances in McKittrick
Median Income by Occupancy in McKittrick
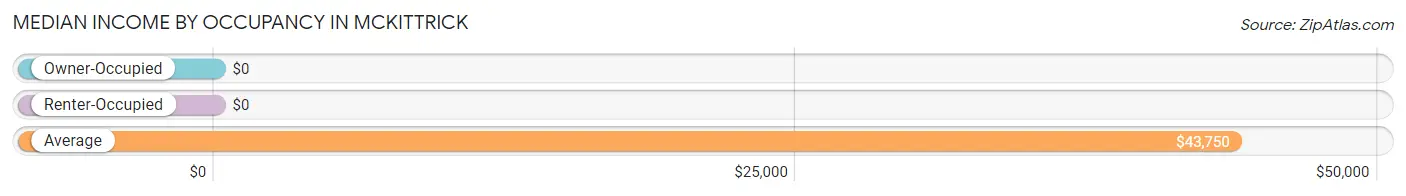
| Occupancy Type | # Households | Median Income |
| Owner-Occupied | 20 (55.6%) | $0 |
| Renter-Occupied | 16 (44.4%) | $0 |
| Average | 36 (100.0%) | $43,750 |
Occupancy by Householder Income Bracket in McKittrick
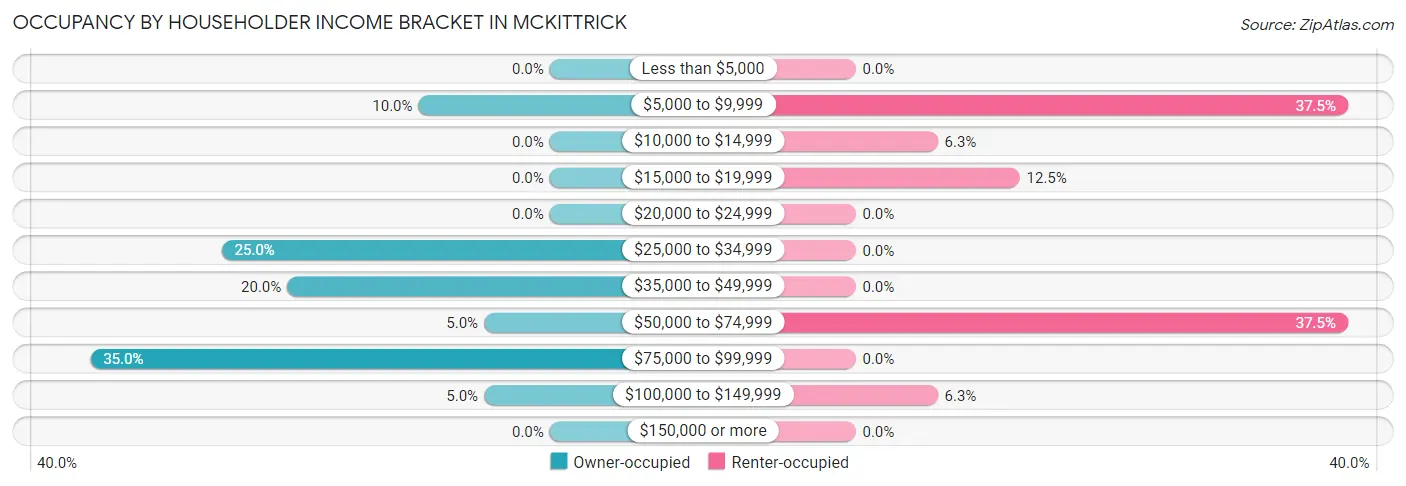
| Income Bracket | Owner-occupied | Renter-occupied |
| Less than $5,000 | 0 (0.0%) | 0 (0.0%) |
| $5,000 to $9,999 | 2 (10.0%) | 6 (37.5%) |
| $10,000 to $14,999 | 0 (0.0%) | 1 (6.2%) |
| $15,000 to $19,999 | 0 (0.0%) | 2 (12.5%) |
| $20,000 to $24,999 | 0 (0.0%) | 0 (0.0%) |
| $25,000 to $34,999 | 5 (25.0%) | 0 (0.0%) |
| $35,000 to $49,999 | 4 (20.0%) | 0 (0.0%) |
| $50,000 to $74,999 | 1 (5.0%) | 6 (37.5%) |
| $75,000 to $99,999 | 7 (35.0%) | 0 (0.0%) |
| $100,000 to $149,999 | 1 (5.0%) | 1 (6.2%) |
| $150,000 or more | 0 (0.0%) | 0 (0.0%) |
| Total | 20 (100.0%) | 16 (100.0%) |
Monthly Housing Cost Tiers in McKittrick
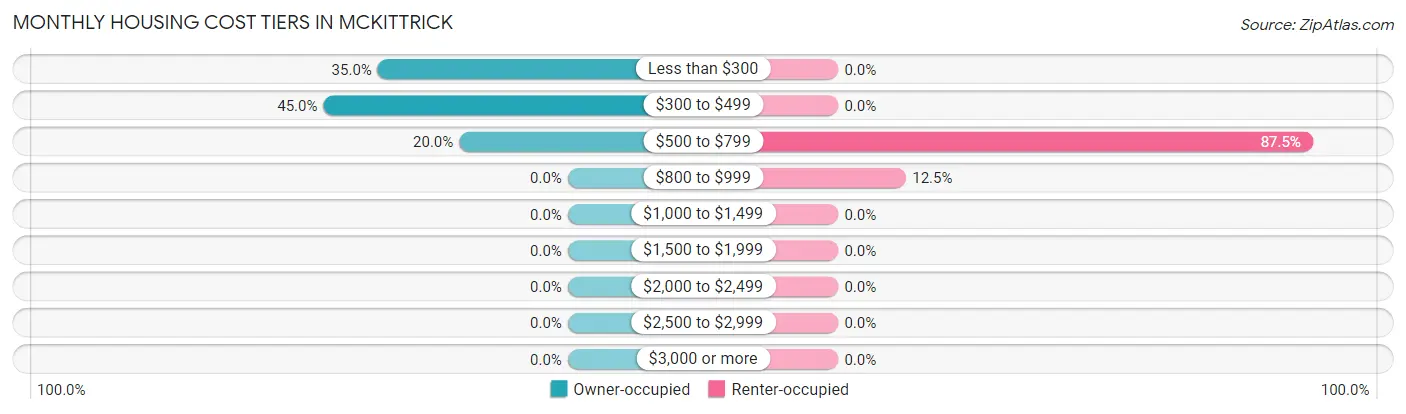
| Monthly Cost | Owner-occupied | Renter-occupied |
| Less than $300 | 7 (35.0%) | 0 (0.0%) |
| $300 to $499 | 9 (45.0%) | 0 (0.0%) |
| $500 to $799 | 4 (20.0%) | 14 (87.5%) |
| $800 to $999 | 0 (0.0%) | 2 (12.5%) |
| $1,000 to $1,499 | 0 (0.0%) | 0 (0.0%) |
| $1,500 to $1,999 | 0 (0.0%) | 0 (0.0%) |
| $2,000 to $2,499 | 0 (0.0%) | 0 (0.0%) |
| $2,500 to $2,999 | 0 (0.0%) | 0 (0.0%) |
| $3,000 or more | 0 (0.0%) | 0 (0.0%) |
| Total | 20 (100.0%) | 16 (100.0%) |
Physical Housing Characteristics in McKittrick
Housing Structures in McKittrick
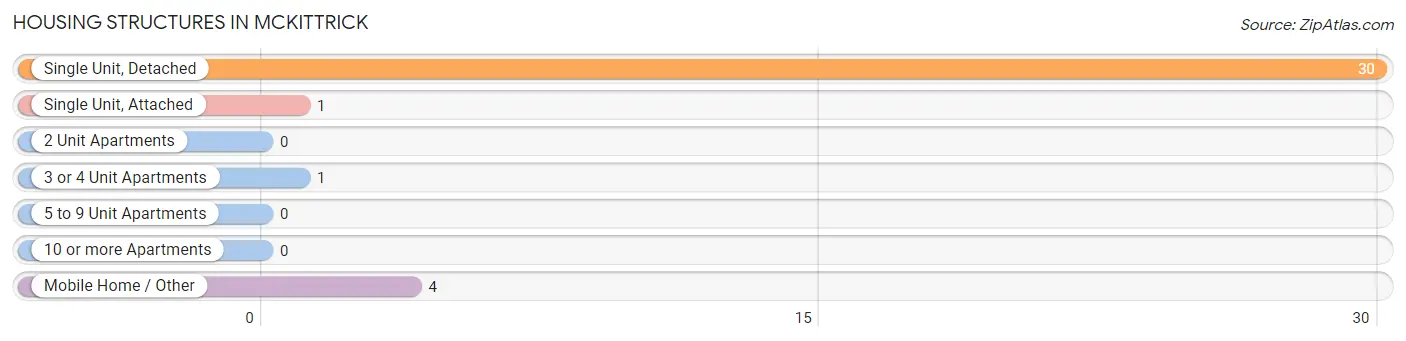
| Structure Type | # Housing Units | % Housing Units |
| Single Unit, Detached | 30 | 83.3% |
| Single Unit, Attached | 1 | 2.8% |
| 2 Unit Apartments | 0 | 0.0% |
| 3 or 4 Unit Apartments | 1 | 2.8% |
| 5 to 9 Unit Apartments | 0 | 0.0% |
| 10 or more Apartments | 0 | 0.0% |
| Mobile Home / Other | 4 | 11.1% |
| Total | 36 | 100.0% |
Housing Structures by Occupancy in McKittrick
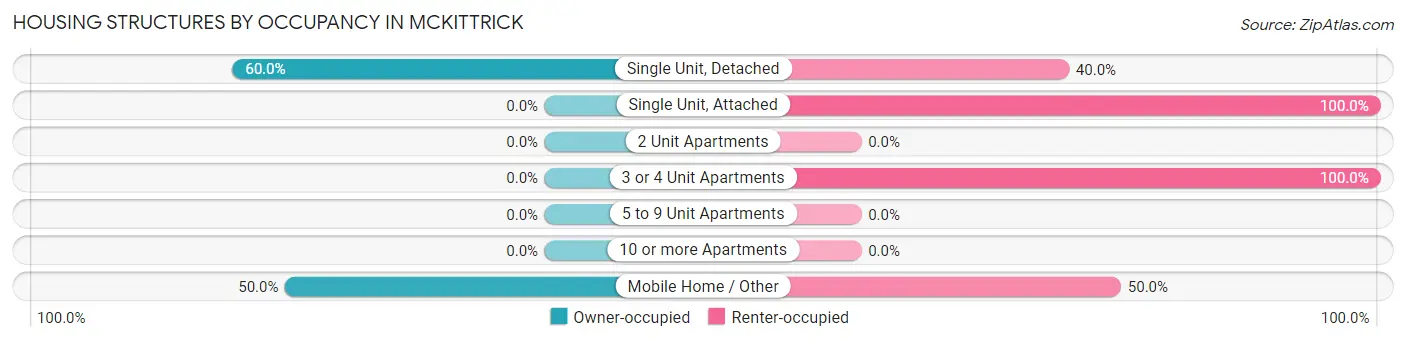
| Structure Type | Owner-occupied | Renter-occupied |
| Single Unit, Detached | 18 (60.0%) | 12 (40.0%) |
| Single Unit, Attached | 0 (0.0%) | 1 (100.0%) |
| 2 Unit Apartments | 0 (0.0%) | 0 (0.0%) |
| 3 or 4 Unit Apartments | 0 (0.0%) | 1 (100.0%) |
| 5 to 9 Unit Apartments | 0 (0.0%) | 0 (0.0%) |
| 10 or more Apartments | 0 (0.0%) | 0 (0.0%) |
| Mobile Home / Other | 2 (50.0%) | 2 (50.0%) |
| Total | 20 (55.6%) | 16 (44.4%) |
Housing Structures by Number of Rooms in McKittrick
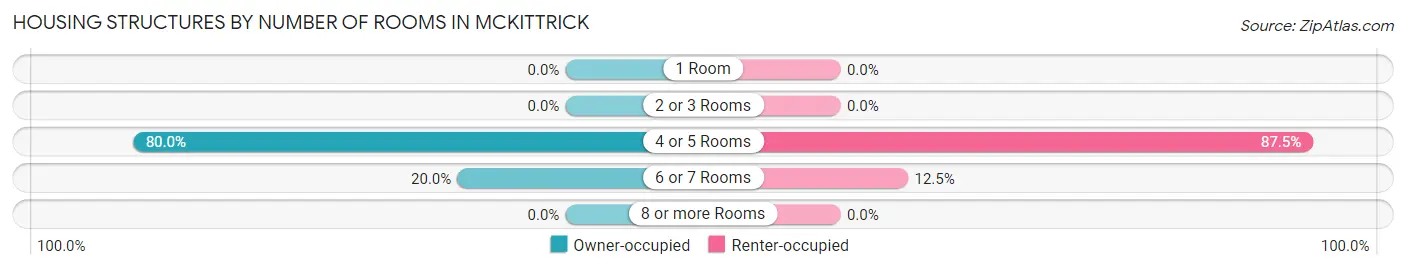
| Number of Rooms | Owner-occupied | Renter-occupied |
| 1 Room | 0 (0.0%) | 0 (0.0%) |
| 2 or 3 Rooms | 0 (0.0%) | 0 (0.0%) |
| 4 or 5 Rooms | 16 (80.0%) | 14 (87.5%) |
| 6 or 7 Rooms | 4 (20.0%) | 2 (12.5%) |
| 8 or more Rooms | 0 (0.0%) | 0 (0.0%) |
| Total | 20 (100.0%) | 16 (100.0%) |
Housing Structure by Heating Type in McKittrick

| Heating Type | Owner-occupied | Renter-occupied |
| Utility Gas | 13 (65.0%) | 14 (87.5%) |
| Bottled, Tank, or LP Gas | 0 (0.0%) | 2 (12.5%) |
| Electricity | 7 (35.0%) | 0 (0.0%) |
| Fuel Oil or Kerosene | 0 (0.0%) | 0 (0.0%) |
| Coal or Coke | 0 (0.0%) | 0 (0.0%) |
| All other Fuels | 0 (0.0%) | 0 (0.0%) |
| No Fuel Used | 0 (0.0%) | 0 (0.0%) |
| Total | 20 (100.0%) | 16 (100.0%) |
Household Vehicle Usage in McKittrick
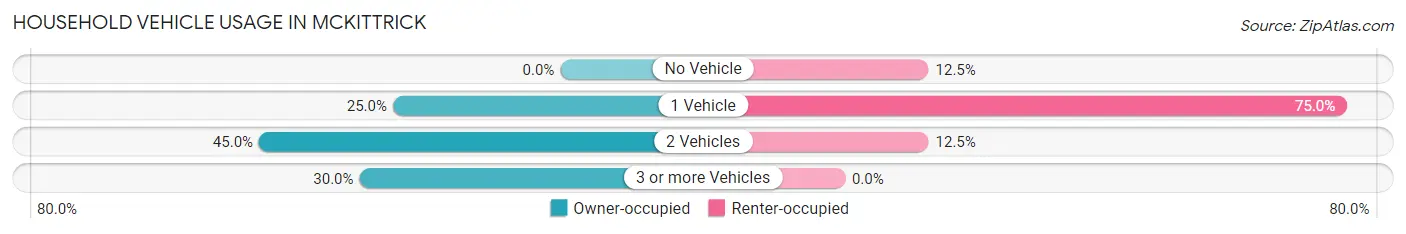
| Vehicles per Household | Owner-occupied | Renter-occupied |
| No Vehicle | 0 (0.0%) | 2 (12.5%) |
| 1 Vehicle | 5 (25.0%) | 12 (75.0%) |
| 2 Vehicles | 9 (45.0%) | 2 (12.5%) |
| 3 or more Vehicles | 6 (30.0%) | 0 (0.0%) |
| Total | 20 (100.0%) | 16 (100.0%) |
Real Estate & Mortgages in McKittrick
Real Estate and Mortgage Overview in McKittrick
| Characteristic | Without Mortgage | With Mortgage |
| Housing Units | 20 | 0 |
| Median Property Value | - | - |
| Median Household Income | - | - |
| Monthly Housing Costs | $321 | $0 |
| Real Estate Taxes | $500 | $0 |
Property Value by Mortgage Status in McKittrick
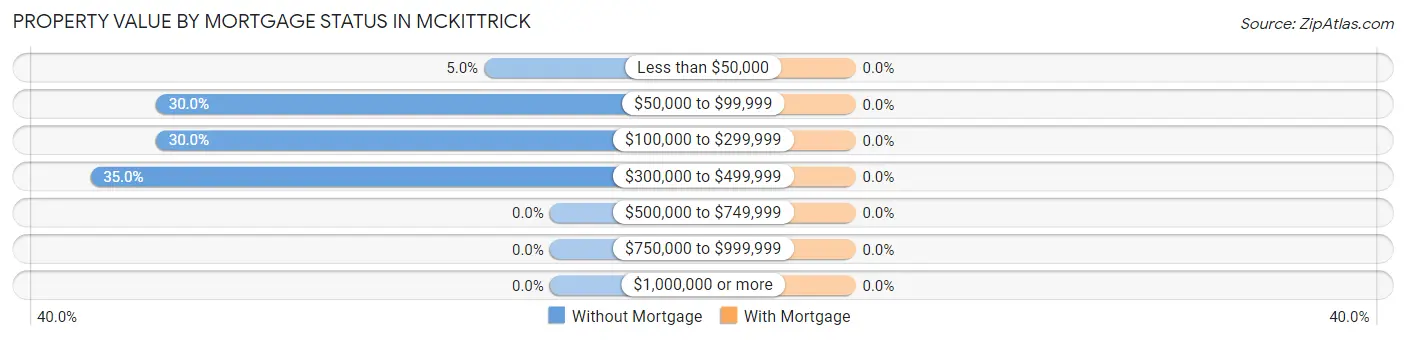
| Property Value | Without Mortgage | With Mortgage |
| Less than $50,000 | 1 (5.0%) | 0 (0.0%) |
| $50,000 to $99,999 | 6 (30.0%) | 0 (0.0%) |
| $100,000 to $299,999 | 6 (30.0%) | 0 (0.0%) |
| $300,000 to $499,999 | 7 (35.0%) | 0 (0.0%) |
| $500,000 to $749,999 | 0 (0.0%) | 0 (0.0%) |
| $750,000 to $999,999 | 0 (0.0%) | 0 (0.0%) |
| $1,000,000 or more | 0 (0.0%) | 0 (0.0%) |
| Total | 20 (100.0%) | 0 (0.0%) |
Household Income by Mortgage Status in McKittrick
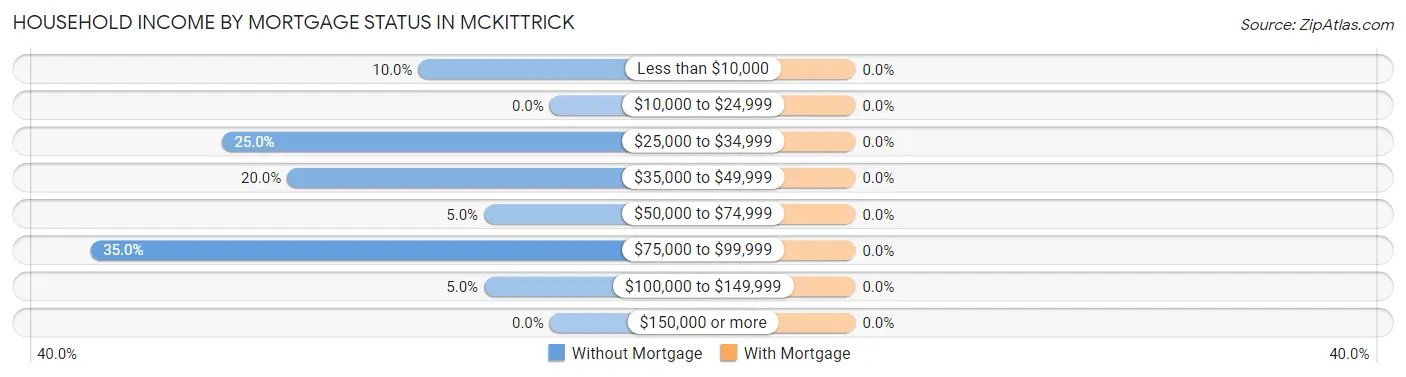
| Household Income | Without Mortgage | With Mortgage |
| Less than $10,000 | 2 (10.0%) | 0 (0.0%) |
| $10,000 to $24,999 | 0 (0.0%) | 0 (0.0%) |
| $25,000 to $34,999 | 5 (25.0%) | 0 (0.0%) |
| $35,000 to $49,999 | 4 (20.0%) | 0 (0.0%) |
| $50,000 to $74,999 | 1 (5.0%) | 0 (0.0%) |
| $75,000 to $99,999 | 7 (35.0%) | 0 (0.0%) |
| $100,000 to $149,999 | 1 (5.0%) | 0 (0.0%) |
| $150,000 or more | 0 (0.0%) | 0 (0.0%) |
| Total | 20 (100.0%) | 0 (0.0%) |
Property Value to Household Income Ratio in McKittrick
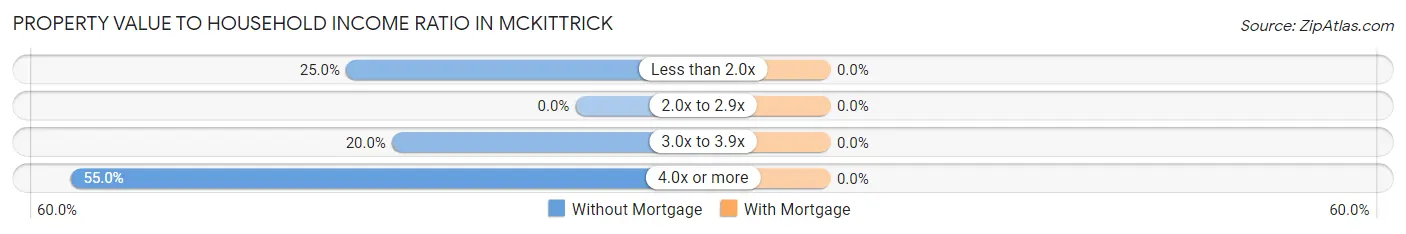
| Value-to-Income Ratio | Without Mortgage | With Mortgage |
| Less than 2.0x | 5 (25.0%) | 0 (0.0%) |
| 2.0x to 2.9x | 0 (0.0%) | 0 (0.0%) |
| 3.0x to 3.9x | 4 (20.0%) | 0 (0.0%) |
| 4.0x or more | 11 (55.0%) | 0 (0.0%) |
| Total | 20 (100.0%) | 0 (0.0%) |
Real Estate Taxes by Mortgage Status in McKittrick
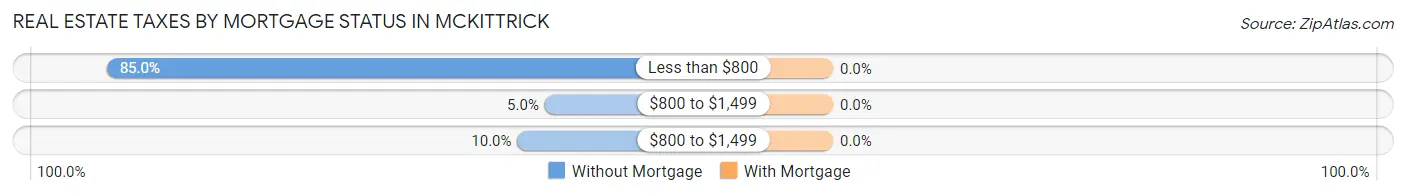
| Property Taxes | Without Mortgage | With Mortgage |
| Less than $800 | 17 (85.0%) | 0 (0.0%) |
| $800 to $1,499 | 1 (5.0%) | 0 (0.0%) |
| $800 to $1,499 | 2 (10.0%) | 0 (0.0%) |
| Total | 20 (100.0%) | 0 (0.0%) |
Health & Disability in McKittrick
Health Insurance Coverage by Age in McKittrick
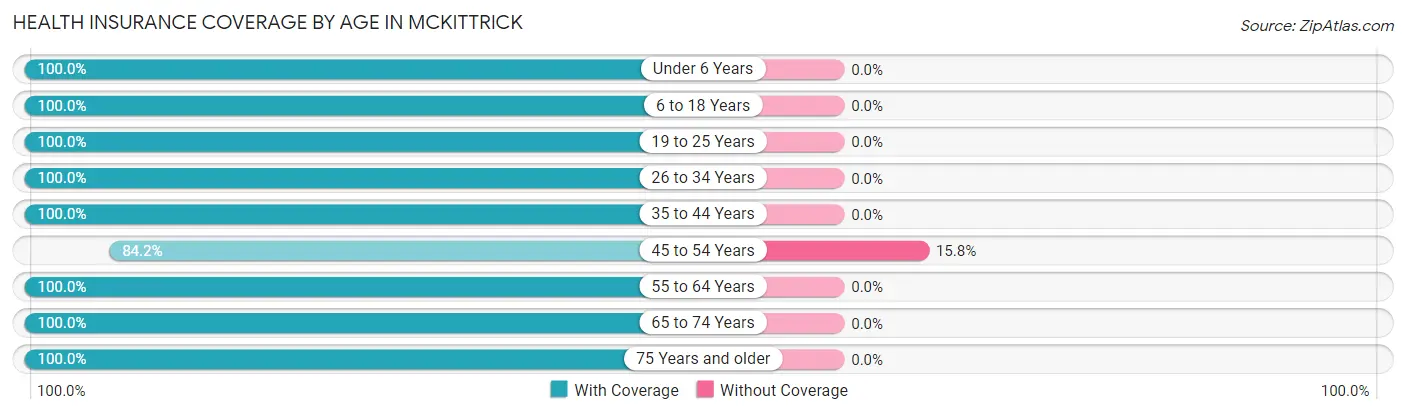
| Age Bracket | With Coverage | Without Coverage |
| Under 6 Years | 8 (100.0%) | 0 (0.0%) |
| 6 to 18 Years | 6 (100.0%) | 0 (0.0%) |
| 19 to 25 Years | 13 (100.0%) | 0 (0.0%) |
| 26 to 34 Years | 10 (100.0%) | 0 (0.0%) |
| 35 to 44 Years | 7 (100.0%) | 0 (0.0%) |
| 45 to 54 Years | 16 (84.2%) | 3 (15.8%) |
| 55 to 64 Years | 14 (100.0%) | 0 (0.0%) |
| 65 to 74 Years | 10 (100.0%) | 0 (0.0%) |
| 75 Years and older | 6 (100.0%) | 0 (0.0%) |
| Total | 90 (96.8%) | 3 (3.2%) |
Health Insurance Coverage by Citizenship Status in McKittrick
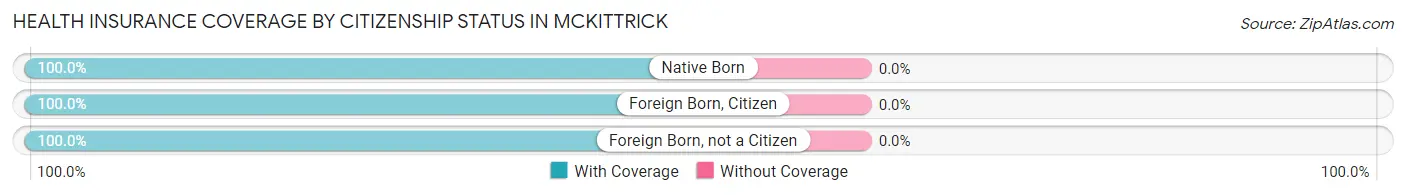
| Citizenship Status | With Coverage | Without Coverage |
| Native Born | 8 (100.0%) | 0 (0.0%) |
| Foreign Born, Citizen | 6 (100.0%) | 0 (0.0%) |
| Foreign Born, not a Citizen | 13 (100.0%) | 0 (0.0%) |
Health Insurance Coverage by Household Income in McKittrick
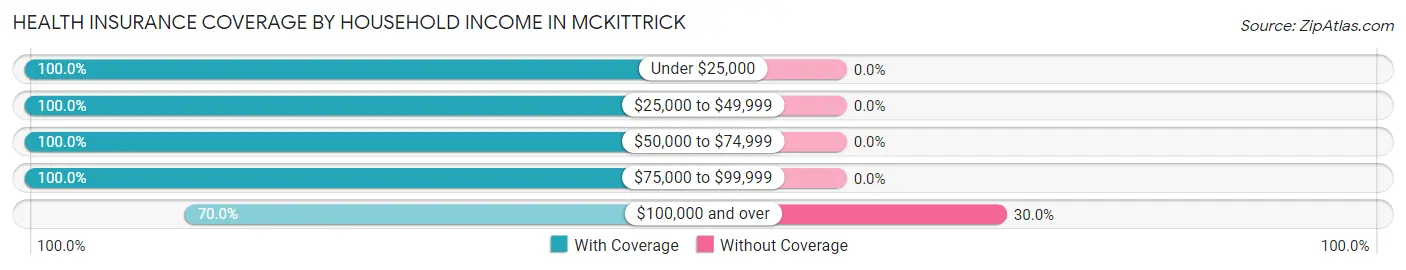
| Household Income | With Coverage | Without Coverage |
| Under $25,000 | 23 (100.0%) | 0 (0.0%) |
| $25,000 to $49,999 | 18 (100.0%) | 0 (0.0%) |
| $50,000 to $74,999 | 22 (100.0%) | 0 (0.0%) |
| $75,000 to $99,999 | 14 (100.0%) | 0 (0.0%) |
| $100,000 and over | 7 (70.0%) | 3 (30.0%) |
Public vs Private Health Insurance Coverage by Age in McKittrick
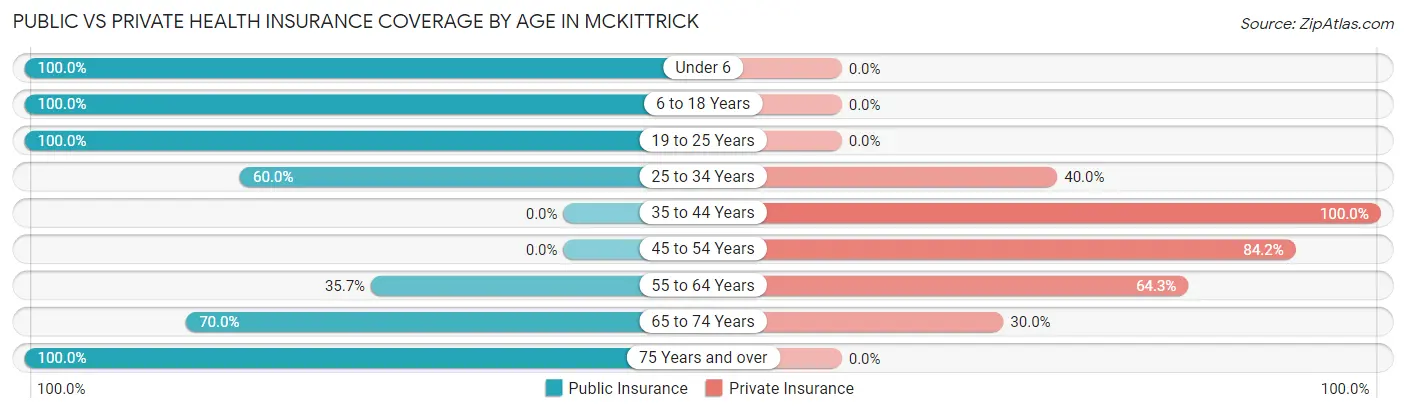
| Age Bracket | Public Insurance | Private Insurance |
| Under 6 | 8 (100.0%) | 0 (0.0%) |
| 6 to 18 Years | 6 (100.0%) | 0 (0.0%) |
| 19 to 25 Years | 13 (100.0%) | 0 (0.0%) |
| 25 to 34 Years | 6 (60.0%) | 4 (40.0%) |
| 35 to 44 Years | 0 (0.0%) | 7 (100.0%) |
| 45 to 54 Years | 0 (0.0%) | 16 (84.2%) |
| 55 to 64 Years | 5 (35.7%) | 9 (64.3%) |
| 65 to 74 Years | 7 (70.0%) | 3 (30.0%) |
| 75 Years and over | 6 (100.0%) | 0 (0.0%) |
| Total | 51 (54.8%) | 39 (41.9%) |
Disability Status by Sex by Age in McKittrick
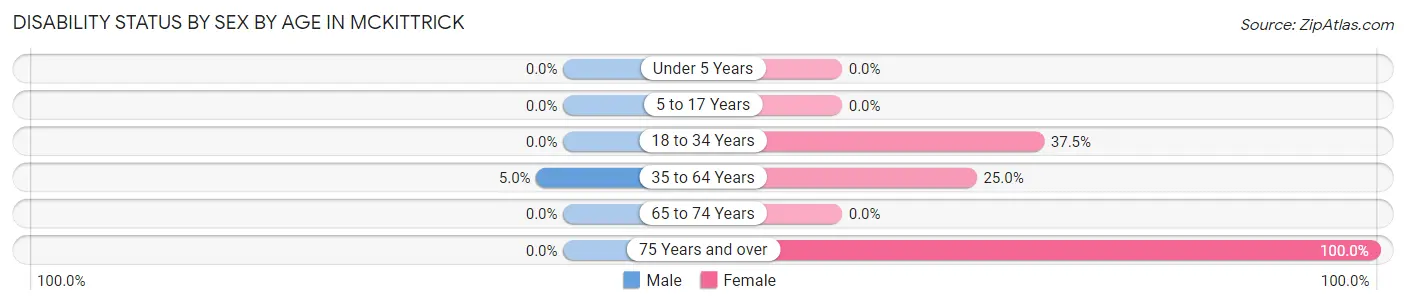
| Age Bracket | Male | Female |
| Under 5 Years | 0 (0.0%) | 0 (0.0%) |
| 5 to 17 Years | 0 (0.0%) | 0 (0.0%) |
| 18 to 34 Years | 0 (0.0%) | 6 (37.5%) |
| 35 to 64 Years | 1 (5.0%) | 5 (25.0%) |
| 65 to 74 Years | 0 (0.0%) | 0 (0.0%) |
| 75 Years and over | 0 (0.0%) | 3 (100.0%) |
Disability Class by Sex by Age in McKittrick
Disability Class: Hearing Difficulty
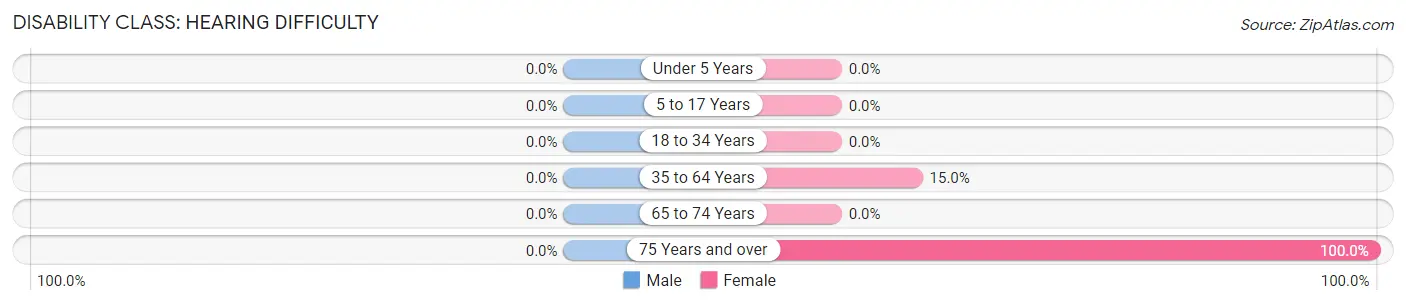
| Age Bracket | Male | Female |
| Under 5 Years | 0 (0.0%) | 0 (0.0%) |
| 5 to 17 Years | 0 (0.0%) | 0 (0.0%) |
| 18 to 34 Years | 0 (0.0%) | 0 (0.0%) |
| 35 to 64 Years | 0 (0.0%) | 3 (15.0%) |
| 65 to 74 Years | 0 (0.0%) | 0 (0.0%) |
| 75 Years and over | 0 (0.0%) | 3 (100.0%) |
Disability Class: Vision Difficulty
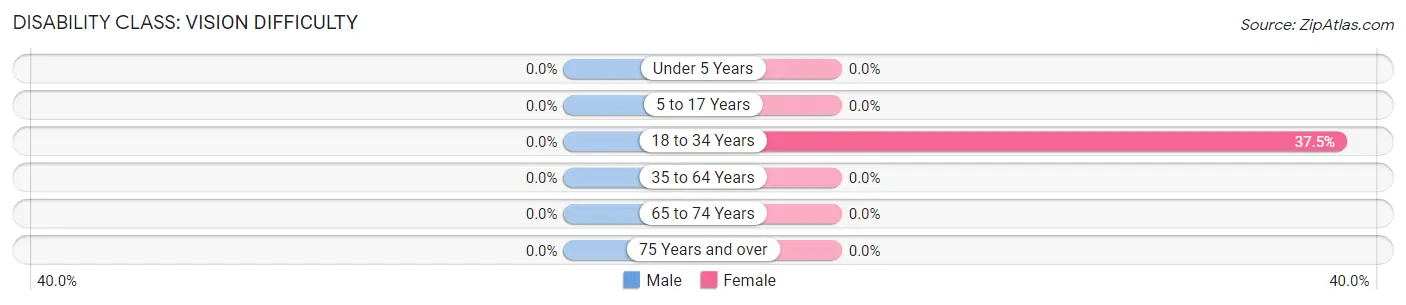
| Age Bracket | Male | Female |
| Under 5 Years | 0 (0.0%) | 0 (0.0%) |
| 5 to 17 Years | 0 (0.0%) | 0 (0.0%) |
| 18 to 34 Years | 0 (0.0%) | 6 (37.5%) |
| 35 to 64 Years | 0 (0.0%) | 0 (0.0%) |
| 65 to 74 Years | 0 (0.0%) | 0 (0.0%) |
| 75 Years and over | 0 (0.0%) | 0 (0.0%) |
Disability Class: Cognitive Difficulty
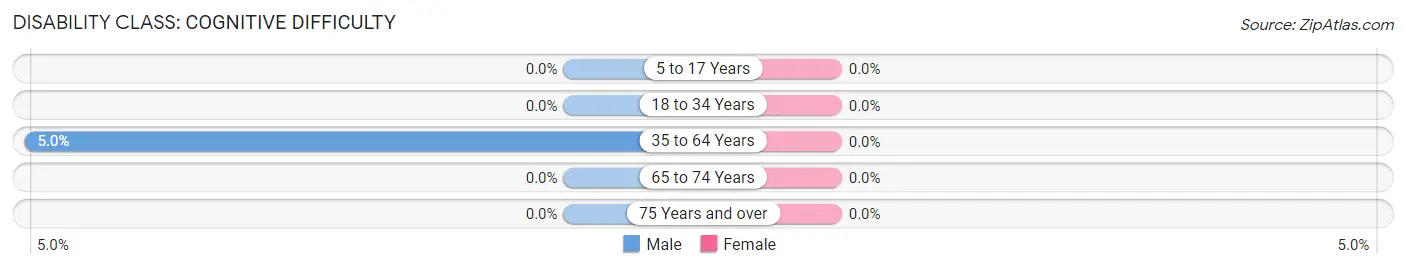
| Age Bracket | Male | Female |
| 5 to 17 Years | 0 (0.0%) | 0 (0.0%) |
| 18 to 34 Years | 0 (0.0%) | 0 (0.0%) |
| 35 to 64 Years | 1 (5.0%) | 0 (0.0%) |
| 65 to 74 Years | 0 (0.0%) | 0 (0.0%) |
| 75 Years and over | 0 (0.0%) | 0 (0.0%) |
Disability Class: Ambulatory Difficulty
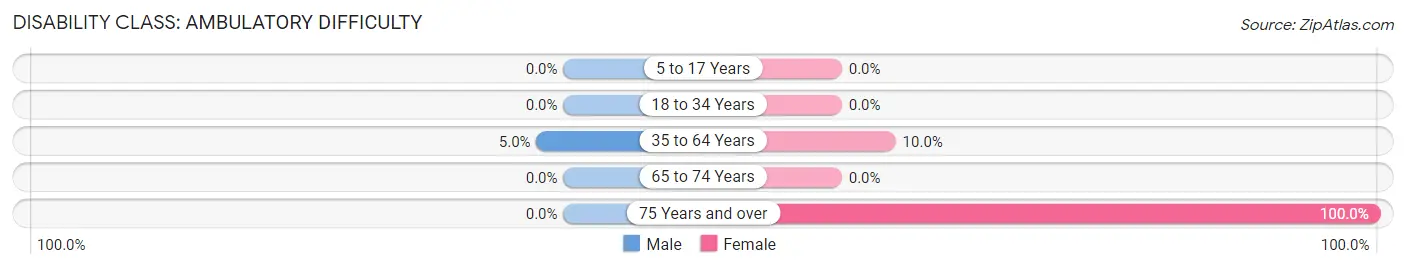
| Age Bracket | Male | Female |
| 5 to 17 Years | 0 (0.0%) | 0 (0.0%) |
| 18 to 34 Years | 0 (0.0%) | 0 (0.0%) |
| 35 to 64 Years | 1 (5.0%) | 2 (10.0%) |
| 65 to 74 Years | 0 (0.0%) | 0 (0.0%) |
| 75 Years and over | 0 (0.0%) | 3 (100.0%) |
Disability Class: Self-Care Difficulty
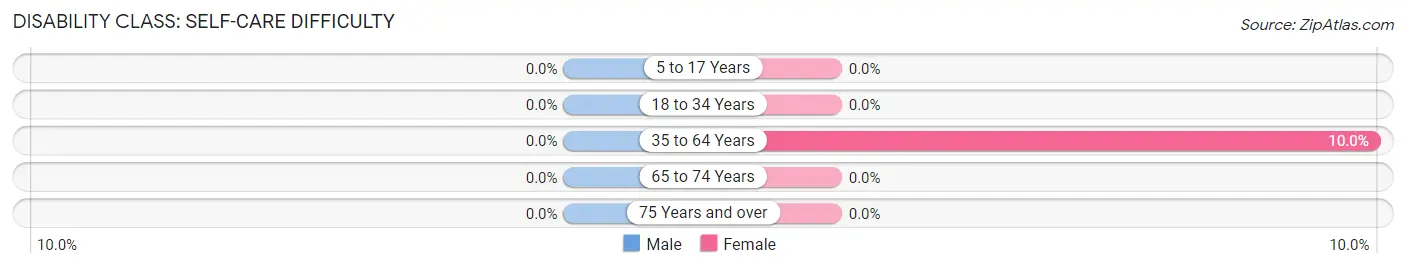
| Age Bracket | Male | Female |
| 5 to 17 Years | 0 (0.0%) | 0 (0.0%) |
| 18 to 34 Years | 0 (0.0%) | 0 (0.0%) |
| 35 to 64 Years | 0 (0.0%) | 2 (10.0%) |
| 65 to 74 Years | 0 (0.0%) | 0 (0.0%) |
| 75 Years and over | 0 (0.0%) | 0 (0.0%) |
Technology Access in McKittrick
Computing Device Access in McKittrick
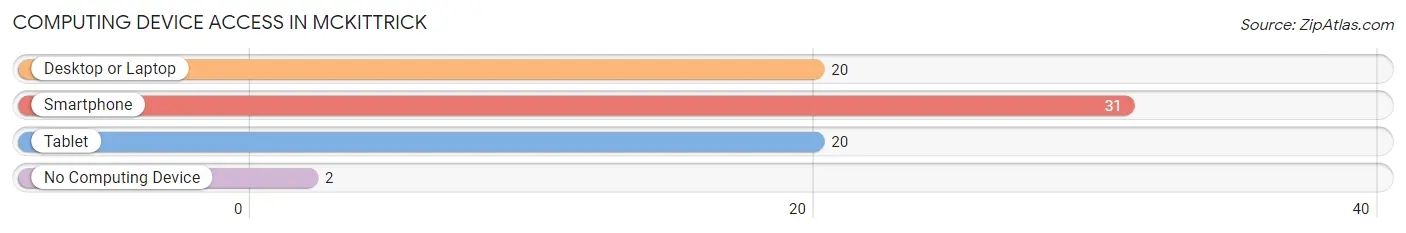
| Device Type | # Households | % Households |
| Desktop or Laptop | 20 | 55.6% |
| Smartphone | 31 | 86.1% |
| Tablet | 20 | 55.6% |
| No Computing Device | 2 | 5.6% |
| Total | 36 | 100.0% |
Internet Access in McKittrick
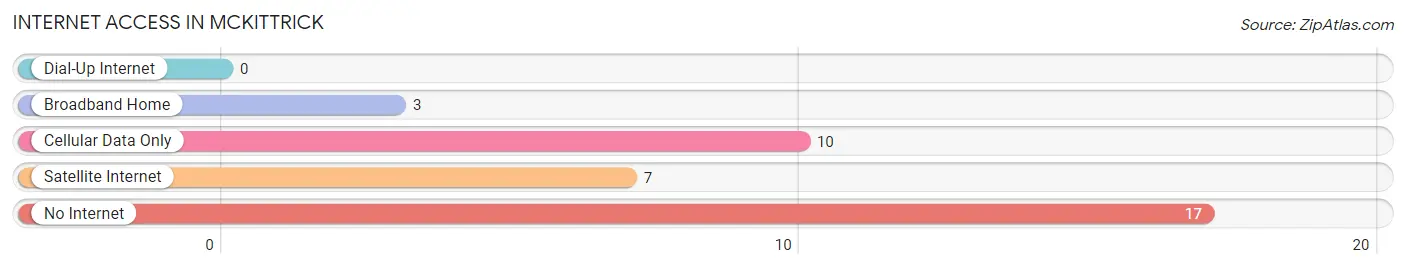
| Internet Type | # Households | % Households |
| Dial-Up Internet | 0 | 0.0% |
| Broadband Home | 3 | 8.3% |
| Cellular Data Only | 10 | 27.8% |
| Satellite Internet | 7 | 19.4% |
| No Internet | 17 | 47.2% |
| Total | 36 | 100.0% |
McKittrick Summary
Mckittrick is a small unincorporated community located in Kern County, California. It is situated in the San Joaquin Valley, approximately 30 miles west of Bakersfield. The population of Mckittrick was estimated to be around 200 in 2020.
History
Mckittrick was founded in 1876 by William Mckittrick, a rancher from Missouri. He purchased a large tract of land in the area and began to develop it for agricultural purposes. The town was named after him and was initially a small farming community. In the early 1900s, the town began to grow as more people moved to the area to take advantage of the fertile soil and mild climate.
The town was incorporated in 1912 and soon became a hub for the surrounding agricultural communities. It was home to several businesses, including a general store, a blacksmith shop, and a post office. The town also had a school, a church, and a hotel.
Geography
Mckittrick is located in the San Joaquin Valley, approximately 30 miles west of Bakersfield. The town is situated at an elevation of approximately 1,000 feet above sea level. The climate in the area is mild and dry, with temperatures ranging from the mid-50s to the mid-90s in the summer months.
The town is surrounded by agricultural land, with crops such as cotton, alfalfa, and wheat being grown in the area. The nearby Kern River provides irrigation for the farms.
Economy
The economy of Mckittrick is largely based on agriculture. The town is home to several farms and ranches, which produce a variety of crops, including cotton, alfalfa, and wheat. The town also has a few small businesses, including a general store, a post office, and a hotel.
Demographics
The population of Mckittrick was estimated to be around 200 in 2020. The town is predominantly white, with a small Hispanic population. The median household income in the town is approximately $45,000, and the median home value is around $150,000. The town has a low unemployment rate and a high rate of homeownership.
Common Questions
What is Per Capita Income in McKittrick?
Per Capita income in McKittrick is $19,891.
What is the Median Household income in McKittrick?
Median Household Income in McKittrick is $43,750.
What is Income or Wage Gap in McKittrick?
Income or Wage Gap in McKittrick is 89.5%.
Women in McKittrick earn 10.5 cents for every dollar earned by a man.
What is Inequality or Gini Index in McKittrick?
Inequality or Gini Index in McKittrick is 0.39.
What is the Total Population of McKittrick?
Total Population of McKittrick is 93.
What is the Total Male Population of McKittrick?
Total Male Population of McKittrick is 41.
What is the Total Female Population of McKittrick?
Total Female Population of McKittrick is 52.
What is the Ratio of Males per 100 Females in McKittrick?
There are 78.85 Males per 100 Females in McKittrick.
What is the Ratio of Females per 100 Males in McKittrick?
There are 126.83 Females per 100 Males in McKittrick.
What is the Median Population Age in McKittrick?
Median Population Age in McKittrick is 52.6 Years.
What is the Average Family Size in McKittrick
Average Family Size in McKittrick is 2.4 People.
What is the Average Household Size in McKittrick
Average Household Size in McKittrick is 2.4 People.
How Large is the Labor Force in McKittrick?
There are 46 People in the Labor Forcein in McKittrick.
What is the Percentage of People in the Labor Force in McKittrick?
58.2% of People are in the Labor Force in McKittrick.
What is the Unemployment Rate in McKittrick?
Unemployment Rate in McKittrick is 13.0%.