Cities with the Highest Percentage of Immigrants from Peru in California
RELATED REPORTS & OPTIONS
Peru
California
Compare Cities
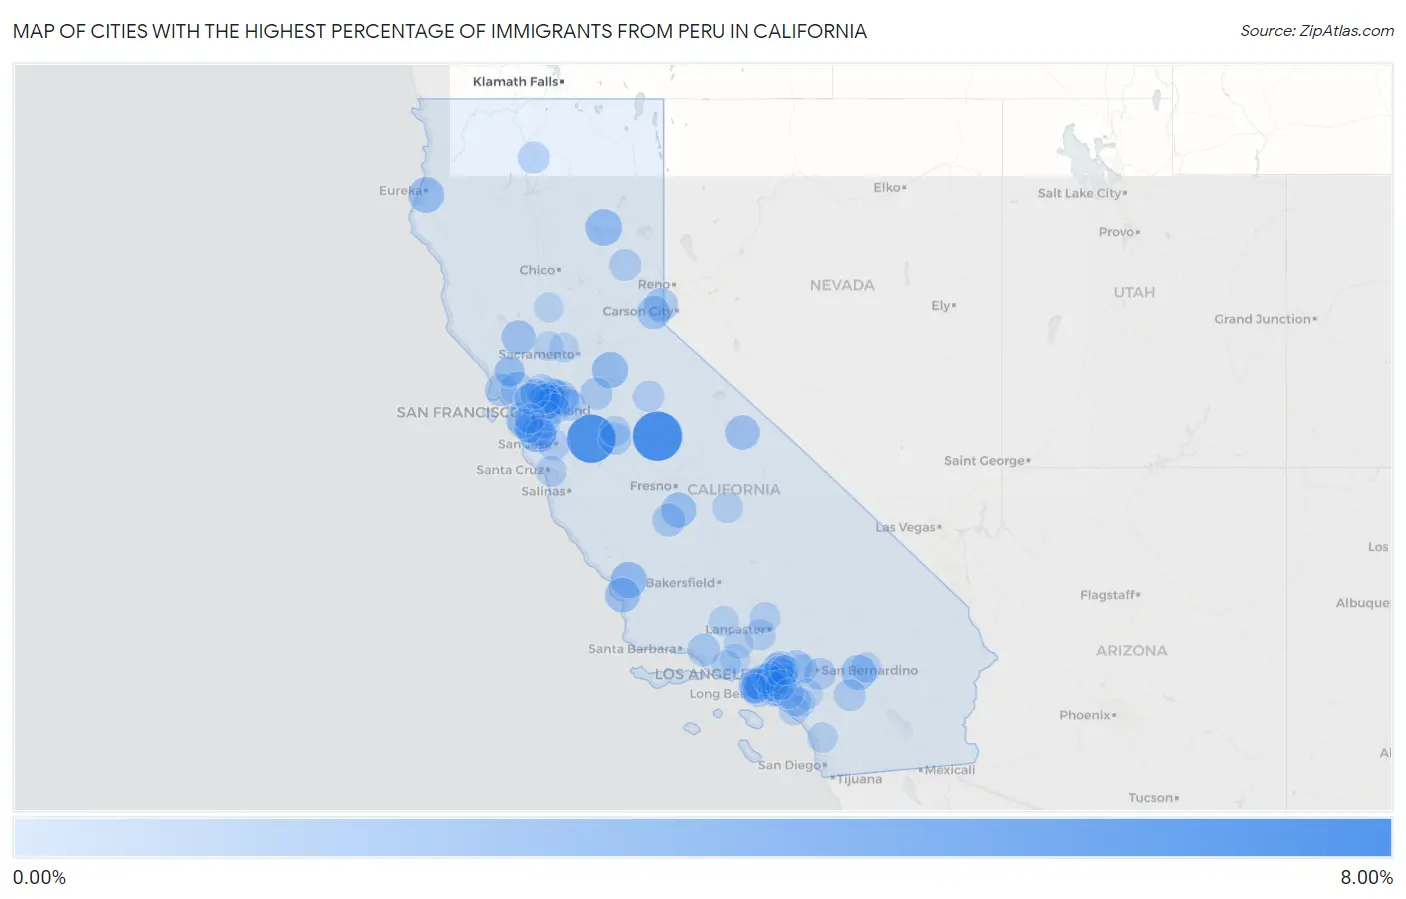
Map of Cities with the Highest Percentage of Immigrants from Peru in California
0.00%
8.00%
Cities with the Highest Percentage of Immigrants from Peru in California
| City | Peru | vs State | vs National | |
| 1. | Catheys Valley | 6.22% | 0.19%(+6.04)#-1 | 0.14%(+6.08)#0 |
| 2. | Diablo Grande | 5.89% | 0.19%(+5.70)#0 | 0.14%(+5.75)#1 |
| 3. | North Fair Oaks | 2.53% | 0.19%(+2.34)#66 | 0.14%(+2.39)#940 |
| 4. | Contra Costa Centre | 2.48% | 0.19%(+2.30)#67 | 0.14%(+2.34)#941 |
| 5. | Clear Creek | 2.28% | 0.19%(+2.09)#68 | 0.14%(+2.14)#942 |
| 6. | Ione | 2.20% | 0.19%(+2.01)#69 | 0.14%(+2.06)#943 |
| 7. | Garden Farms | 2.16% | 0.19%(+1.97)#70 | 0.14%(+2.02)#944 |
| 8. | Lawndale | 2.05% | 0.19%(+1.86)#71 | 0.14%(+1.91)#945 |
| 9. | Pine Hills | 2.02% | 0.19%(+1.84)#72 | 0.14%(+1.88)#946 |
| 10. | Morongo Valley | 1.89% | 0.19%(+1.70)#73 | 0.14%(+1.75)#947 |
| 11. | Hardwick | 1.87% | 0.19%(+1.69)#74 | 0.14%(+1.74)#948 |
| 12. | Avila Beach | 1.81% | 0.19%(+1.63)#75 | 0.14%(+1.67)#949 |
| 13. | East Whittier | 1.70% | 0.19%(+1.51)#76 | 0.14%(+1.56)#950 |
| 14. | Paradise | 1.64% | 0.19%(+1.45)#77 | 0.14%(+1.50)#951 |
| 15. | Hidden Valley Lake | 1.62% | 0.19%(+1.44)#78 | 0.14%(+1.48)#952 |
| 16. | Kings Beach | 1.47% | 0.19%(+1.28)#79 | 0.14%(+1.33)#953 |
| 17. | Sunnyside Tahoe City | 1.43% | 0.19%(+1.24)#80 | 0.14%(+1.29)#954 |
| 18. | Novato | 1.40% | 0.19%(+1.21)#81 | 0.14%(+1.26)#955 |
| 19. | Broadmoor | 1.38% | 0.19%(+1.19)#82 | 0.14%(+1.24)#956 |
| 20. | Antioch | 1.34% | 0.19%(+1.16)#83 | 0.14%(+1.20)#957 |
| 21. | Lemoore Station | 1.30% | 0.19%(+1.11)#84 | 0.14%(+1.16)#958 |
| 22. | Walnut Park | 1.24% | 0.19%(+1.05)#85 | 0.14%(+1.10)#959 |
| 23. | Alondra Park | 1.20% | 0.19%(+1.01)#86 | 0.14%(+1.06)#960 |
| 24. | Oak View | 1.16% | 0.19%(+0.971)#87 | 0.14%(+1.02)#961 |
| 25. | Inverness | 1.16% | 0.19%(+0.969)#88 | 0.14%(+1.02)#962 |
| 26. | Hilmar Irwin | 1.14% | 0.19%(+0.953)#89 | 0.14%(+1.00)#963 |
| 27. | Waterloo | 1.07% | 0.19%(+0.883)#90 | 0.14%(+0.932)#964 |
| 28. | San Antonio Heights | 1.03% | 0.19%(+0.844)#91 | 0.14%(+0.893)#965 |
| 29. | San Mateo | 0.98% | 0.19%(+0.790)#134 | 0.14%(+0.839)#1,319 |
| 30. | Bay Point | 0.96% | 0.19%(+0.771)#135 | 0.14%(+0.819)#1,320 |
| 31. | Lomita | 0.92% | 0.19%(+0.731)#136 | 0.14%(+0.780)#1,321 |
| 32. | Idyllwild Pine Cove | 0.92% | 0.19%(+0.729)#137 | 0.14%(+0.777)#1,322 |
| 33. | Benicia | 0.91% | 0.19%(+0.725)#138 | 0.14%(+0.774)#1,323 |
| 34. | Loma Linda | 0.91% | 0.19%(+0.724)#139 | 0.14%(+0.773)#1,324 |
| 35. | South Monrovia Island | 0.91% | 0.19%(+0.719)#140 | 0.14%(+0.768)#1,325 |
| 36. | Plumas Eureka | 0.90% | 0.19%(+0.713)#141 | 0.14%(+0.762)#1,326 |
| 37. | Pittsburg | 0.88% | 0.19%(+0.695)#142 | 0.14%(+0.744)#1,327 |
| 38. | Dunsmuir | 0.85% | 0.19%(+0.666)#143 | 0.14%(+0.715)#1,328 |
| 39. | San Pablo | 0.85% | 0.19%(+0.658)#144 | 0.14%(+0.707)#1,329 |
| 40. | El Sobrante Cdp Contra Costa County | 0.83% | 0.19%(+0.638)#145 | 0.14%(+0.687)#1,330 |
| 41. | Byron | 0.78% | 0.19%(+0.594)#146 | 0.14%(+0.643)#1,331 |
| 42. | Burbank | 0.76% | 0.19%(+0.576)#147 | 0.14%(+0.625)#1,332 |
| 43. | Soulsbyville | 0.76% | 0.19%(+0.573)#148 | 0.14%(+0.621)#1,333 |
| 44. | Leona Valley | 0.70% | 0.19%(+0.513)#149 | 0.14%(+0.562)#1,334 |
| 45. | Gardena | 0.66% | 0.19%(+0.476)#150 | 0.14%(+0.525)#1,335 |
| 46. | Hawthorne | 0.66% | 0.19%(+0.468)#151 | 0.14%(+0.517)#1,336 |
| 47. | West Covina | 0.64% | 0.19%(+0.455)#152 | 0.14%(+0.504)#1,337 |
| 48. | Pleasure Point | 0.64% | 0.19%(+0.455)#153 | 0.14%(+0.504)#1,338 |
| 49. | Three Rivers | 0.64% | 0.19%(+0.453)#154 | 0.14%(+0.502)#1,339 |
| 50. | Rosamond | 0.64% | 0.19%(+0.451)#155 | 0.14%(+0.500)#1,340 |
| 51. | Vincent | 0.61% | 0.19%(+0.421)#156 | 0.14%(+0.470)#1,341 |
| 52. | Martinez | 0.61% | 0.19%(+0.418)#157 | 0.14%(+0.467)#1,342 |
| 53. | Redwood City | 0.59% | 0.19%(+0.407)#158 | 0.14%(+0.455)#1,343 |
| 54. | Turlock | 0.58% | 0.19%(+0.397)#159 | 0.14%(+0.445)#1,344 |
| 55. | Los Alamitos | 0.58% | 0.19%(+0.392)#160 | 0.14%(+0.440)#1,345 |
| 56. | Cotati | 0.57% | 0.19%(+0.382)#161 | 0.14%(+0.431)#1,346 |
| 57. | Hayward | 0.57% | 0.19%(+0.378)#185 | 0.14%(+0.427)#1,554 |
| 58. | Downey | 0.56% | 0.19%(+0.376)#186 | 0.14%(+0.425)#1,555 |
| 59. | Duarte | 0.55% | 0.19%(+0.365)#187 | 0.14%(+0.414)#1,556 |
| 60. | Temescal Valley | 0.55% | 0.19%(+0.365)#188 | 0.14%(+0.413)#1,557 |
| 61. | South Whittier | 0.54% | 0.19%(+0.354)#189 | 0.14%(+0.403)#1,558 |
| 62. | Lake San Marcos | 0.54% | 0.19%(+0.351)#190 | 0.14%(+0.400)#1,559 |
| 63. | Stanton | 0.53% | 0.19%(+0.345)#191 | 0.14%(+0.394)#1,560 |
| 64. | Frazier Park | 0.51% | 0.19%(+0.327)#192 | 0.14%(+0.376)#1,561 |
| 65. | Buena Park | 0.51% | 0.19%(+0.322)#201 | 0.14%(+0.371)#1,603 |
| 66. | Hillsborough | 0.51% | 0.19%(+0.318)#202 | 0.14%(+0.367)#1,604 |
| 67. | Clayton | 0.51% | 0.19%(+0.318)#203 | 0.14%(+0.367)#1,605 |
| 68. | Concord | 0.50% | 0.19%(+0.317)#204 | 0.14%(+0.365)#1,606 |
| 69. | Rowland Heights | 0.50% | 0.19%(+0.308)#205 | 0.14%(+0.356)#1,607 |
| 70. | Yucca Valley | 0.49% | 0.19%(+0.300)#206 | 0.14%(+0.349)#1,608 |
| 71. | Walnut Creek | 0.48% | 0.19%(+0.296)#207 | 0.14%(+0.345)#1,609 |
| 72. | Montebello | 0.48% | 0.19%(+0.294)#208 | 0.14%(+0.342)#1,610 |
| 73. | Brentwood | 0.47% | 0.19%(+0.285)#209 | 0.14%(+0.334)#1,611 |
| 74. | Laguna Niguel | 0.47% | 0.19%(+0.282)#210 | 0.14%(+0.331)#1,612 |
| 75. | Bell | 0.47% | 0.19%(+0.279)#211 | 0.14%(+0.328)#1,613 |
| 76. | Rancho Cucamonga | 0.46% | 0.19%(+0.276)#212 | 0.14%(+0.325)#1,614 |
| 77. | Rancho Santa Margarita | 0.46% | 0.19%(+0.275)#213 | 0.14%(+0.324)#1,615 |
| 78. | Richmond | 0.46% | 0.19%(+0.273)#214 | 0.14%(+0.322)#1,616 |
| 79. | Blackhawk | 0.45% | 0.19%(+0.264)#215 | 0.14%(+0.313)#1,617 |
| 80. | Artesia | 0.45% | 0.19%(+0.261)#216 | 0.14%(+0.310)#1,618 |
| 81. | Torrance | 0.45% | 0.19%(+0.261)#217 | 0.14%(+0.310)#1,619 |
| 82. | Baldwin Park | 0.45% | 0.19%(+0.260)#218 | 0.14%(+0.308)#1,620 |
| 83. | Spring Valley Cdp San Diego County | 0.45% | 0.19%(+0.258)#219 | 0.14%(+0.307)#1,621 |
| 84. | Castro Valley | 0.44% | 0.19%(+0.257)#220 | 0.14%(+0.305)#1,622 |
| 85. | Lake Forest | 0.44% | 0.19%(+0.250)#221 | 0.14%(+0.299)#1,623 |
| 86. | Fullerton | 0.43% | 0.19%(+0.246)#222 | 0.14%(+0.294)#1,624 |
| 87. | Pacifica | 0.42% | 0.19%(+0.232)#223 | 0.14%(+0.281)#1,625 |
| 88. | North Tustin | 0.42% | 0.19%(+0.230)#224 | 0.14%(+0.278)#1,626 |
| 89. | Charter Oak | 0.42% | 0.19%(+0.230)#225 | 0.14%(+0.278)#1,627 |
| 90. | Menlo Park | 0.41% | 0.19%(+0.220)#226 | 0.14%(+0.269)#1,628 |
| 91. | Colusa | 0.41% | 0.19%(+0.219)#227 | 0.14%(+0.268)#1,629 |
| 92. | Simi Valley | 0.41% | 0.19%(+0.219)#228 | 0.14%(+0.268)#1,630 |
| 93. | Hasley Canyon | 0.40% | 0.19%(+0.216)#229 | 0.14%(+0.265)#1,631 |
| 94. | Thousand Oaks | 0.40% | 0.19%(+0.213)#230 | 0.14%(+0.262)#1,632 |
| 95. | Woodland | 0.40% | 0.19%(+0.209)#231 | 0.14%(+0.258)#1,633 |
| 96. | Pleasant Hill | 0.39% | 0.19%(+0.203)#232 | 0.14%(+0.252)#1,634 |
| 97. | Rohnert Park | 0.39% | 0.19%(+0.201)#233 | 0.14%(+0.250)#1,635 |
| 98. | Esparto | 0.39% | 0.19%(+0.201)#234 | 0.14%(+0.250)#1,636 |
| 99. | Rodeo | 0.39% | 0.19%(+0.198)#235 | 0.14%(+0.246)#1,637 |
| 100. | Brisbane | 0.38% | 0.19%(+0.190)#236 | 0.14%(+0.239)#1,638 |
Common Questions
What are the Top 10 Cities with the Highest Percentage of Immigrants from Peru in California?
Top 10 Cities with the Highest Percentage of Immigrants from Peru in California are:
#1
6.22%
#2
5.89%
#3
2.53%
#4
2.48%
#5
2.28%
#6
2.20%
#7
2.16%
#8
2.05%
#9
2.02%
#10
1.89%
What city has the Highest Percentage of Immigrants from Peru in California?
Catheys Valley has the Highest Percentage of Immigrants from Peru in California with 6.22%.
What is the Percentage of Immigrants from Peru in the State of California?
Percentage of Immigrants from Peru in California is 0.19%.
What is the Percentage of Immigrants from Peru in the United States?
Percentage of Immigrants from Peru in the United States is 0.14%.