Cities with the Most Immigrants from Southern Europe in California
RELATED REPORTS & OPTIONS
Southern Europe
California
Compare Cities
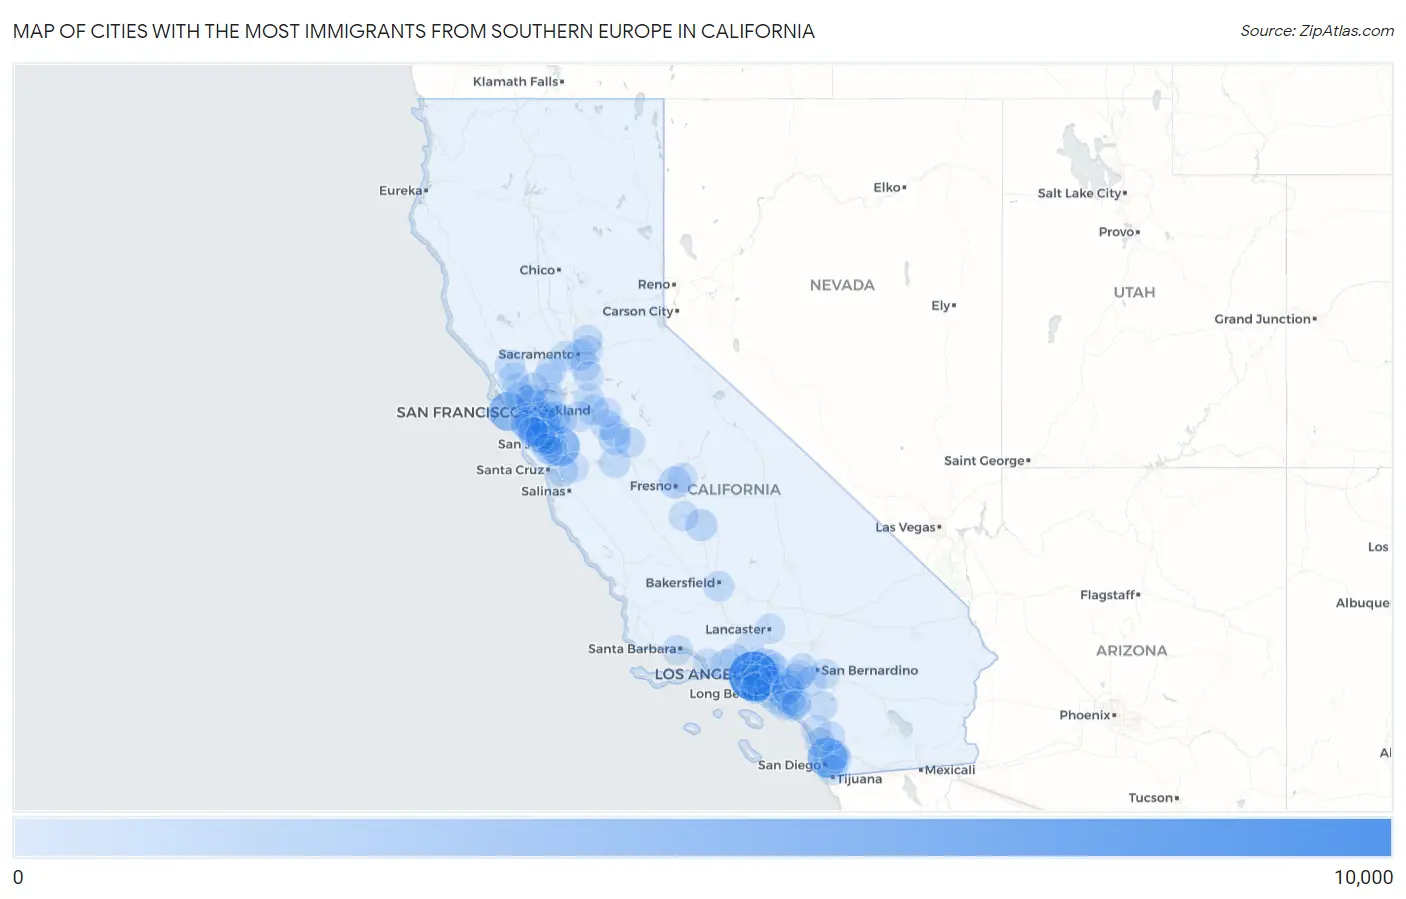
Map of Cities with the Most Immigrants from Southern Europe in California
0
10,000
Cities with the Most Immigrants from Southern Europe in California
| City | Southern Europe | vs State | vs National | |
| 1. | Los Angeles | 8,136 | 85,197(9.55%)#1 | 728,588(1.12%)#3 |
| 2. | San Diego | 4,049 | 85,197(4.75%)#2 | 728,588(0.56%)#9 |
| 3. | San Jose | 3,980 | 85,197(4.67%)#3 | 728,588(0.55%)#10 |
| 4. | San Francisco | 3,891 | 85,197(4.57%)#4 | 728,588(0.53%)#11 |
| 5. | Santa Clara | 1,055 | 85,197(1.24%)#5 | 728,588(0.14%)#55 |
| 6. | Fresno | 1,029 | 85,197(1.21%)#6 | 728,588(0.14%)#61 |
| 7. | Tulare | 940 | 85,197(1.10%)#7 | 728,588(0.13%)#71 |
| 8. | Hilmar Irwin | 887 | 85,197(1.04%)#8 | 728,588(0.12%)#73 |
| 9. | Oakland | 844 | 85,197(0.99%)#9 | 728,588(0.12%)#78 |
| 10. | Watsonville | 672 | 85,197(0.79%)#10 | 728,588(0.09%)#106 |
| 11. | Glendale | 663 | 85,197(0.78%)#11 | 728,588(0.09%)#108 |
| 12. | Mountain View | 658 | 85,197(0.77%)#12 | 728,588(0.09%)#110 |
| 13. | Berkeley | 649 | 85,197(0.76%)#13 | 728,588(0.09%)#113 |
| 14. | Sacramento | 638 | 85,197(0.75%)#14 | 728,588(0.09%)#116 |
| 15. | Thousand Oaks | 627 | 85,197(0.74%)#15 | 728,588(0.09%)#120 |
| 16. | San Mateo | 584 | 85,197(0.69%)#16 | 728,588(0.08%)#133 |
| 17. | Irvine | 581 | 85,197(0.68%)#17 | 728,588(0.08%)#135 |
| 18. | Fremont | 581 | 85,197(0.68%)#18 | 728,588(0.08%)#136 |
| 19. | Turlock | 543 | 85,197(0.64%)#19 | 728,588(0.07%)#143 |
| 20. | Palo Alto | 538 | 85,197(0.63%)#20 | 728,588(0.07%)#146 |
| 21. | Sunnyvale | 537 | 85,197(0.63%)#21 | 728,588(0.07%)#148 |
| 22. | Modesto | 528 | 85,197(0.62%)#22 | 728,588(0.07%)#155 |
| 23. | Bakersfield | 511 | 85,197(0.60%)#23 | 728,588(0.07%)#163 |
| 24. | Redwood City | 504 | 85,197(0.59%)#24 | 728,588(0.07%)#165 |
| 25. | Los Banos | 477 | 85,197(0.56%)#25 | 728,588(0.07%)#174 |
| 26. | Long Beach | 471 | 85,197(0.55%)#26 | 728,588(0.06%)#177 |
| 27. | Manteca | 471 | 85,197(0.55%)#27 | 728,588(0.06%)#178 |
| 28. | Novato | 469 | 85,197(0.55%)#28 | 728,588(0.06%)#181 |
| 29. | Castro Valley | 465 | 85,197(0.55%)#29 | 728,588(0.06%)#185 |
| 30. | Huntington Beach | 444 | 85,197(0.52%)#30 | 728,588(0.06%)#199 |
| 31. | Pasadena | 438 | 85,197(0.51%)#31 | 728,588(0.06%)#204 |
| 32. | Rancho Cucamonga | 432 | 85,197(0.51%)#32 | 728,588(0.06%)#207 |
| 33. | Santa Rosa | 419 | 85,197(0.49%)#33 | 728,588(0.06%)#212 |
| 34. | San Leandro | 417 | 85,197(0.49%)#34 | 728,588(0.06%)#215 |
| 35. | San Rafael | 412 | 85,197(0.48%)#35 | 728,588(0.06%)#216 |
| 36. | Artesia | 412 | 85,197(0.48%)#36 | 728,588(0.06%)#218 |
| 37. | Stockton | 407 | 85,197(0.48%)#37 | 728,588(0.06%)#222 |
| 38. | West Hollywood | 384 | 85,197(0.45%)#38 | 728,588(0.05%)#241 |
| 39. | El Cajon | 383 | 85,197(0.45%)#39 | 728,588(0.05%)#242 |
| 40. | Anaheim | 381 | 85,197(0.45%)#40 | 728,588(0.05%)#243 |
| 41. | Santa Monica | 370 | 85,197(0.43%)#41 | 728,588(0.05%)#257 |
| 42. | Riverside | 369 | 85,197(0.43%)#42 | 728,588(0.05%)#258 |
| 43. | South San Francisco | 348 | 85,197(0.41%)#43 | 728,588(0.05%)#271 |
| 44. | Atwater | 343 | 85,197(0.40%)#44 | 728,588(0.05%)#276 |
| 45. | Chula Vista | 342 | 85,197(0.40%)#45 | 728,588(0.05%)#279 |
| 46. | San Bruno | 338 | 85,197(0.40%)#46 | 728,588(0.05%)#286 |
| 47. | Pleasanton | 334 | 85,197(0.39%)#47 | 728,588(0.05%)#290 |
| 48. | Menlo Park | 329 | 85,197(0.39%)#48 | 728,588(0.05%)#294 |
| 49. | Roseville | 327 | 85,197(0.38%)#49 | 728,588(0.04%)#296 |
| 50. | Oceanside | 322 | 85,197(0.38%)#50 | 728,588(0.04%)#301 |
| 51. | Fairfield | 311 | 85,197(0.37%)#51 | 728,588(0.04%)#313 |
| 52. | Los Gatos | 298 | 85,197(0.35%)#52 | 728,588(0.04%)#326 |
| 53. | Davis | 295 | 85,197(0.35%)#53 | 728,588(0.04%)#332 |
| 54. | Tracy | 291 | 85,197(0.34%)#54 | 728,588(0.04%)#340 |
| 55. | Santa Barbara | 291 | 85,197(0.34%)#55 | 728,588(0.04%)#341 |
| 56. | Whittier | 281 | 85,197(0.33%)#56 | 728,588(0.04%)#360 |
| 57. | Downey | 280 | 85,197(0.33%)#57 | 728,588(0.04%)#361 |
| 58. | Santa Clarita | 278 | 85,197(0.33%)#58 | 728,588(0.04%)#363 |
| 59. | Lake Forest | 274 | 85,197(0.32%)#59 | 728,588(0.04%)#370 |
| 60. | Elk Grove | 269 | 85,197(0.32%)#60 | 728,588(0.04%)#381 |
| 61. | Vacaville | 267 | 85,197(0.31%)#61 | 728,588(0.04%)#386 |
| 62. | Concord | 264 | 85,197(0.31%)#62 | 728,588(0.04%)#388 |
| 63. | Millbrae | 259 | 85,197(0.30%)#63 | 728,588(0.04%)#397 |
| 64. | Simi Valley | 258 | 85,197(0.30%)#64 | 728,588(0.04%)#400 |
| 65. | Murrieta | 257 | 85,197(0.30%)#65 | 728,588(0.04%)#402 |
| 66. | Redondo Beach | 249 | 85,197(0.29%)#66 | 728,588(0.03%)#412 |
| 67. | Dublin | 248 | 85,197(0.29%)#67 | 728,588(0.03%)#414 |
| 68. | Oxnard | 246 | 85,197(0.29%)#68 | 728,588(0.03%)#423 |
| 69. | Yorba Linda | 243 | 85,197(0.29%)#69 | 728,588(0.03%)#433 |
| 70. | Hayward | 233 | 85,197(0.27%)#70 | 728,588(0.03%)#455 |
| 71. | Orange | 233 | 85,197(0.27%)#71 | 728,588(0.03%)#456 |
| 72. | Hanford | 232 | 85,197(0.27%)#72 | 728,588(0.03%)#461 |
| 73. | Petaluma | 230 | 85,197(0.27%)#73 | 728,588(0.03%)#468 |
| 74. | Carmichael | 226 | 85,197(0.27%)#74 | 728,588(0.03%)#474 |
| 75. | Vallejo | 225 | 85,197(0.26%)#75 | 728,588(0.03%)#478 |
| 76. | Santee | 225 | 85,197(0.26%)#76 | 728,588(0.03%)#480 |
| 77. | Torrance | 224 | 85,197(0.26%)#77 | 728,588(0.03%)#481 |
| 78. | Livermore | 221 | 85,197(0.26%)#78 | 728,588(0.03%)#487 |
| 79. | Newport Beach | 218 | 85,197(0.26%)#79 | 728,588(0.03%)#493 |
| 80. | Stanford | 218 | 85,197(0.26%)#80 | 728,588(0.03%)#494 |
| 81. | Lancaster | 214 | 85,197(0.25%)#81 | 728,588(0.03%)#504 |
| 82. | Escondido | 208 | 85,197(0.24%)#82 | 728,588(0.03%)#518 |
| 83. | Saratoga | 208 | 85,197(0.24%)#83 | 728,588(0.03%)#520 |
| 84. | Richmond | 207 | 85,197(0.24%)#84 | 728,588(0.03%)#521 |
| 85. | Redlands | 206 | 85,197(0.24%)#85 | 728,588(0.03%)#523 |
| 86. | Arcadia | 206 | 85,197(0.24%)#86 | 728,588(0.03%)#524 |
| 87. | Encinitas | 204 | 85,197(0.24%)#87 | 728,588(0.03%)#531 |
| 88. | Escalon | 202 | 85,197(0.24%)#88 | 728,588(0.03%)#537 |
| 89. | Chino | 198 | 85,197(0.23%)#89 | 728,588(0.03%)#549 |
| 90. | Belmont | 195 | 85,197(0.23%)#90 | 728,588(0.03%)#562 |
| 91. | Gilroy | 194 | 85,197(0.23%)#91 | 728,588(0.03%)#563 |
| 92. | San Carlos | 188 | 85,197(0.22%)#92 | 728,588(0.03%)#581 |
| 93. | Walnut Creek | 185 | 85,197(0.22%)#93 | 728,588(0.03%)#589 |
| 94. | Aliso Viejo | 184 | 85,197(0.22%)#94 | 728,588(0.03%)#591 |
| 95. | Mission Viejo | 183 | 85,197(0.21%)#95 | 728,588(0.03%)#594 |
| 96. | Clovis | 180 | 85,197(0.21%)#96 | 728,588(0.02%)#600 |
| 97. | Galt | 180 | 85,197(0.21%)#97 | 728,588(0.02%)#601 |
| 98. | Ontario | 177 | 85,197(0.21%)#98 | 728,588(0.02%)#609 |
| 99. | Franklin Cdp Merced County | 171 | 85,197(0.20%)#99 | 728,588(0.02%)#636 |
| 100. | Inglewood | 168 | 85,197(0.20%)#100 | 728,588(0.02%)#645 |
Common Questions
What are the Top 10 Cities with the Most Immigrants from Southern Europe in California?
Top 10 Cities with the Most Immigrants from Southern Europe in California are:
#1
8,136
#2
4,049
#3
3,980
#4
3,891
#5
1,055
#6
1,029
#7
940
#8
887
#9
844
#10
672
What city has the Most Immigrants from Southern Europe in California?
Los Angeles has the Most Immigrants from Southern Europe in California with 8,136.
What is the Total Immigrants from Southern Europe in the State of California?
Total Immigrants from Southern Europe in California is 85,197.
What is the Total Immigrants from Southern Europe in the United States?
Total Immigrants from Southern Europe in the United States is 728,588.