Cities with the Highest Percentage of Immigrants from Burma / Myanmar in California
RELATED REPORTS & OPTIONS
Burma / Myanmar
California
Compare Cities
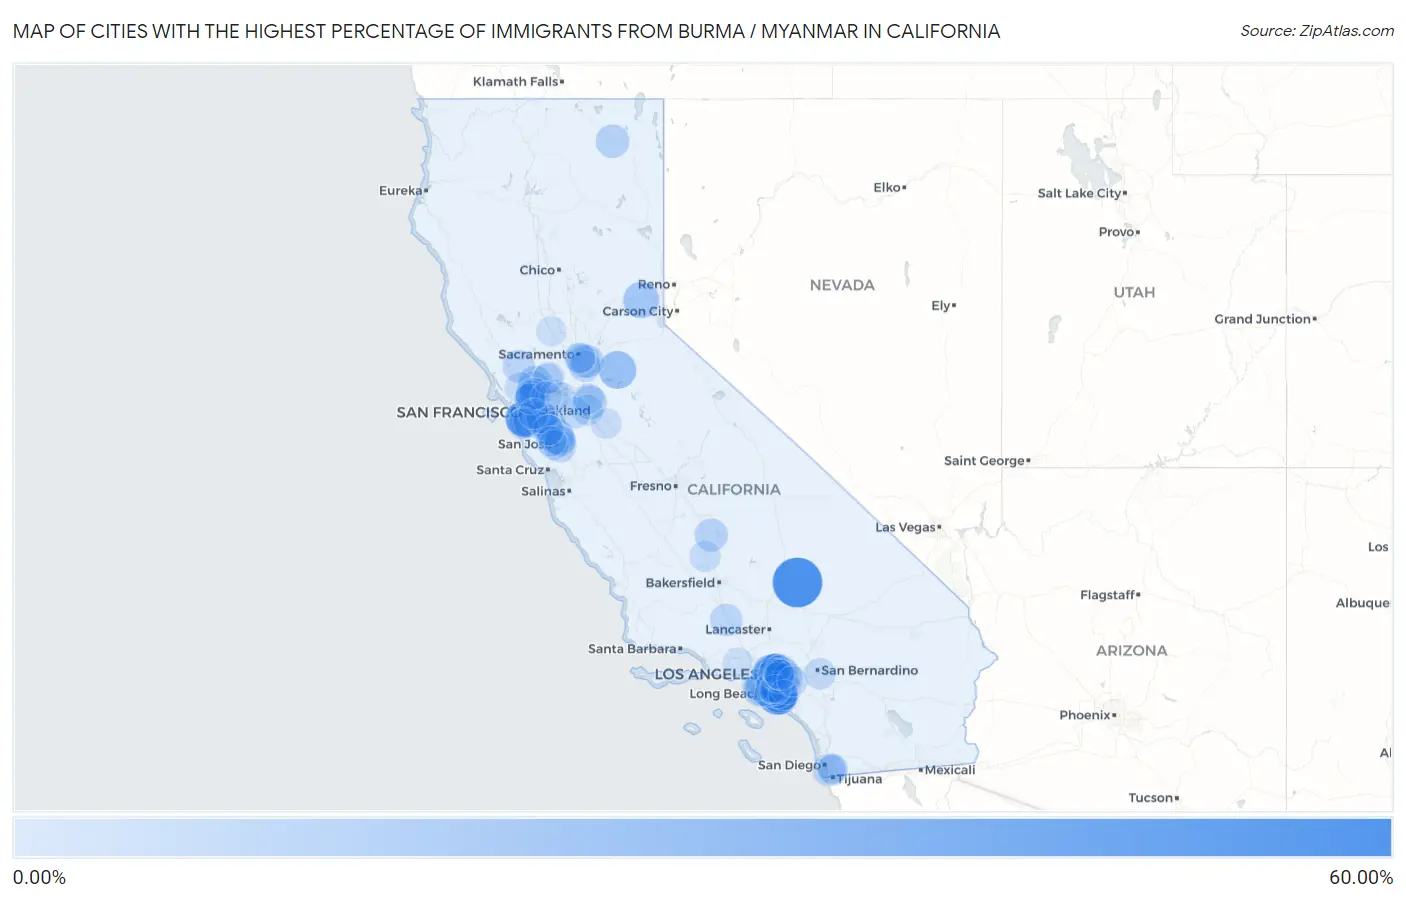
Map of Cities with the Highest Percentage of Immigrants from Burma / Myanmar in California
0.00%
4.00%
Cities with the Highest Percentage of Immigrants from Burma / Myanmar in California
| City | Burma / Myanmar | vs State | vs National | |
| 1. | Green Valley Cdp Solano County | 3.53% | 0.072%(+3.46)#202 | 0.047%(+3.48)#789 |
| 2. | Mayflower Village | 2.25% | 0.072%(+2.17)#203 | 0.047%(+2.20)#790 |
| 3. | Daly City | 2.05% | 0.072%(+1.98)#204 | 0.047%(+2.00)#791 |
| 4. | La Habra Heights | 1.80% | 0.072%(+1.73)#235 | 0.047%(+1.76)#954 |
| 5. | Rosemead | 1.68% | 0.072%(+1.61)#236 | 0.047%(+1.63)#955 |
| 6. | North El Monte | 1.46% | 0.072%(+1.38)#237 | 0.047%(+1.41)#956 |
| 7. | South San Gabriel | 1.30% | 0.072%(+1.23)#238 | 0.047%(+1.25)#957 |
| 8. | San Gabriel | 0.98% | 0.072%(+0.913)#239 | 0.047%(+0.937)#958 |
| 9. | Monterey Park | 0.94% | 0.072%(+0.866)#240 | 0.047%(+0.890)#959 |
| 10. | Brisbane | 0.93% | 0.072%(+0.854)#241 | 0.047%(+0.878)#960 |
| 11. | North Fair Oaks | 0.85% | 0.072%(+0.781)#350 | 0.047%(+0.805)#1,575 |
| 12. | Baywood Park | 0.83% | 0.072%(+0.758)#351 | 0.047%(+0.782)#1,576 |
| 13. | Fremont | 0.81% | 0.072%(+0.736)#352 | 0.047%(+0.760)#1,577 |
| 14. | Arcadia | 0.76% | 0.072%(+0.685)#353 | 0.047%(+0.709)#1,578 |
| 15. | South San Francisco | 0.69% | 0.072%(+0.622)#354 | 0.047%(+0.646)#1,579 |
| 16. | Diamond Bar | 0.66% | 0.072%(+0.589)#355 | 0.047%(+0.613)#1,580 |
| 17. | Millbrae | 0.64% | 0.072%(+0.572)#356 | 0.047%(+0.597)#1,581 |
| 18. | Union City | 0.64% | 0.072%(+0.567)#357 | 0.047%(+0.591)#1,582 |
| 19. | Pine Hills | 0.63% | 0.072%(+0.556)#440 | 0.047%(+0.580)#2,110 |
| 20. | Alhambra | 0.61% | 0.072%(+0.541)#441 | 0.047%(+0.565)#2,111 |
| 21. | Parkway | 0.60% | 0.072%(+0.526)#442 | 0.047%(+0.550)#2,112 |
| 22. | East San Gabriel | 0.60% | 0.072%(+0.524)#443 | 0.047%(+0.549)#2,113 |
| 23. | Baldwin Park | 0.58% | 0.072%(+0.513)#444 | 0.047%(+0.537)#2,114 |
| 24. | Colma | 0.58% | 0.072%(+0.510)#445 | 0.047%(+0.534)#2,115 |
| 25. | Mariposa | 0.57% | 0.072%(+0.494)#717 | 0.047%(+0.519)#5,632 |
| 26. | Lawndale | 0.55% | 0.072%(+0.474)#718 | 0.047%(+0.498)#5,633 |
| 27. | Lathrop | 0.53% | 0.072%(+0.455)#719 | 0.047%(+0.479)#5,634 |
| 28. | Rowland Heights | 0.52% | 0.072%(+0.452)#720 | 0.047%(+0.476)#5,635 |
| 29. | Culver City | 0.51% | 0.072%(+0.436)#721 | 0.047%(+0.461)#5,636 |
| 30. | West Covina | 0.50% | 0.072%(+0.432)#722 | 0.047%(+0.456)#5,637 |
| 31. | Temple City | 0.48% | 0.072%(+0.404)#723 | 0.047%(+0.428)#5,638 |
| 32. | Charter Oak | 0.46% | 0.072%(+0.389)#724 | 0.047%(+0.413)#5,639 |
| 33. | Broadmoor | 0.45% | 0.072%(+0.381)#725 | 0.047%(+0.405)#5,640 |
| 34. | San Marino | 0.45% | 0.072%(+0.378)#726 | 0.047%(+0.403)#5,641 |
| 35. | Covina | 0.44% | 0.072%(+0.366)#727 | 0.047%(+0.390)#5,642 |
| 36. | Pacifica | 0.42% | 0.072%(+0.349)#728 | 0.047%(+0.373)#5,643 |
| 37. | Avocado Heights | 0.39% | 0.072%(+0.322)#729 | 0.047%(+0.346)#5,644 |
| 38. | Torrance | 0.39% | 0.072%(+0.322)#730 | 0.047%(+0.346)#5,645 |
| 39. | Bradbury | 0.39% | 0.072%(+0.320)#731 | 0.047%(+0.344)#5,646 |
| 40. | Live Oak | 0.38% | 0.072%(+0.308)#732 | 0.047%(+0.332)#5,647 |
| 41. | San Francisco | 0.36% | 0.072%(+0.284)#733 | 0.047%(+0.309)#5,648 |
| 42. | Los Altos Hills | 0.36% | 0.072%(+0.284)#734 | 0.047%(+0.308)#5,649 |
| 43. | Del Aire | 0.34% | 0.072%(+0.272)#735 | 0.047%(+0.297)#5,650 |
| 44. | Milpitas | 0.34% | 0.072%(+0.265)#736 | 0.047%(+0.289)#5,651 |
| 45. | Burlingame | 0.33% | 0.072%(+0.254)#737 | 0.047%(+0.278)#5,652 |
| 46. | Larkfield Wikiup | 0.31% | 0.072%(+0.241)#795 | 0.047%(+0.265)#6,976 |
| 47. | Burbank | 0.31% | 0.072%(+0.234)#796 | 0.047%(+0.258)#6,977 |
| 48. | El Monte | 0.30% | 0.072%(+0.227)#797 | 0.047%(+0.252)#6,978 |
| 49. | Clayton | 0.30% | 0.072%(+0.227)#798 | 0.047%(+0.251)#6,979 |
| 50. | Oak Hills | 0.29% | 0.072%(+0.222)#799 | 0.047%(+0.246)#6,980 |
| 51. | University Of California-Santa Barbara | 0.29% | 0.072%(+0.217)#800 | 0.047%(+0.241)#6,981 |
| 52. | San Mateo | 0.29% | 0.072%(+0.214)#801 | 0.047%(+0.238)#6,982 |
| 53. | Oak Park | 0.28% | 0.072%(+0.207)#802 | 0.047%(+0.231)#6,983 |
| 54. | Montebello | 0.26% | 0.072%(+0.193)#803 | 0.047%(+0.217)#6,984 |
| 55. | Walnut | 0.26% | 0.072%(+0.191)#804 | 0.047%(+0.215)#6,985 |
| 56. | Crockett | 0.25% | 0.072%(+0.180)#805 | 0.047%(+0.204)#6,986 |
| 57. | Rosedale | 0.24% | 0.072%(+0.168)#806 | 0.047%(+0.192)#6,987 |
| 58. | South Lake Tahoe | 0.23% | 0.072%(+0.163)#807 | 0.047%(+0.187)#6,988 |
| 59. | Upland | 0.23% | 0.072%(+0.162)#808 | 0.047%(+0.186)#6,989 |
| 60. | Hercules | 0.23% | 0.072%(+0.155)#809 | 0.047%(+0.179)#6,990 |
| 61. | South El Monte | 0.21% | 0.072%(+0.137)#810 | 0.047%(+0.161)#6,991 |
| 62. | Hillsborough | 0.20% | 0.072%(+0.133)#811 | 0.047%(+0.157)#6,992 |
| 63. | Hayward | 0.20% | 0.072%(+0.133)#812 | 0.047%(+0.157)#6,993 |
| 64. | Vincent | 0.20% | 0.072%(+0.125)#813 | 0.047%(+0.149)#6,994 |
| 65. | Hacienda Heights | 0.19% | 0.072%(+0.118)#814 | 0.047%(+0.142)#6,995 |
| 66. | Duarte | 0.18% | 0.072%(+0.113)#815 | 0.047%(+0.137)#6,996 |
| 67. | Palos Verdes Estates | 0.18% | 0.072%(+0.110)#816 | 0.047%(+0.134)#6,997 |
| 68. | San Leandro | 0.18% | 0.072%(+0.107)#817 | 0.047%(+0.131)#6,998 |
| 69. | Alamo | 0.17% | 0.072%(+0.103)#818 | 0.047%(+0.127)#6,999 |
| 70. | San Bruno | 0.17% | 0.072%(+0.097)#819 | 0.047%(+0.121)#7,000 |
| 71. | Atherton | 0.17% | 0.072%(+0.097)#820 | 0.047%(+0.121)#7,001 |
| 72. | Chino Hills | 0.17% | 0.072%(+0.095)#821 | 0.047%(+0.119)#7,002 |
| 73. | Campbell | 0.16% | 0.072%(+0.087)#822 | 0.047%(+0.111)#7,003 |
| 74. | Riverbank | 0.15% | 0.072%(+0.082)#823 | 0.047%(+0.106)#7,004 |
| 75. | Valinda | 0.15% | 0.072%(+0.079)#824 | 0.047%(+0.103)#7,005 |
| 76. | Castro Valley | 0.15% | 0.072%(+0.078)#825 | 0.047%(+0.102)#7,006 |
| 77. | Simi Valley | 0.15% | 0.072%(+0.077)#826 | 0.047%(+0.102)#7,007 |
| 78. | Yountville | 0.15% | 0.072%(+0.076)#827 | 0.047%(+0.100)#7,008 |
| 79. | Tustin | 0.15% | 0.072%(+0.076)#828 | 0.047%(+0.100)#7,009 |
| 80. | Goleta | 0.13% | 0.072%(+0.063)#829 | 0.047%(+0.087)#7,010 |
| 81. | Country Club | 0.13% | 0.072%(+0.063)#830 | 0.047%(+0.087)#7,011 |
| 82. | Cupertino | 0.13% | 0.072%(+0.062)#831 | 0.047%(+0.086)#7,012 |
| 83. | West Carson | 0.13% | 0.072%(+0.059)#832 | 0.047%(+0.083)#7,013 |
| 84. | Newark | 0.13% | 0.072%(+0.057)#833 | 0.047%(+0.081)#7,014 |
| 85. | Foothill Farms | 0.12% | 0.072%(+0.051)#834 | 0.047%(+0.075)#7,015 |
| 86. | Rolling Hills Estates | 0.12% | 0.072%(+0.050)#835 | 0.047%(+0.074)#7,016 |
| 87. | Benton Park | 0.12% | 0.072%(+0.048)#836 | 0.047%(+0.073)#7,017 |
| 88. | Chowchilla | 0.12% | 0.072%(+0.046)#837 | 0.047%(+0.070)#7,018 |
| 89. | San Carlos | 0.11% | 0.072%(+0.043)#838 | 0.047%(+0.067)#7,019 |
| 90. | Livermore | 0.11% | 0.072%(+0.043)#839 | 0.047%(+0.067)#7,020 |
| 91. | Santa Clara | 0.11% | 0.072%(+0.042)#840 | 0.047%(+0.066)#7,021 |
| 92. | San Ramon | 0.11% | 0.072%(+0.040)#841 | 0.047%(+0.064)#7,022 |
| 93. | Highlands | 0.11% | 0.072%(+0.038)#842 | 0.047%(+0.062)#7,023 |
| 94. | Oroville | 0.10% | 0.072%(+0.032)#843 | 0.047%(+0.056)#7,024 |
| 95. | Signal Hill | 0.10% | 0.072%(+0.031)#844 | 0.047%(+0.055)#7,025 |
| 96. | Sunnyvale | 0.10% | 0.072%(+0.029)#845 | 0.047%(+0.054)#7,026 |
| 97. | El Segundo | 0.100% | 0.072%(+0.028)#846 | 0.047%(+0.052)#7,027 |
| 98. | Placentia | 0.098% | 0.072%(+0.027)#847 | 0.047%(+0.051)#7,028 |
| 99. | La Canada Flintridge | 0.098% | 0.072%(+0.027)#848 | 0.047%(+0.051)#7,029 |
| 100. | Redondo Beach | 0.098% | 0.072%(+0.026)#849 | 0.047%(+0.050)#7,030 |
Common Questions
What are the Top 10 Cities with the Highest Percentage of Immigrants from Burma / Myanmar in California?
Top 10 Cities with the Highest Percentage of Immigrants from Burma / Myanmar in California are:
#1
2.25%
#2
2.05%
#3
1.80%
#4
1.68%
#5
1.46%
#6
1.30%
#7
0.98%
#8
0.94%
#9
0.93%
#10
0.85%
What city has the Highest Percentage of Immigrants from Burma / Myanmar in California?
Mayflower Village has the Highest Percentage of Immigrants from Burma / Myanmar in California with 2.25%.
What is the Percentage of Immigrants from Burma / Myanmar in the State of California?
Percentage of Immigrants from Burma / Myanmar in California is 0.072%.
What is the Percentage of Immigrants from Burma / Myanmar in the United States?
Percentage of Immigrants from Burma / Myanmar in the United States is 0.047%.