Edgewood, CA Map & Demographics
Edgewood Map
Edgewood Overview
$27,348
PER CAPITA INCOME
$93,125
AVG FAMILY INCOME
$93,125
AVG HOUSEHOLD INCOME
0.11
INEQUALITY / GINI INDEX
46
TOTAL POPULATION
14
MALE POPULATION
32
FEMALE POPULATION
43.75
MALES / 100 FEMALES
228.57
FEMALES / 100 MALES
50.0
MEDIAN AGE
2.9
AVG FAMILY SIZE
2.9
AVG HOUSEHOLD SIZE
18
LABOR FORCE [ PEOPLE ]
60.0%
PERCENT IN LABOR FORCE
Edgewood Area Codes
Income in Edgewood
Income Overview in Edgewood
Per Capita Income in Edgewood is $27,348, while median incomes of families and households are $93,125 and $93,125 respectively.
| Characteristic | Number | Measure |
| Per Capita Income | 46 | $27,348 |
| Median Family Income | 16 | $93,125 |
| Mean Family Income | 16 | $85,419 |
| Median Household Income | 16 | $93,125 |
| Mean Household Income | 16 | $85,419 |
| Income Deficit | 16 | $0 |
| Wage / Income Gap (%) | 46 | 0.00% |
| Wage / Income Gap ($) | 46 | 100.00¢ per $1 |
| Gini / Inequality Index | 46 | 0.11 |
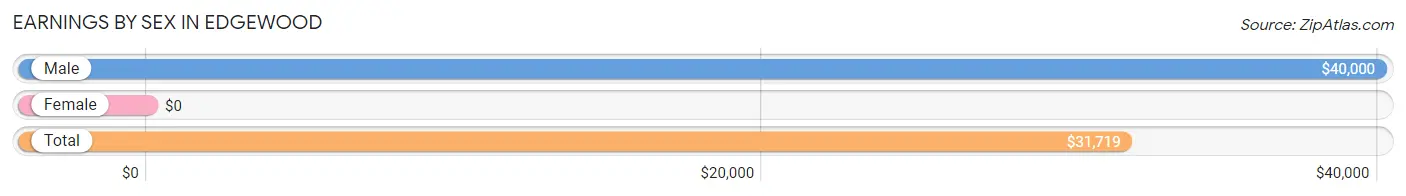
Earnings by Sex in Edgewood
| Sex | Number | Average Earnings |
| Male | 14 (51.8%) | $40,000 |
| Female | 13 (48.1%) | $0 |
| Total | 27 (100.0%) | $31,719 |
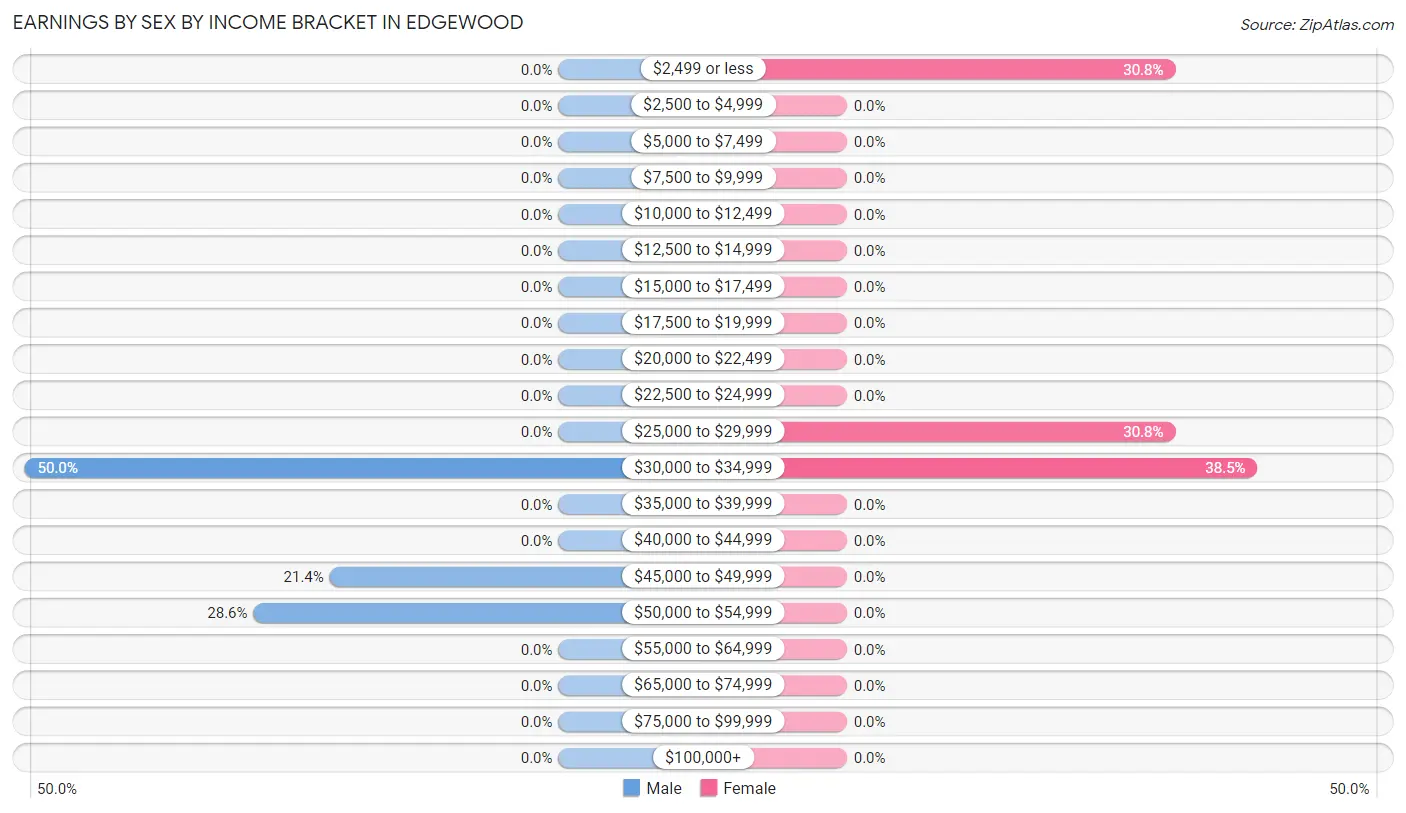
Earnings by Sex by Income Bracket in Edgewood
The most common earnings brackets in Edgewood are $30,000 to $34,999 for men (7 | 50.0%) and $30,000 to $34,999 for women (5 | 38.5%).
| Income | Male | Female |
| $2,499 or less | 0 (0.0%) | 4 (30.8%) |
| $2,500 to $4,999 | 0 (0.0%) | 0 (0.0%) |
| $5,000 to $7,499 | 0 (0.0%) | 0 (0.0%) |
| $7,500 to $9,999 | 0 (0.0%) | 0 (0.0%) |
| $10,000 to $12,499 | 0 (0.0%) | 0 (0.0%) |
| $12,500 to $14,999 | 0 (0.0%) | 0 (0.0%) |
| $15,000 to $17,499 | 0 (0.0%) | 0 (0.0%) |
| $17,500 to $19,999 | 0 (0.0%) | 0 (0.0%) |
| $20,000 to $22,499 | 0 (0.0%) | 0 (0.0%) |
| $22,500 to $24,999 | 0 (0.0%) | 0 (0.0%) |
| $25,000 to $29,999 | 0 (0.0%) | 4 (30.8%) |
| $30,000 to $34,999 | 7 (50.0%) | 5 (38.5%) |
| $35,000 to $39,999 | 0 (0.0%) | 0 (0.0%) |
| $40,000 to $44,999 | 0 (0.0%) | 0 (0.0%) |
| $45,000 to $49,999 | 3 (21.4%) | 0 (0.0%) |
| $50,000 to $54,999 | 4 (28.6%) | 0 (0.0%) |
| $55,000 to $64,999 | 0 (0.0%) | 0 (0.0%) |
| $65,000 to $74,999 | 0 (0.0%) | 0 (0.0%) |
| $75,000 to $99,999 | 0 (0.0%) | 0 (0.0%) |
| $100,000+ | 0 (0.0%) | 0 (0.0%) |
| Total | 14 (100.0%) | 13 (100.0%) |
Earnings by Sex by Educational Attainment in Edgewood
| Educational Attainment | Male Income | Female Income |
| Less than High School | - | - |
| High School Diploma | - | - |
| College or Associate's Degree | - | - |
| Bachelor's Degree | - | - |
| Graduate Degree | - | - |
| Total | $40,000 | $0 |
Family Income in Edgewood
Family Income Brackets in Edgewood
According to the Edgewood family income data, there are 8 families falling into the $75,000 to $99,999 income range, which is the most common income bracket and makes up 50.0% of all families.
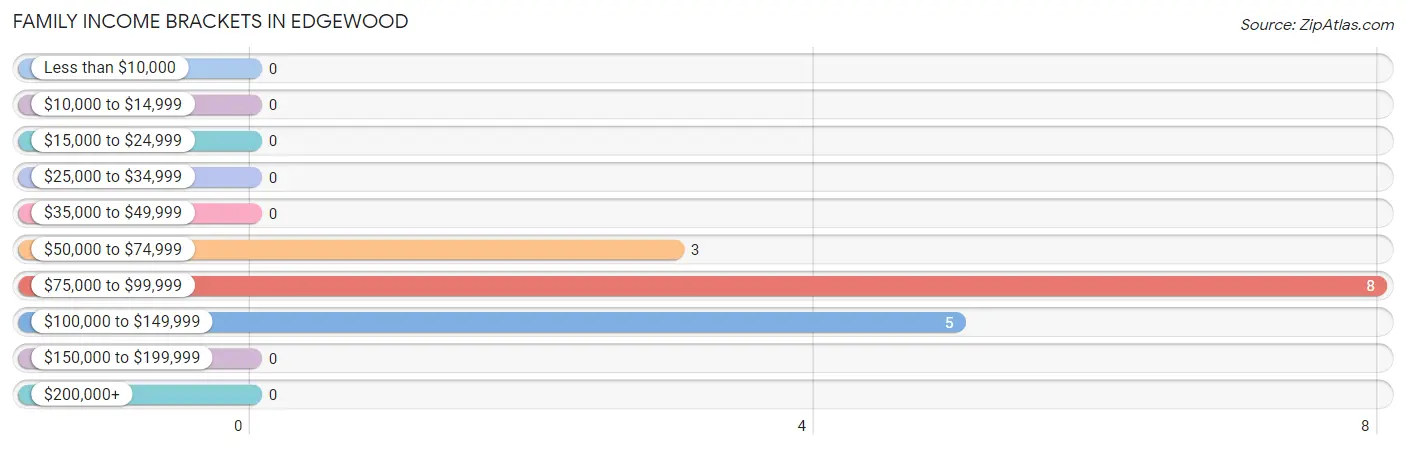
| Income Bracket | # Families | % Families |
| Less than $10,000 | 0 | 0.0% |
| $10,000 to $14,999 | 0 | 0.0% |
| $15,000 to $24,999 | 0 | 0.0% |
| $25,000 to $34,999 | 0 | 0.0% |
| $35,000 to $49,999 | 0 | 0.0% |
| $50,000 to $74,999 | 3 | 18.8% |
| $75,000 to $99,999 | 8 | 50.0% |
| $100,000 to $149,999 | 5 | 31.3% |
| $150,000 to $199,999 | 0 | 0.0% |
| $200,000+ | 0 | 0.0% |
Family Income by Famaliy Size in Edgewood
2-person families (12 | 75.0%) account for the highest median family income in Edgewood with $94,375 per family, while 2-person families (12 | 75.0%) have the highest median income of $47,188 per family member.
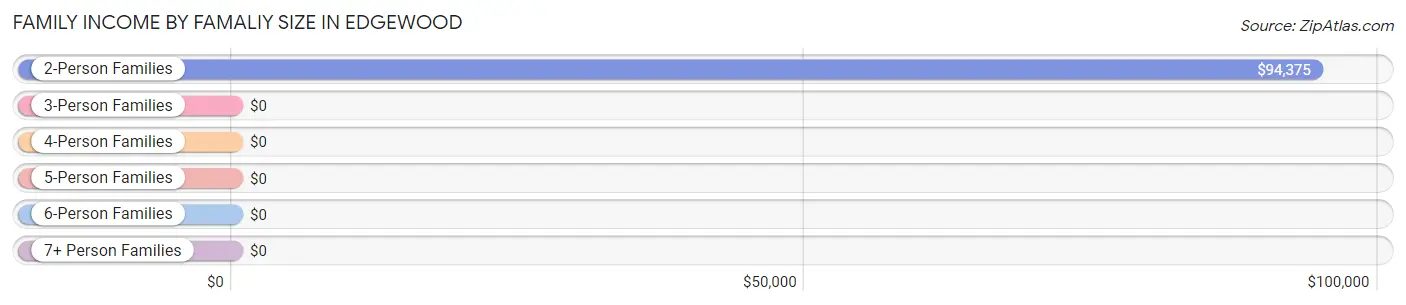
| Income Bracket | # Families | Median Income |
| 2-Person Families | 12 (75.0%) | $94,375 |
| 3-Person Families | 0 (0.0%) | $0 |
| 4-Person Families | 4 (25.0%) | $0 |
| 5-Person Families | 0 (0.0%) | $0 |
| 6-Person Families | 0 (0.0%) | $0 |
| 7+ Person Families | 0 (0.0%) | $0 |
| Total | 16 (100.0%) | $93,125 |
Family Income by Number of Earners in Edgewood
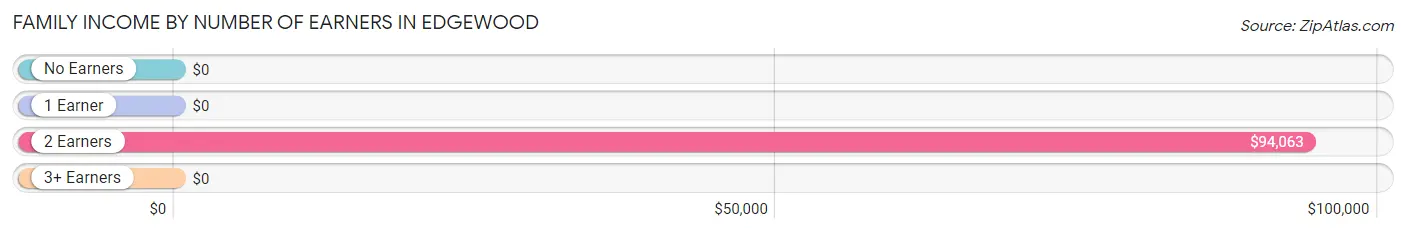
| Number of Earners | # Families | Median Income |
| No Earners | 0 (0.0%) | $0 |
| 1 Earner | 3 (18.8%) | $0 |
| 2 Earners | 13 (81.2%) | $94,063 |
| 3+ Earners | 0 (0.0%) | $0 |
| Total | 16 (100.0%) | $93,125 |
Household Income in Edgewood
Household Income Brackets in Edgewood
With 8 households falling in the category, the $75,000 to $99,999 income range is the most frequent in Edgewood, accounting for 50.0% of all households.
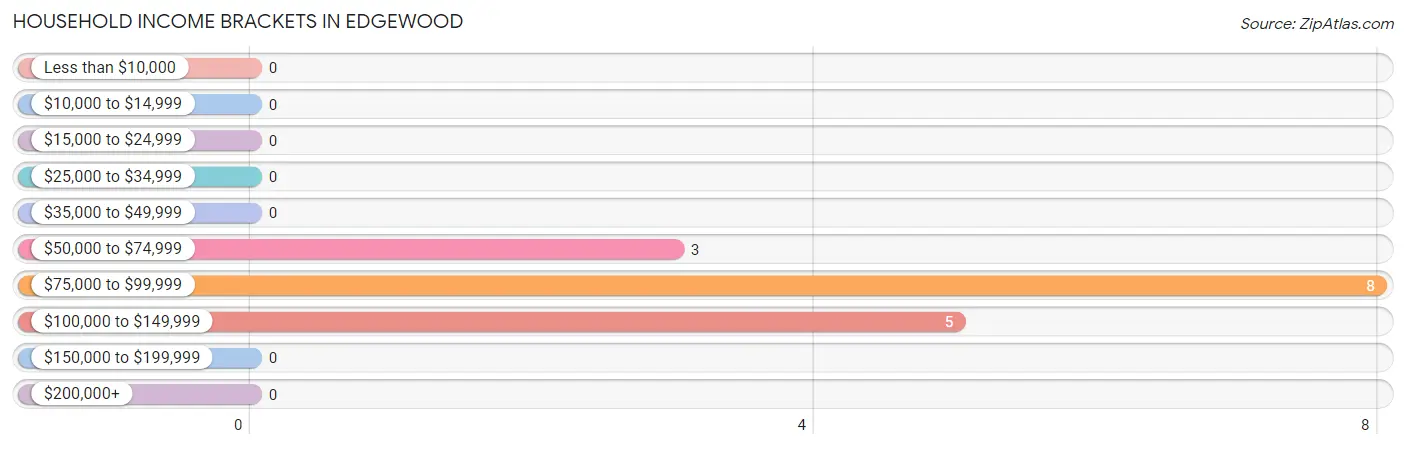
| Income Bracket | # Households | % Households |
| Less than $10,000 | 0 | 0.0% |
| $10,000 to $14,999 | 0 | 0.0% |
| $15,000 to $24,999 | 0 | 0.0% |
| $25,000 to $34,999 | 0 | 0.0% |
| $35,000 to $49,999 | 0 | 0.0% |
| $50,000 to $74,999 | 3 | 18.8% |
| $75,000 to $99,999 | 8 | 50.0% |
| $100,000 to $149,999 | 5 | 31.3% |
| $150,000 to $199,999 | 0 | 0.0% |
| $200,000+ | 0 | 0.0% |
Household Income by Householder Age in Edgewood
| Income Bracket | # Households | Median Income |
| 15 to 24 Years | 0 (0.0%) | $0 |
| 25 to 44 Years | 4 (25.0%) | $0 |
| 45 to 64 Years | 9 (56.2%) | $0 |
| 65+ Years | 3 (18.8%) | $0 |
| Total | 16 (100.0%) | $93,125 |
Poverty in Edgewood
Income Below Poverty by Sex and Age in Edgewood
| Age Bracket | Male | Female |
| Under 5 Years | 0 (0.0%) | 0 (0.0%) |
| 5 Years | 0 (0.0%) | 0 (0.0%) |
| 6 to 11 Years | 0 (0.0%) | 0 (0.0%) |
| 12 to 14 Years | 0 (0.0%) | 0 (0.0%) |
| 15 Years | 0 (0.0%) | 0 (0.0%) |
| 16 and 17 Years | 0 (0.0%) | 0 (0.0%) |
| 18 to 24 Years | 0 (0.0%) | 0 (0.0%) |
| 25 to 34 Years | 0 (0.0%) | 0 (0.0%) |
| 35 to 44 Years | 0 (0.0%) | 0 (0.0%) |
| 45 to 54 Years | 0 (0.0%) | 0 (0.0%) |
| 55 to 64 Years | 0 (0.0%) | 0 (0.0%) |
| 65 to 74 Years | 0 (0.0%) | 0 (0.0%) |
| 75 Years and over | 0 (0.0%) | 0 (0.0%) |
| Total | 0 (0.0%) | 0 (0.0%) |
Income Above Poverty by Sex and Age in Edgewood
According to the poverty statistics in Edgewood, males aged 35 to 44 years and females aged under 5 years are the age groups that are most secure financially, with 100.0% of males and 100.0% of females in these age groups living above the poverty line.
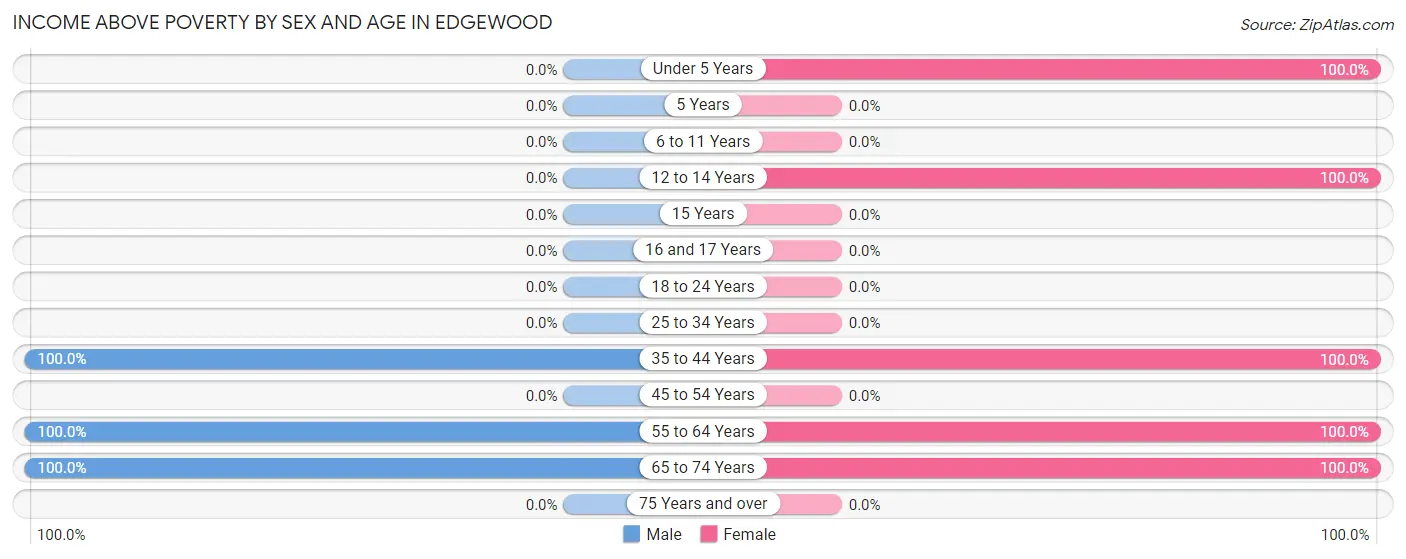
| Age Bracket | Male | Female |
| Under 5 Years | 0 (0.0%) | 12 (100.0%) |
| 5 Years | 0 (0.0%) | 0 (0.0%) |
| 6 to 11 Years | 0 (0.0%) | 0 (0.0%) |
| 12 to 14 Years | 0 (0.0%) | 4 (100.0%) |
| 15 Years | 0 (0.0%) | 0 (0.0%) |
| 16 and 17 Years | 0 (0.0%) | 0 (0.0%) |
| 18 to 24 Years | 0 (0.0%) | 0 (0.0%) |
| 25 to 34 Years | 0 (0.0%) | 0 (0.0%) |
| 35 to 44 Years | 3 (100.0%) | 4 (100.0%) |
| 45 to 54 Years | 0 (0.0%) | 0 (0.0%) |
| 55 to 64 Years | 8 (100.0%) | 9 (100.0%) |
| 65 to 74 Years | 3 (100.0%) | 3 (100.0%) |
| 75 Years and over | 0 (0.0%) | 0 (0.0%) |
| Total | 14 (100.0%) | 32 (100.0%) |
Income Below Poverty Among Married-Couple Families in Edgewood
| Children | Above Poverty | Below Poverty |
| No Children | 12 (100.0%) | 0 (0.0%) |
| 1 or 2 Children | 4 (100.0%) | 0 (0.0%) |
| 3 or 4 Children | 0 (0.0%) | 0 (0.0%) |
| 5 or more Children | 0 (0.0%) | 0 (0.0%) |
| Total | 16 (100.0%) | 0 (0.0%) |
Income Below Poverty Among Single-Parent Households in Edgewood
| Children | Single Father | Single Mother |
| No Children | 0 (0.0%) | 0 (0.0%) |
| 1 or 2 Children | 0 (0.0%) | 0 (0.0%) |
| 3 or 4 Children | 0 (0.0%) | 0 (0.0%) |
| 5 or more Children | 0 (0.0%) | 0 (0.0%) |
| Total | 0 (0.0%) | 0 (0.0%) |
Income Below Poverty Among Married-Couple vs Single-Parent Households in Edgewood
| Children | Married-Couple Families | Single-Parent Households |
| No Children | 0 (0.0%) | 0 (0.0%) |
| 1 or 2 Children | 0 (0.0%) | 0 (0.0%) |
| 3 or 4 Children | 0 (0.0%) | 0 (0.0%) |
| 5 or more Children | 0 (0.0%) | 0 (0.0%) |
| Total | 0 (0.0%) | 0 (0.0%) |
Race in Edgewood
The most populous races in Edgewood are White / Caucasian (46 | 100.0%), and Hispanic or Latino (15 | 32.6%).
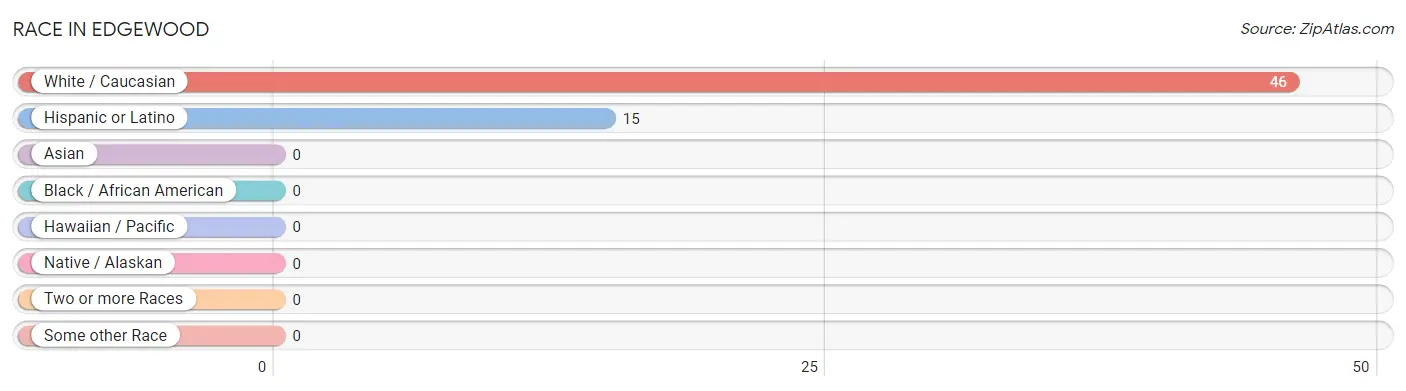
| Race | # Population | % Population |
| Asian | 0 | 0.0% |
| Black / African American | 0 | 0.0% |
| Hawaiian / Pacific | 0 | 0.0% |
| Hispanic or Latino | 15 | 32.6% |
| Native / Alaskan | 0 | 0.0% |
| White / Caucasian | 46 | 100.0% |
| Two or more Races | 0 | 0.0% |
| Some other Race | 0 | 0.0% |
| Total | 46 | 100.0% |
Ancestry in Edgewood
The most populous ancestries reported in Edgewood are Italian (32 | 69.6%), Mexican (15 | 32.6%), and English (13 | 28.3%), together accounting for 130.4% of all Edgewood residents.
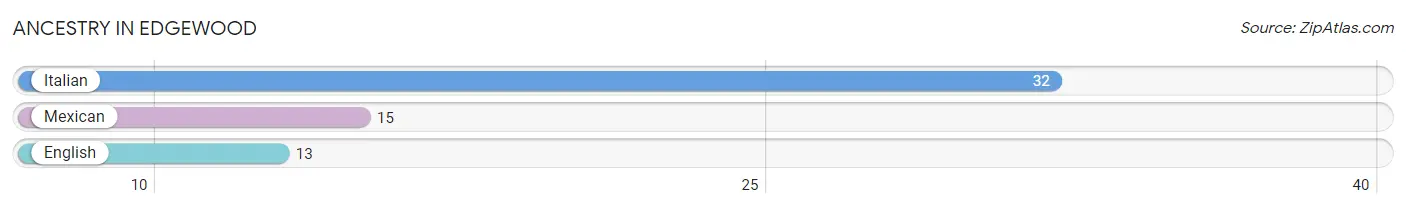
| Ancestry | # Population | % Population |
| English | 13 | 28.3% |
| Italian | 32 | 69.6% |
| Mexican | 15 | 32.6% | View All 3 Rows |
Immigrants in Edgewood

| Immigration Origin | # Population | % Population | View All 0 Rows |
Sex and Age in Edgewood
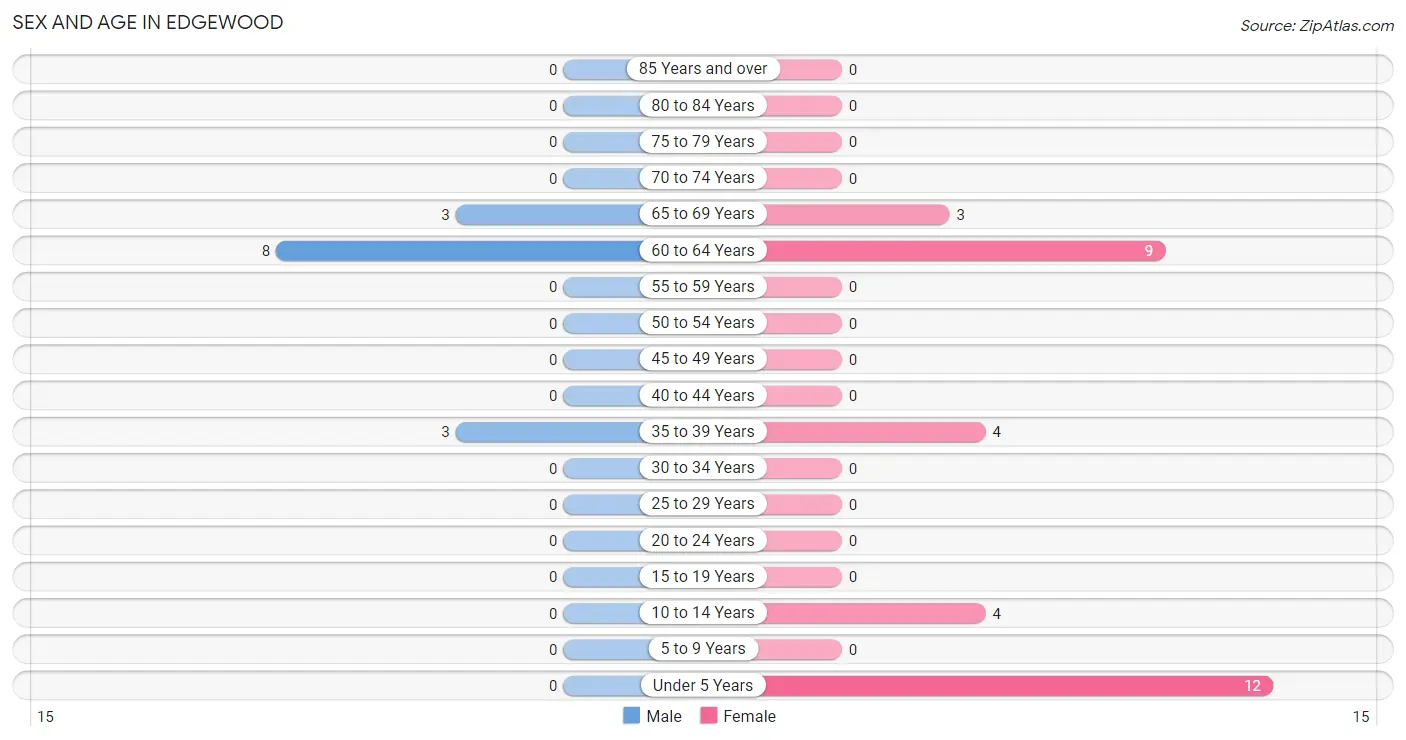
Sex and Age in Edgewood
The most populous age groups in Edgewood are 60 to 64 Years (8 | 57.1%) for men and Under 5 Years (12 | 37.5%) for women.
| Age Bracket | Male | Female |
| Under 5 Years | 0 (0.0%) | 12 (37.5%) |
| 5 to 9 Years | 0 (0.0%) | 0 (0.0%) |
| 10 to 14 Years | 0 (0.0%) | 4 (12.5%) |
| 15 to 19 Years | 0 (0.0%) | 0 (0.0%) |
| 20 to 24 Years | 0 (0.0%) | 0 (0.0%) |
| 25 to 29 Years | 0 (0.0%) | 0 (0.0%) |
| 30 to 34 Years | 0 (0.0%) | 0 (0.0%) |
| 35 to 39 Years | 3 (21.4%) | 4 (12.5%) |
| 40 to 44 Years | 0 (0.0%) | 0 (0.0%) |
| 45 to 49 Years | 0 (0.0%) | 0 (0.0%) |
| 50 to 54 Years | 0 (0.0%) | 0 (0.0%) |
| 55 to 59 Years | 0 (0.0%) | 0 (0.0%) |
| 60 to 64 Years | 8 (57.1%) | 9 (28.1%) |
| 65 to 69 Years | 3 (21.4%) | 3 (9.4%) |
| 70 to 74 Years | 0 (0.0%) | 0 (0.0%) |
| 75 to 79 Years | 0 (0.0%) | 0 (0.0%) |
| 80 to 84 Years | 0 (0.0%) | 0 (0.0%) |
| 85 Years and over | 0 (0.0%) | 0 (0.0%) |
| Total | 14 (100.0%) | 32 (100.0%) |
Families and Households in Edgewood
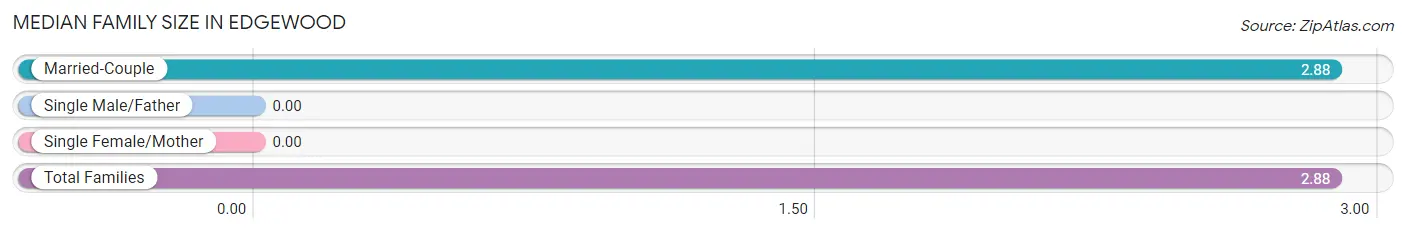
Median Family Size in Edgewood
| Family Type | # Families | Family Size |
| Married-Couple | 16 (100.0%) | 2.88 |
| Single Male/Father | 0 (0.0%) | - |
| Single Female/Mother | 0 (0.0%) | - |
| Total Families | 16 (100.0%) | 2.88 |
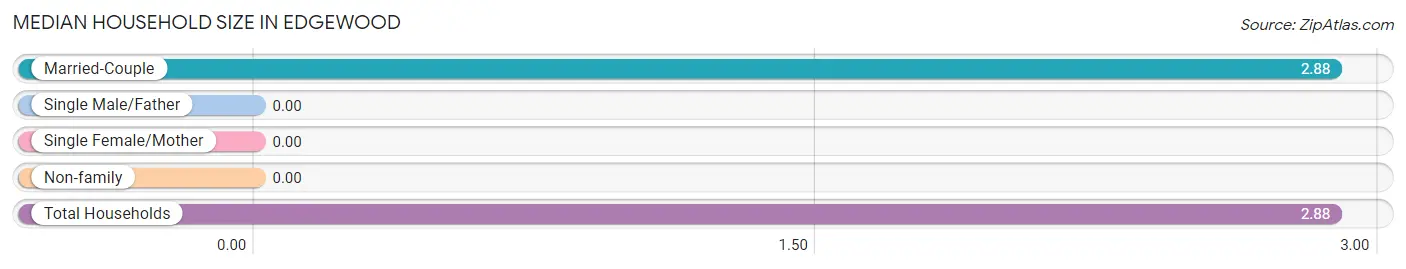
Median Household Size in Edgewood
| Household Type | # Households | Household Size |
| Married-Couple | 16 (100.0%) | 2.88 |
| Single Male/Father | 0 (0.0%) | - |
| Single Female/Mother | 0 (0.0%) | - |
| Non-family | 0 (0.0%) | - |
| Total Households | 16 (100.0%) | 2.88 |
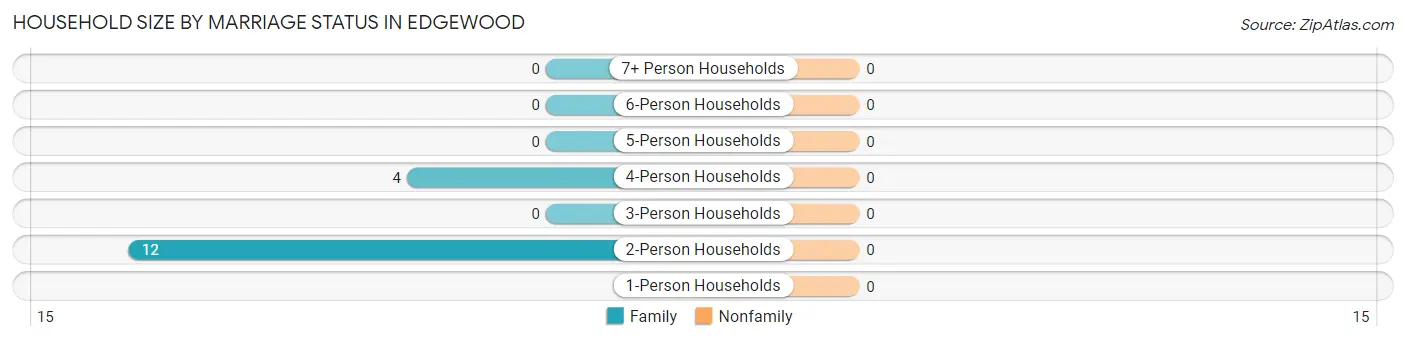
Household Size by Marriage Status in Edgewood
| Household Size | Family Households | Nonfamily Households |
| 1-Person Households | - | 0 (0.0%) |
| 2-Person Households | 12 (75.0%) | 0 (0.0%) |
| 3-Person Households | 0 (0.0%) | 0 (0.0%) |
| 4-Person Households | 4 (25.0%) | 0 (0.0%) |
| 5-Person Households | 0 (0.0%) | 0 (0.0%) |
| 6-Person Households | 0 (0.0%) | 0 (0.0%) |
| 7+ Person Households | 0 (0.0%) | 0 (0.0%) |
| Total | 16 (100.0%) | 0 (0.0%) |
Female Fertility in Edgewood
Fertility by Age in Edgewood
| Age Bracket | Women with Births | Births / 1,000 Women |
| 15 to 19 years | 0 (0.0%) | 0.0 |
| 20 to 34 years | 0 (0.0%) | 0.0 |
| 35 to 50 years | 0 (0.0%) | 0.0 |
| Total | 0 (0.0%) | 0.0 |
Fertility by Age by Marriage Status in Edgewood
| Age Bracket | Married | Unmarried |
| 15 to 19 years | 0 (0.0%) | 0 (0.0%) |
| 20 to 34 years | 0 (0.0%) | 0 (0.0%) |
| 35 to 50 years | 0 (0.0%) | 0 (0.0%) |
| Total | 0 (0.0%) | 0 (0.0%) |
Fertility by Education in Edgewood
| Educational Attainment | Women with Births | Births / 1,000 Women |
| Less than High School | 0 (0.0%) | 0.0 |
| High School Diploma | 0 (0.0%) | 0.0 |
| College or Associate's Degree | 0 (0.0%) | 0.0 |
| Bachelor's Degree | 0 (0.0%) | 0.0 |
| Graduate Degree | 0 (0.0%) | 0.0 |
| Total | 0 (0.0%) | 0.0 |
Fertility by Education by Marriage Status in Edgewood
| Educational Attainment | Married | Unmarried |
| Less than High School | 0 (0.0%) | 0 (0.0%) |
| High School Diploma | 0 (0.0%) | 0 (0.0%) |
| College or Associate's Degree | 0 (0.0%) | 0 (0.0%) |
| Bachelor's Degree | 0 (0.0%) | 0 (0.0%) |
| Graduate Degree | 0 (0.0%) | 0 (0.0%) |
| Total | 0 (0.0%) | 0 (0.0%) |
Employment Characteristics in Edgewood
Employment by Class of Employer in Edgewood
Among the 15 employed individuals in Edgewood, local government employees (8 | 53.3%), private company employees (4 | 26.7%), and unpaid family workers (3 | 20.0%) make up the most common classes of employment.
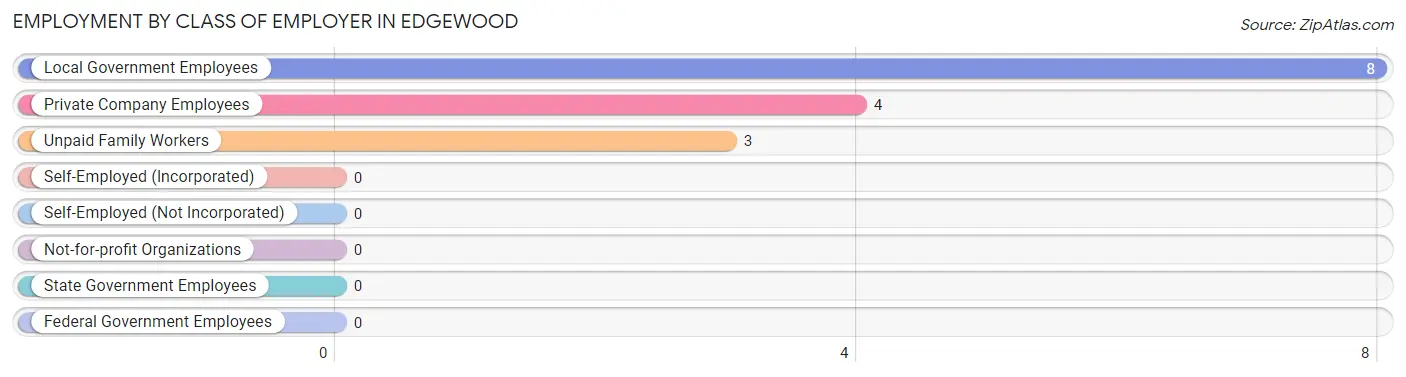
| Employer Class | # Employees | % Employees |
| Private Company Employees | 4 | 26.7% |
| Self-Employed (Incorporated) | 0 | 0.0% |
| Self-Employed (Not Incorporated) | 0 | 0.0% |
| Not-for-profit Organizations | 0 | 0.0% |
| Local Government Employees | 8 | 53.3% |
| State Government Employees | 0 | 0.0% |
| Federal Government Employees | 0 | 0.0% |
| Unpaid Family Workers | 3 | 20.0% |
| Total | 15 | 100.0% |
Employment Status by Age in Edgewood
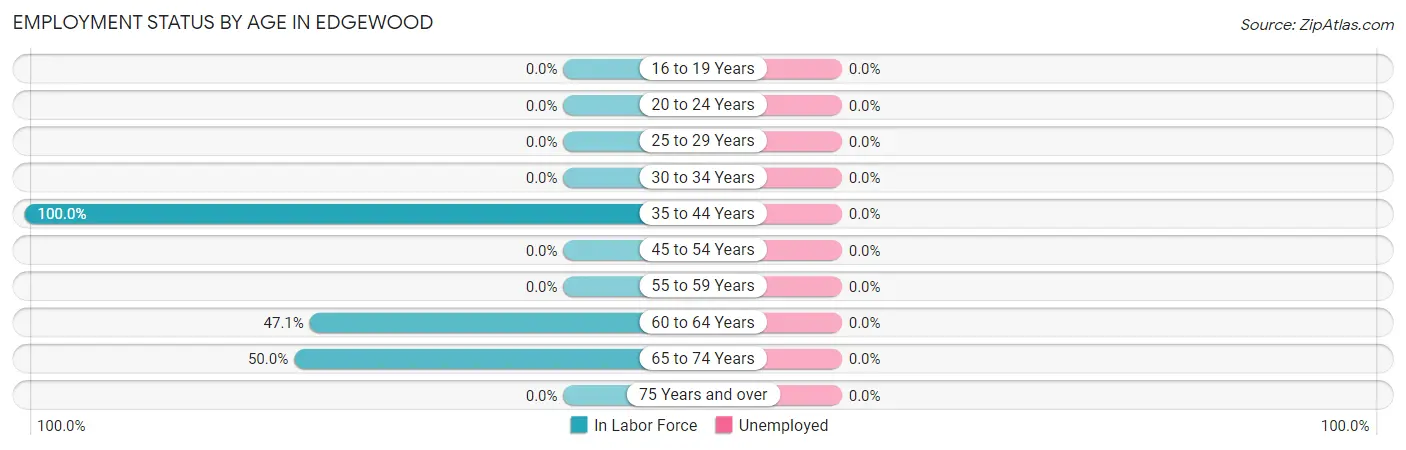
| Age Bracket | In Labor Force | Unemployed |
| 16 to 19 Years | 0 (0.0%) | 0 (0.0%) |
| 20 to 24 Years | 0 (0.0%) | 0 (0.0%) |
| 25 to 29 Years | 0 (0.0%) | 0 (0.0%) |
| 30 to 34 Years | 0 (0.0%) | 0 (0.0%) |
| 35 to 44 Years | 7 (100.0%) | 0 (0.0%) |
| 45 to 54 Years | 0 (0.0%) | 0 (0.0%) |
| 55 to 59 Years | 0 (0.0%) | 0 (0.0%) |
| 60 to 64 Years | 8 (47.1%) | 0 (0.0%) |
| 65 to 74 Years | 3 (50.0%) | 0 (0.0%) |
| 75 Years and over | 0 (0.0%) | 0 (0.0%) |
| Total | 18 (60.0%) | 0 (0.0%) |
Employment Status by Educational Attainment in Edgewood
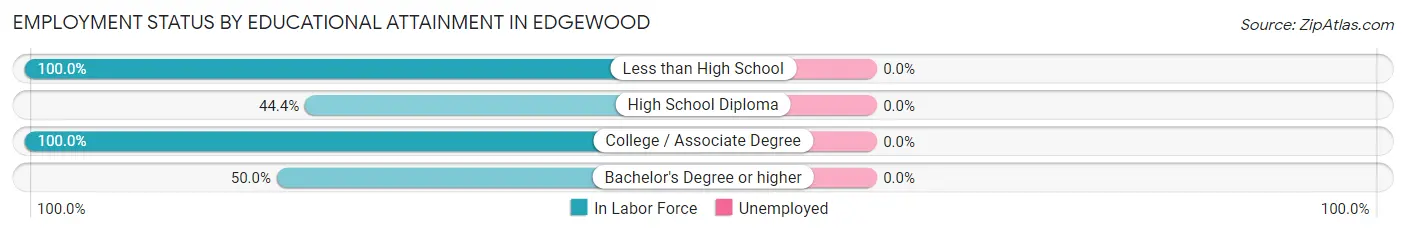
| Educational Attainment | In Labor Force | Unemployed |
| Less than High School | 3 (100.0%) | 0 (0.0%) |
| High School Diploma | 4 (44.4%) | 0 (0.0%) |
| College / Associate Degree | 4 (100.0%) | 0 (0.0%) |
| Bachelor's Degree or higher | 4 (50.0%) | 0 (0.0%) |
| Total | 15 (62.5%) | 0 (0.0%) |
Employment Occupations by Sex in Edgewood
Management, Business, Science and Arts Occupations
The most common Management, Business, Science and Arts occupations in Edgewood are , and Business & Financial (4 | 22.2%).
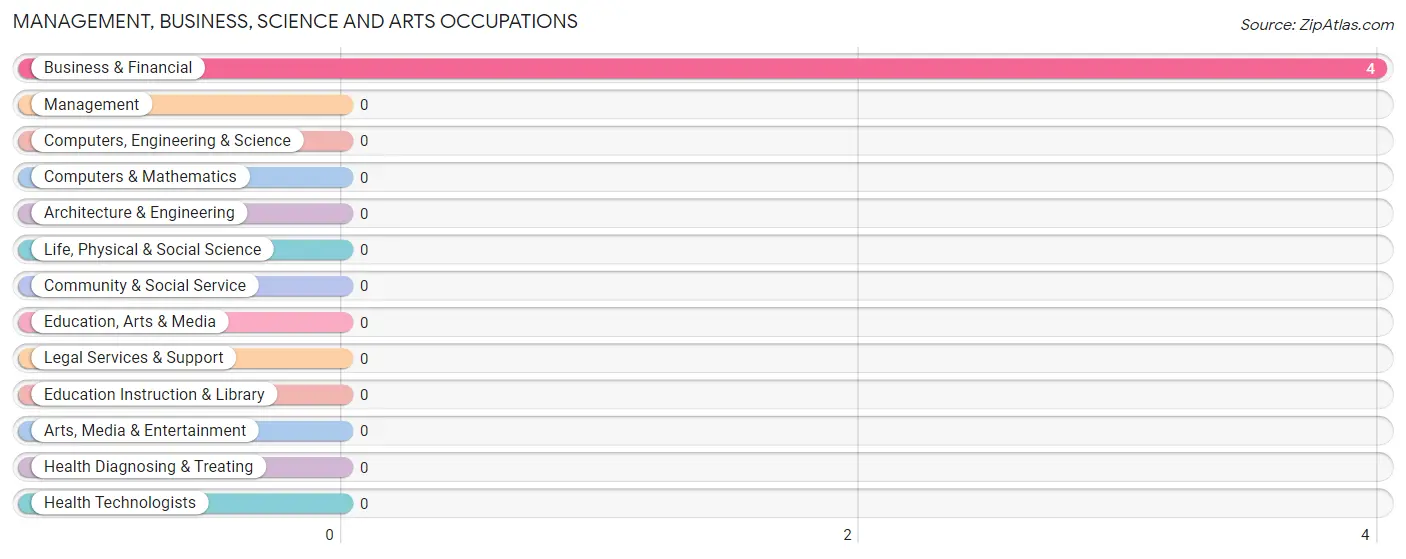
Management, Business, Science and Arts Occupations by Sex
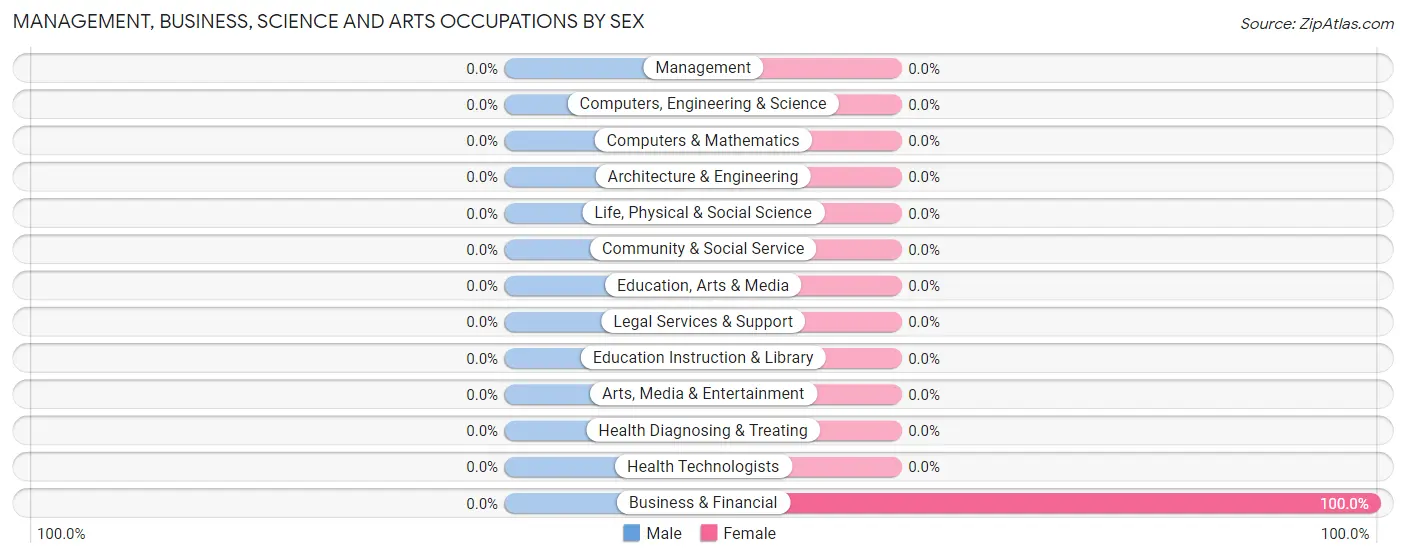
| Occupation | Male | Female |
| Management | 0 (0.0%) | 0 (0.0%) |
| Business & Financial | 0 (0.0%) | 4 (100.0%) |
| Computers, Engineering & Science | 0 (0.0%) | 0 (0.0%) |
| Computers & Mathematics | 0 (0.0%) | 0 (0.0%) |
| Architecture & Engineering | 0 (0.0%) | 0 (0.0%) |
| Life, Physical & Social Science | 0 (0.0%) | 0 (0.0%) |
| Community & Social Service | 0 (0.0%) | 0 (0.0%) |
| Education, Arts & Media | 0 (0.0%) | 0 (0.0%) |
| Legal Services & Support | 0 (0.0%) | 0 (0.0%) |
| Education Instruction & Library | 0 (0.0%) | 0 (0.0%) |
| Arts, Media & Entertainment | 0 (0.0%) | 0 (0.0%) |
| Health Diagnosing & Treating | 0 (0.0%) | 0 (0.0%) |
| Health Technologists | 0 (0.0%) | 0 (0.0%) |
| Total (Category) | 0 (0.0%) | 4 (100.0%) |
| Total (Overall) | 14 (77.8%) | 4 (22.2%) |
Services Occupations
Services Occupations by Sex
| Occupation | Male | Female |
| Healthcare Support | 0 (0.0%) | 0 (0.0%) |
| Security & Protection | 0 (0.0%) | 0 (0.0%) |
| Firefighting & Prevention | 0 (0.0%) | 0 (0.0%) |
| Law Enforcement | 0 (0.0%) | 0 (0.0%) |
| Food Preparation & Serving | 0 (0.0%) | 0 (0.0%) |
| Cleaning & Maintenance | 0 (0.0%) | 0 (0.0%) |
| Personal Care & Service | 0 (0.0%) | 0 (0.0%) |
| Total (Category) | 0 (0.0%) | 0 (0.0%) |
| Total (Overall) | 14 (77.8%) | 4 (22.2%) |
Sales and Office Occupations
Sales and Office Occupations by Sex
| Occupation | Male | Female |
| Sales & Related | 0 (0.0%) | 0 (0.0%) |
| Office & Administration | 0 (0.0%) | 0 (0.0%) |
| Total (Category) | 0 (0.0%) | 0 (0.0%) |
| Total (Overall) | 14 (77.8%) | 4 (22.2%) |
Natural Resources, Construction and Maintenance Occupations
The most common Natural Resources, Construction and Maintenance occupations in Edgewood are , and Installation, Maintenance & Repair (7 | 38.9%).
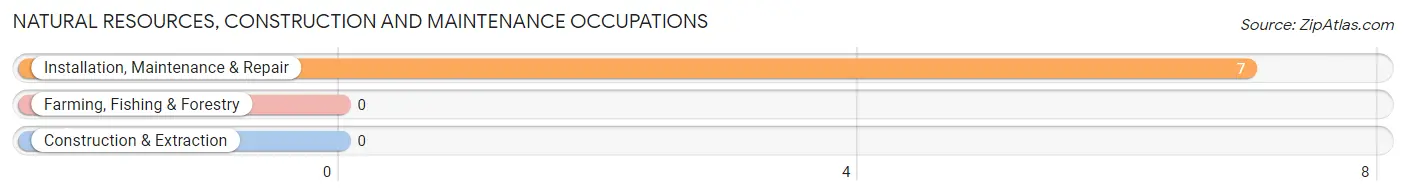
Natural Resources, Construction and Maintenance Occupations by Sex
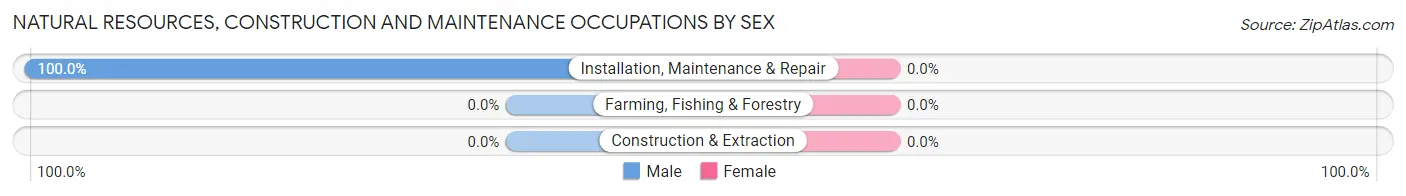
| Occupation | Male | Female |
| Farming, Fishing & Forestry | 0 (0.0%) | 0 (0.0%) |
| Construction & Extraction | 0 (0.0%) | 0 (0.0%) |
| Installation, Maintenance & Repair | 7 (100.0%) | 0 (0.0%) |
| Total (Category) | 7 (100.0%) | 0 (0.0%) |
| Total (Overall) | 14 (77.8%) | 4 (22.2%) |
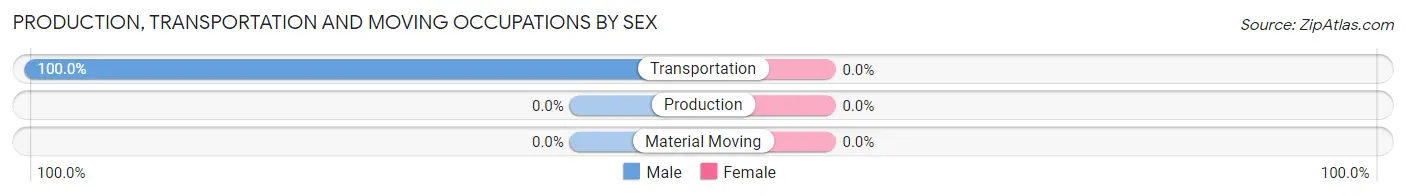
Production, Transportation and Moving Occupations
The most common Production, Transportation and Moving occupations in Edgewood are , and Transportation (7 | 38.9%).
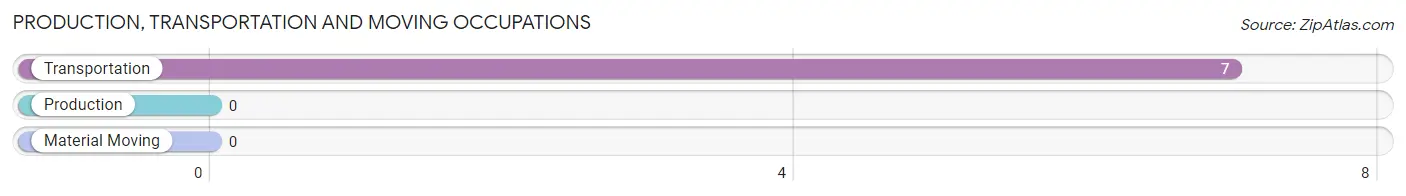
Production, Transportation and Moving Occupations by Sex
| Occupation | Male | Female |
| Production | 0 (0.0%) | 0 (0.0%) |
| Transportation | 7 (100.0%) | 0 (0.0%) |
| Material Moving | 0 (0.0%) | 0 (0.0%) |
| Total (Category) | 7 (100.0%) | 0 (0.0%) |
| Total (Overall) | 14 (77.8%) | 4 (22.2%) |
Employment Industries by Sex in Edgewood
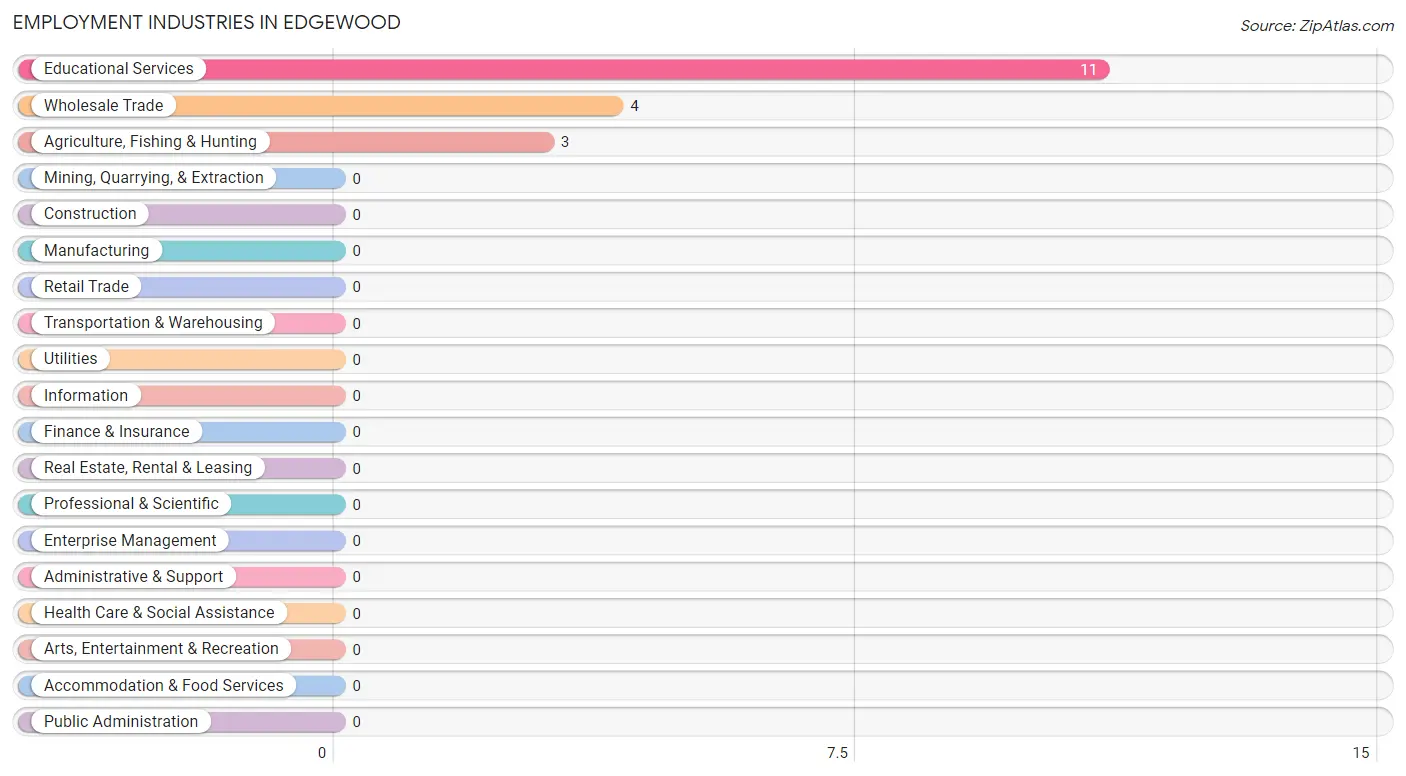
Employment Industries in Edgewood
The major employment industries in Edgewood include Educational Services (11 | 61.1%), Wholesale Trade (4 | 22.2%), and Agriculture, Fishing & Hunting (3 | 16.7%).
Employment Industries by Sex in Edgewood
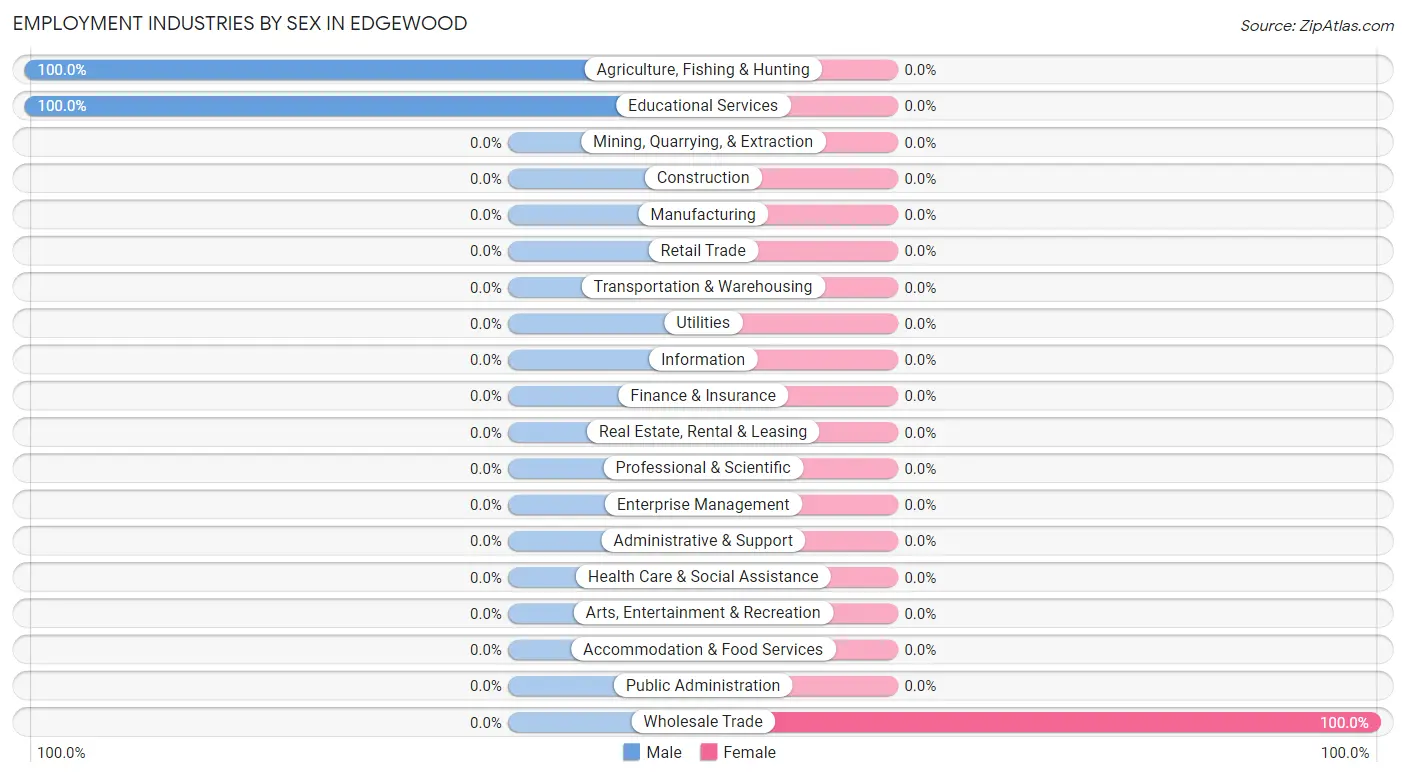
| Industry | Male | Female |
| Agriculture, Fishing & Hunting | 3 (100.0%) | 0 (0.0%) |
| Mining, Quarrying, & Extraction | 0 (0.0%) | 0 (0.0%) |
| Construction | 0 (0.0%) | 0 (0.0%) |
| Manufacturing | 0 (0.0%) | 0 (0.0%) |
| Wholesale Trade | 0 (0.0%) | 4 (100.0%) |
| Retail Trade | 0 (0.0%) | 0 (0.0%) |
| Transportation & Warehousing | 0 (0.0%) | 0 (0.0%) |
| Utilities | 0 (0.0%) | 0 (0.0%) |
| Information | 0 (0.0%) | 0 (0.0%) |
| Finance & Insurance | 0 (0.0%) | 0 (0.0%) |
| Real Estate, Rental & Leasing | 0 (0.0%) | 0 (0.0%) |
| Professional & Scientific | 0 (0.0%) | 0 (0.0%) |
| Enterprise Management | 0 (0.0%) | 0 (0.0%) |
| Administrative & Support | 0 (0.0%) | 0 (0.0%) |
| Educational Services | 11 (100.0%) | 0 (0.0%) |
| Health Care & Social Assistance | 0 (0.0%) | 0 (0.0%) |
| Arts, Entertainment & Recreation | 0 (0.0%) | 0 (0.0%) |
| Accommodation & Food Services | 0 (0.0%) | 0 (0.0%) |
| Public Administration | 0 (0.0%) | 0 (0.0%) |
| Total | 14 (77.8%) | 4 (22.2%) |
Education in Edgewood
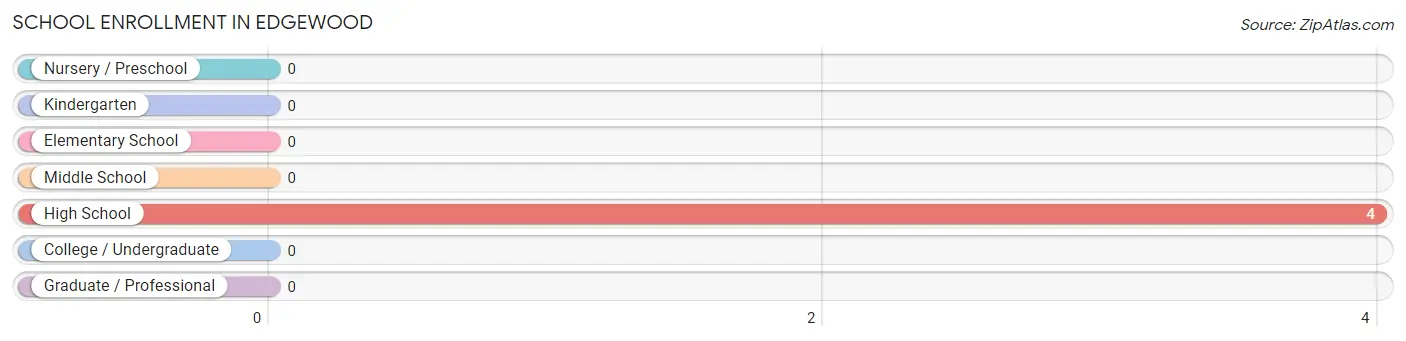
School Enrollment in Edgewood
| School Level | # Students | % Students |
| Nursery / Preschool | 0 | 0.0% |
| Kindergarten | 0 | 0.0% |
| Elementary School | 0 | 0.0% |
| Middle School | 0 | 0.0% |
| High School | 4 | 100.0% |
| College / Undergraduate | 0 | 0.0% |
| Graduate / Professional | 0 | 0.0% |
| Total | 4 | 100.0% |
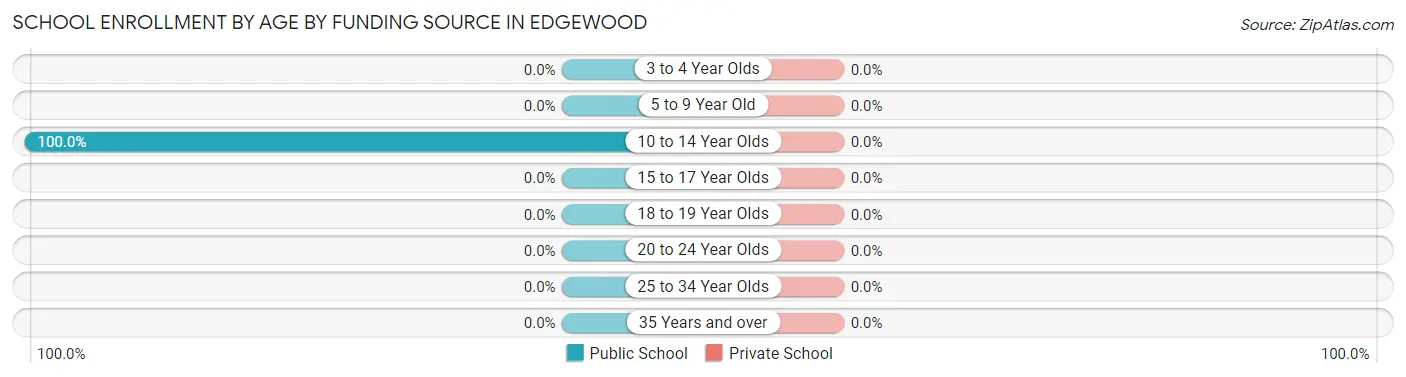
School Enrollment by Age by Funding Source in Edgewood
| Age Bracket | Public School | Private School |
| 3 to 4 Year Olds | 0 (0.0%) | 0 (0.0%) |
| 5 to 9 Year Old | 0 (0.0%) | 0 (0.0%) |
| 10 to 14 Year Olds | 4 (100.0%) | 0 (0.0%) |
| 15 to 17 Year Olds | 0 (0.0%) | 0 (0.0%) |
| 18 to 19 Year Olds | 0 (0.0%) | 0 (0.0%) |
| 20 to 24 Year Olds | 0 (0.0%) | 0 (0.0%) |
| 25 to 34 Year Olds | 0 (0.0%) | 0 (0.0%) |
| 35 Years and over | 0 (0.0%) | 0 (0.0%) |
| Total | 4 (100.0%) | 0 (0.0%) |
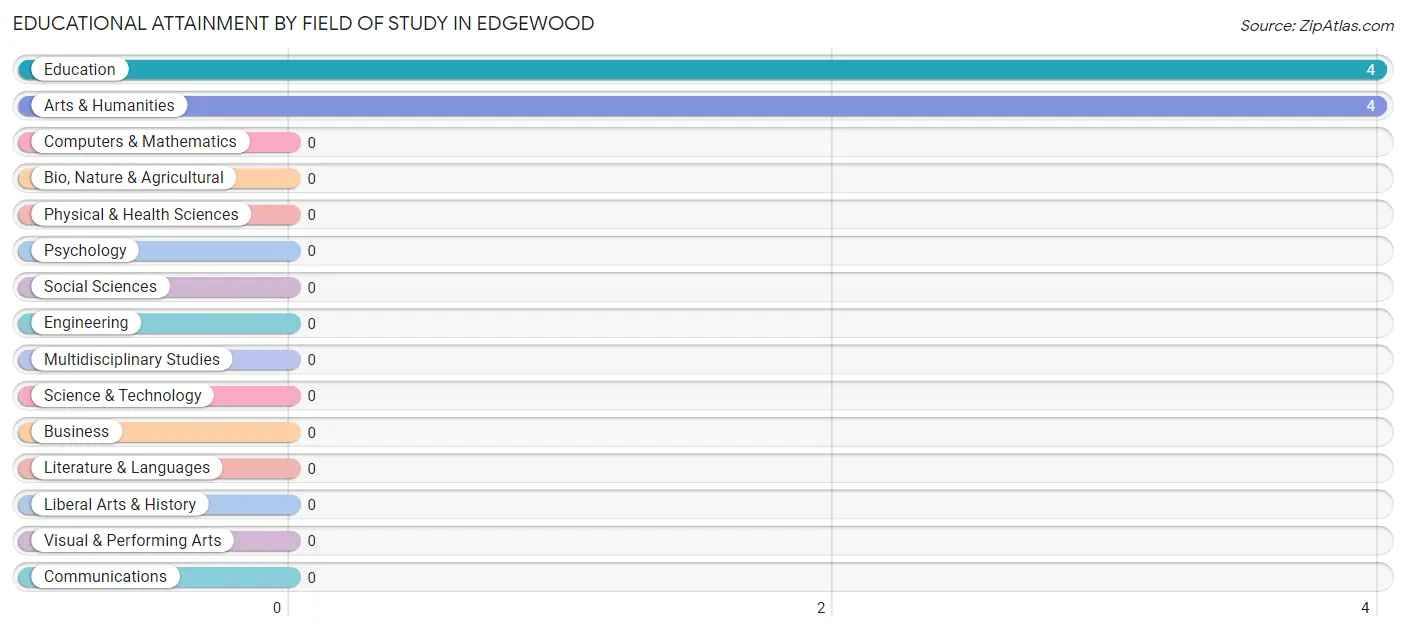
Educational Attainment by Field of Study in Edgewood
Education (4 | 50.0%), and arts & humanities (4 | 50.0%) are the most common fields of study among 8 individuals in Edgewood who have obtained a bachelor's degree or higher.
| Field of Study | # Graduates | % Graduates |
| Computers & Mathematics | 0 | 0.0% |
| Bio, Nature & Agricultural | 0 | 0.0% |
| Physical & Health Sciences | 0 | 0.0% |
| Psychology | 0 | 0.0% |
| Social Sciences | 0 | 0.0% |
| Engineering | 0 | 0.0% |
| Multidisciplinary Studies | 0 | 0.0% |
| Science & Technology | 0 | 0.0% |
| Business | 0 | 0.0% |
| Education | 4 | 50.0% |
| Literature & Languages | 0 | 0.0% |
| Liberal Arts & History | 0 | 0.0% |
| Visual & Performing Arts | 0 | 0.0% |
| Communications | 0 | 0.0% |
| Arts & Humanities | 4 | 50.0% |
| Total | 8 | 100.0% |
Transportation & Commute in Edgewood
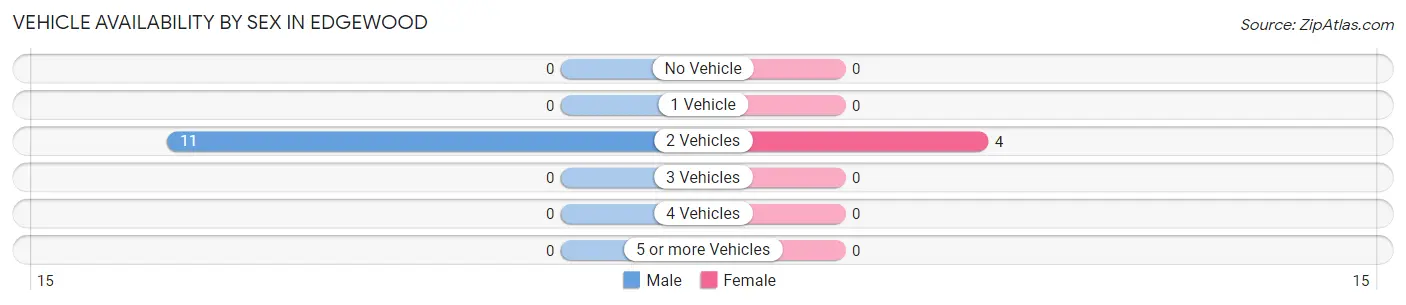
Vehicle Availability by Sex in Edgewood
The most prevalent vehicle ownership categories in Edgewood are males with 2 vehicles (11, accounting for 100.0%) and females with 2 vehicles (4, making up 275.0%).
| Vehicles Available | Male | Female |
| No Vehicle | 0 (0.0%) | 0 (0.0%) |
| 1 Vehicle | 0 (0.0%) | 0 (0.0%) |
| 2 Vehicles | 11 (100.0%) | 4 (100.0%) |
| 3 Vehicles | 0 (0.0%) | 0 (0.0%) |
| 4 Vehicles | 0 (0.0%) | 0 (0.0%) |
| 5 or more Vehicles | 0 (0.0%) | 0 (0.0%) |
| Total | 11 (100.0%) | 4 (100.0%) |
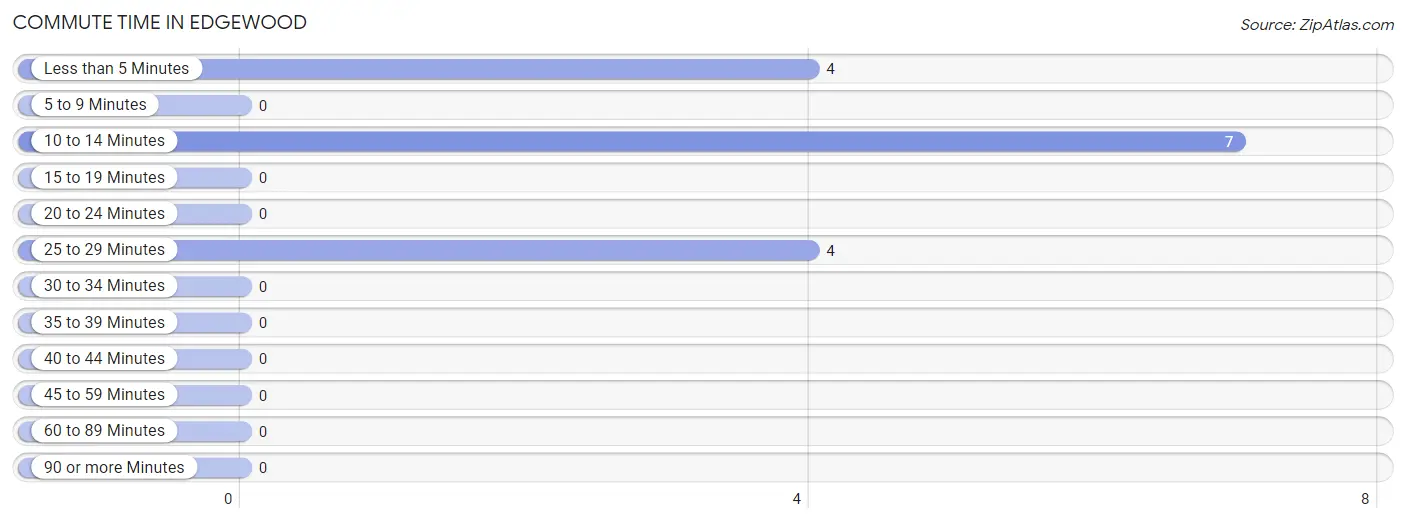
Commute Time in Edgewood
The most frequently occuring commute durations in Edgewood are 10 to 14 minutes (7 commuters, 46.7%), less than 5 minutes (4 commuters, 26.7%), and 25 to 29 minutes (4 commuters, 26.7%).
| Commute Time | # Commuters | % Commuters |
| Less than 5 Minutes | 4 | 26.7% |
| 5 to 9 Minutes | 0 | 0.0% |
| 10 to 14 Minutes | 7 | 46.7% |
| 15 to 19 Minutes | 0 | 0.0% |
| 20 to 24 Minutes | 0 | 0.0% |
| 25 to 29 Minutes | 4 | 26.7% |
| 30 to 34 Minutes | 0 | 0.0% |
| 35 to 39 Minutes | 0 | 0.0% |
| 40 to 44 Minutes | 0 | 0.0% |
| 45 to 59 Minutes | 0 | 0.0% |
| 60 to 89 Minutes | 0 | 0.0% |
| 90 or more Minutes | 0 | 0.0% |
Commute Time by Sex in Edgewood
The most common commute times in Edgewood are 10 to 14 minutes (7 commuters, 63.6%) for males and 25 to 29 minutes (4 commuters, 100.0%) for females.
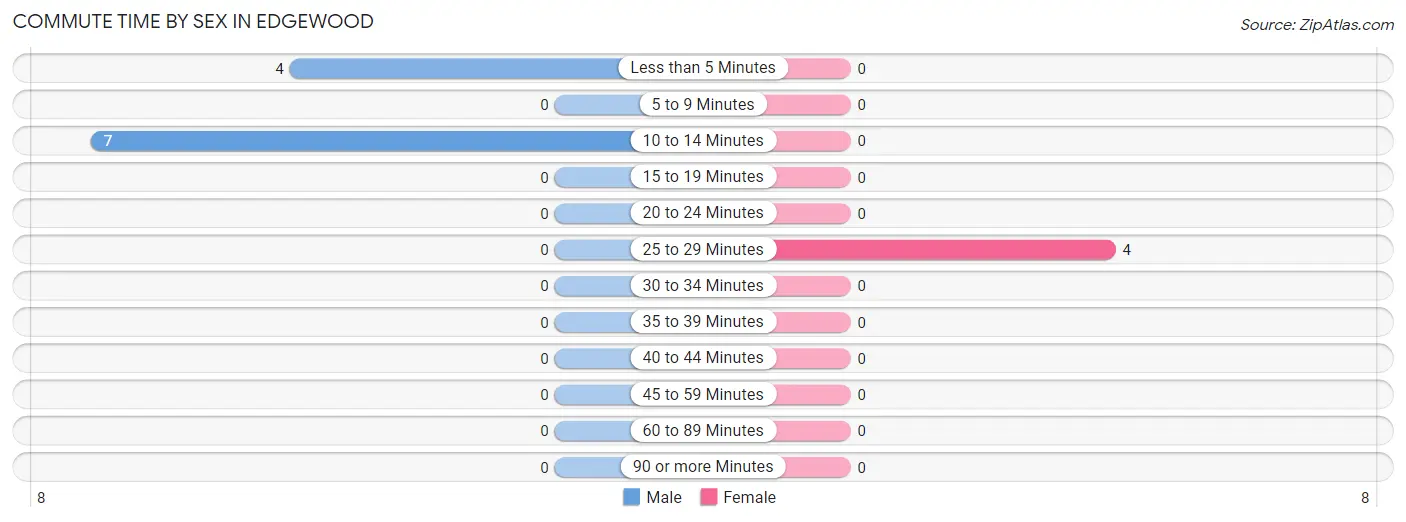
| Commute Time | Male | Female |
| Less than 5 Minutes | 4 (36.4%) | 0 (0.0%) |
| 5 to 9 Minutes | 0 (0.0%) | 0 (0.0%) |
| 10 to 14 Minutes | 7 (63.6%) | 0 (0.0%) |
| 15 to 19 Minutes | 0 (0.0%) | 0 (0.0%) |
| 20 to 24 Minutes | 0 (0.0%) | 0 (0.0%) |
| 25 to 29 Minutes | 0 (0.0%) | 4 (100.0%) |
| 30 to 34 Minutes | 0 (0.0%) | 0 (0.0%) |
| 35 to 39 Minutes | 0 (0.0%) | 0 (0.0%) |
| 40 to 44 Minutes | 0 (0.0%) | 0 (0.0%) |
| 45 to 59 Minutes | 0 (0.0%) | 0 (0.0%) |
| 60 to 89 Minutes | 0 (0.0%) | 0 (0.0%) |
| 90 or more Minutes | 0 (0.0%) | 0 (0.0%) |
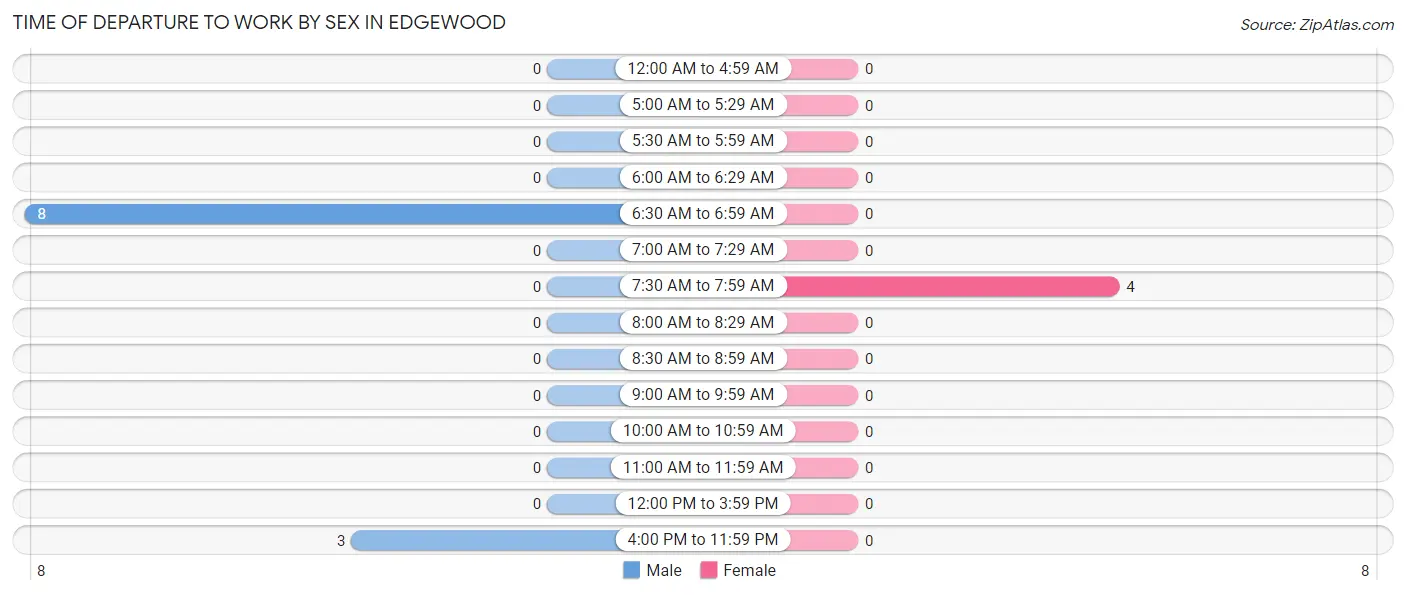
Time of Departure to Work by Sex in Edgewood
The most frequent times of departure to work in Edgewood are 6:30 AM to 6:59 AM (8, 72.7%) for males and 7:30 AM to 7:59 AM (4, 100.0%) for females.
| Time of Departure | Male | Female |
| 12:00 AM to 4:59 AM | 0 (0.0%) | 0 (0.0%) |
| 5:00 AM to 5:29 AM | 0 (0.0%) | 0 (0.0%) |
| 5:30 AM to 5:59 AM | 0 (0.0%) | 0 (0.0%) |
| 6:00 AM to 6:29 AM | 0 (0.0%) | 0 (0.0%) |
| 6:30 AM to 6:59 AM | 8 (72.7%) | 0 (0.0%) |
| 7:00 AM to 7:29 AM | 0 (0.0%) | 0 (0.0%) |
| 7:30 AM to 7:59 AM | 0 (0.0%) | 4 (100.0%) |
| 8:00 AM to 8:29 AM | 0 (0.0%) | 0 (0.0%) |
| 8:30 AM to 8:59 AM | 0 (0.0%) | 0 (0.0%) |
| 9:00 AM to 9:59 AM | 0 (0.0%) | 0 (0.0%) |
| 10:00 AM to 10:59 AM | 0 (0.0%) | 0 (0.0%) |
| 11:00 AM to 11:59 AM | 0 (0.0%) | 0 (0.0%) |
| 12:00 PM to 3:59 PM | 0 (0.0%) | 0 (0.0%) |
| 4:00 PM to 11:59 PM | 3 (27.3%) | 0 (0.0%) |
| Total | 11 (100.0%) | 4 (100.0%) |
Housing Occupancy in Edgewood
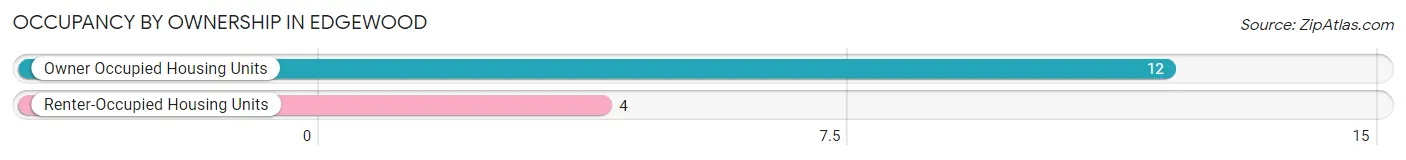
Occupancy by Ownership in Edgewood
Of the total 16 dwellings in Edgewood, owner-occupied units account for 12 (75.0%), while renter-occupied units make up 4 (25.0%).
| Occupancy | # Housing Units | % Housing Units |
| Owner Occupied Housing Units | 12 | 75.0% |
| Renter-Occupied Housing Units | 4 | 25.0% |
| Total Occupied Housing Units | 16 | 100.0% |
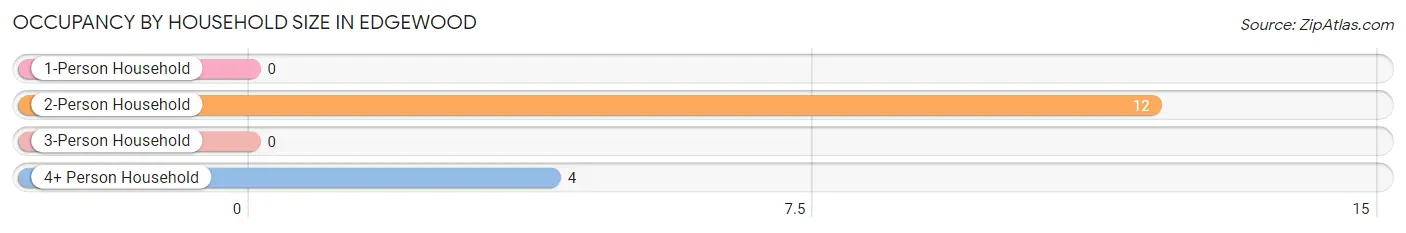
Occupancy by Household Size in Edgewood
| Household Size | # Housing Units | % Housing Units |
| 1-Person Household | 0 | 0.0% |
| 2-Person Household | 12 | 75.0% |
| 3-Person Household | 0 | 0.0% |
| 4+ Person Household | 4 | 25.0% |
| Total Housing Units | 16 | 100.0% |
Occupancy by Ownership by Household Size in Edgewood
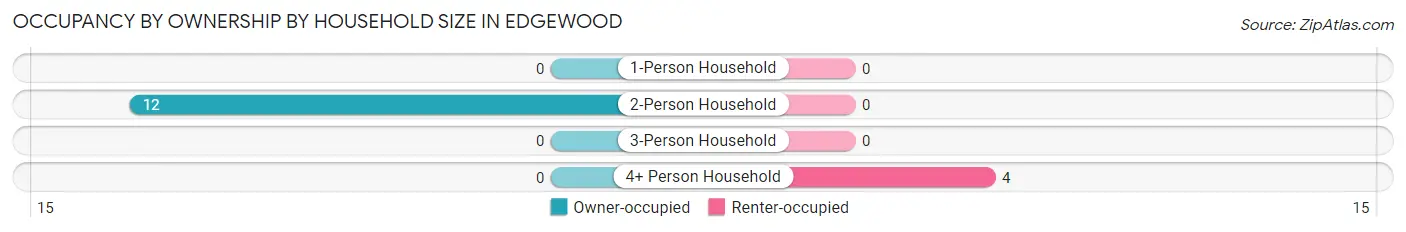
| Household Size | Owner-occupied | Renter-occupied |
| 1-Person Household | 0 (0.0%) | 0 (0.0%) |
| 2-Person Household | 12 (100.0%) | 0 (0.0%) |
| 3-Person Household | 0 (0.0%) | 0 (0.0%) |
| 4+ Person Household | 0 (0.0%) | 4 (100.0%) |
| Total Housing Units | 12 (75.0%) | 4 (25.0%) |
Occupancy by Educational Attainment in Edgewood
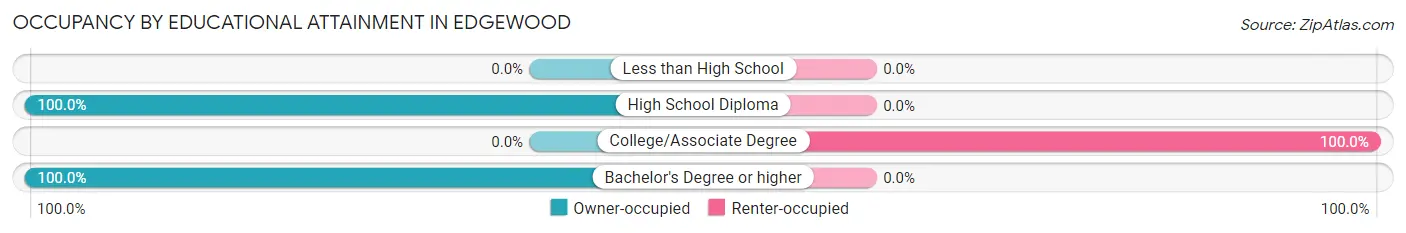
| Household Size | Owner-occupied | Renter-occupied |
| Less than High School | 0 (0.0%) | 0 (0.0%) |
| High School Diploma | 8 (100.0%) | 0 (0.0%) |
| College/Associate Degree | 0 (0.0%) | 4 (100.0%) |
| Bachelor's Degree or higher | 4 (100.0%) | 0 (0.0%) |
Occupancy by Age of Householder in Edgewood
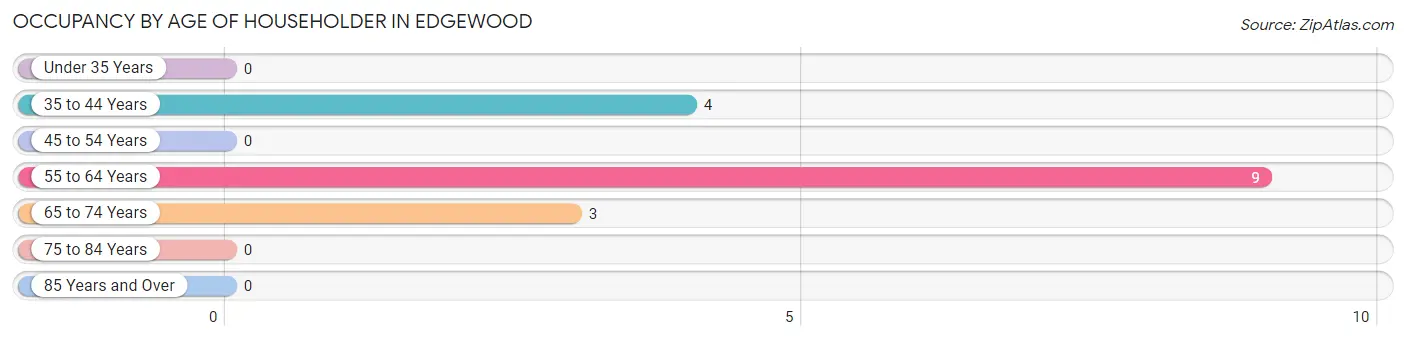
| Age Bracket | # Households | % Households |
| Under 35 Years | 0 | 0.0% |
| 35 to 44 Years | 4 | 25.0% |
| 45 to 54 Years | 0 | 0.0% |
| 55 to 64 Years | 9 | 56.2% |
| 65 to 74 Years | 3 | 18.8% |
| 75 to 84 Years | 0 | 0.0% |
| 85 Years and Over | 0 | 0.0% |
| Total | 16 | 100.0% |
Housing Finances in Edgewood
Median Income by Occupancy in Edgewood
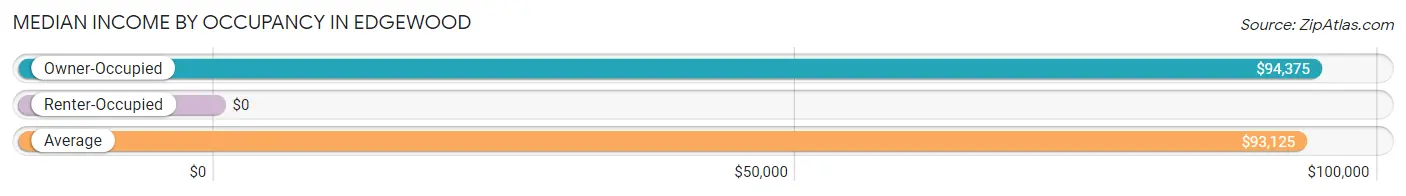
| Occupancy Type | # Households | Median Income |
| Owner-Occupied | 12 (75.0%) | $94,375 |
| Renter-Occupied | 4 (25.0%) | $0 |
| Average | 16 (100.0%) | $93,125 |
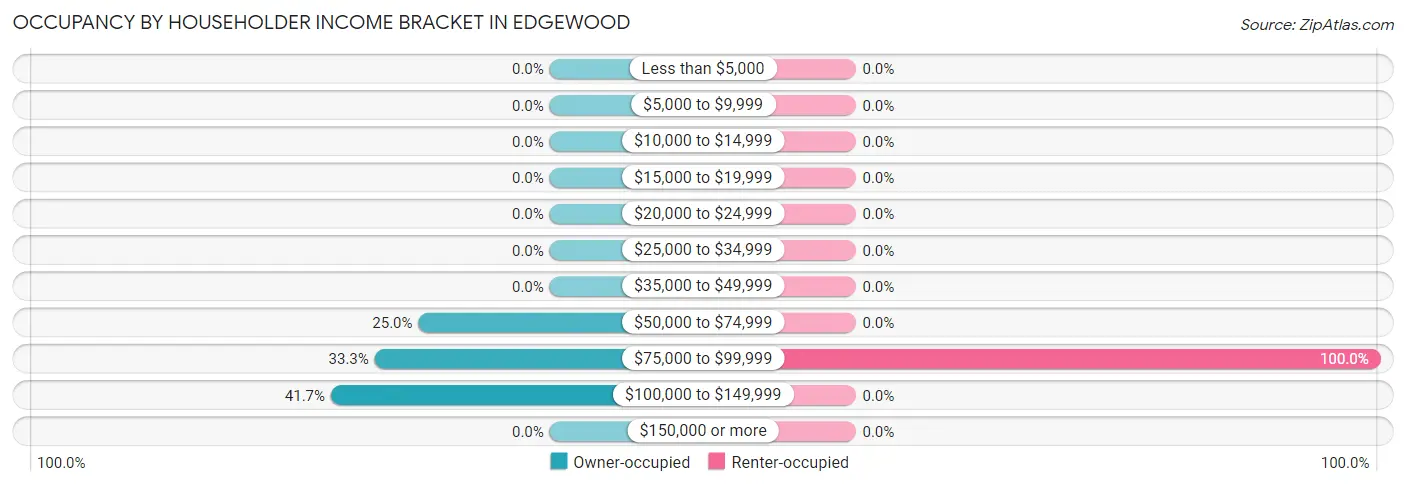
Occupancy by Householder Income Bracket in Edgewood
| Income Bracket | Owner-occupied | Renter-occupied |
| Less than $5,000 | 0 (0.0%) | 0 (0.0%) |
| $5,000 to $9,999 | 0 (0.0%) | 0 (0.0%) |
| $10,000 to $14,999 | 0 (0.0%) | 0 (0.0%) |
| $15,000 to $19,999 | 0 (0.0%) | 0 (0.0%) |
| $20,000 to $24,999 | 0 (0.0%) | 0 (0.0%) |
| $25,000 to $34,999 | 0 (0.0%) | 0 (0.0%) |
| $35,000 to $49,999 | 0 (0.0%) | 0 (0.0%) |
| $50,000 to $74,999 | 3 (25.0%) | 0 (0.0%) |
| $75,000 to $99,999 | 4 (33.3%) | 4 (100.0%) |
| $100,000 to $149,999 | 5 (41.7%) | 0 (0.0%) |
| $150,000 or more | 0 (0.0%) | 0 (0.0%) |
| Total | 12 (100.0%) | 4 (100.0%) |
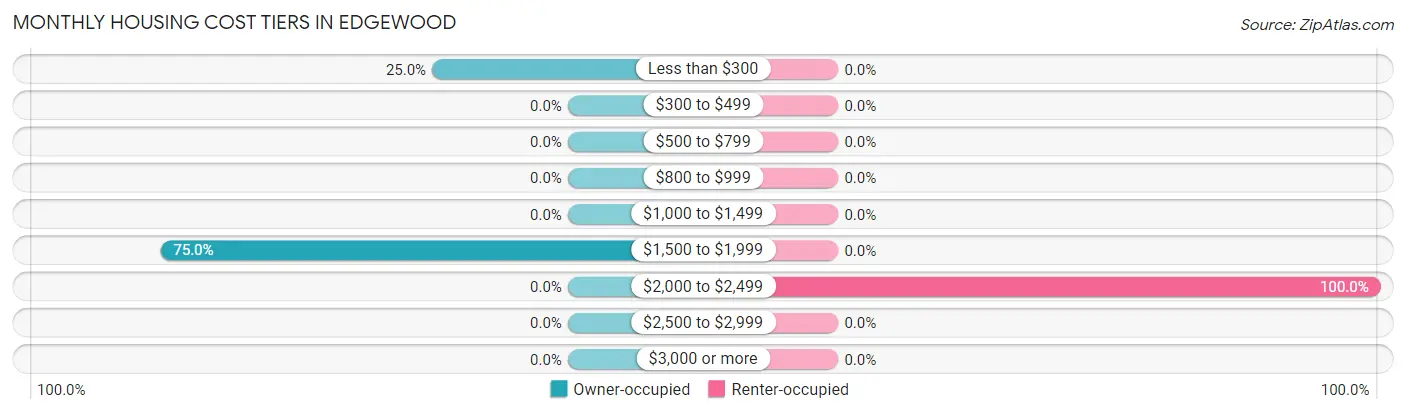
Monthly Housing Cost Tiers in Edgewood
| Monthly Cost | Owner-occupied | Renter-occupied |
| Less than $300 | 3 (25.0%) | 0 (0.0%) |
| $300 to $499 | 0 (0.0%) | 0 (0.0%) |
| $500 to $799 | 0 (0.0%) | 0 (0.0%) |
| $800 to $999 | 0 (0.0%) | 0 (0.0%) |
| $1,000 to $1,499 | 0 (0.0%) | 0 (0.0%) |
| $1,500 to $1,999 | 9 (75.0%) | 0 (0.0%) |
| $2,000 to $2,499 | 0 (0.0%) | 4 (100.0%) |
| $2,500 to $2,999 | 0 (0.0%) | 0 (0.0%) |
| $3,000 or more | 0 (0.0%) | 0 (0.0%) |
| Total | 12 (100.0%) | 4 (100.0%) |
Physical Housing Characteristics in Edgewood
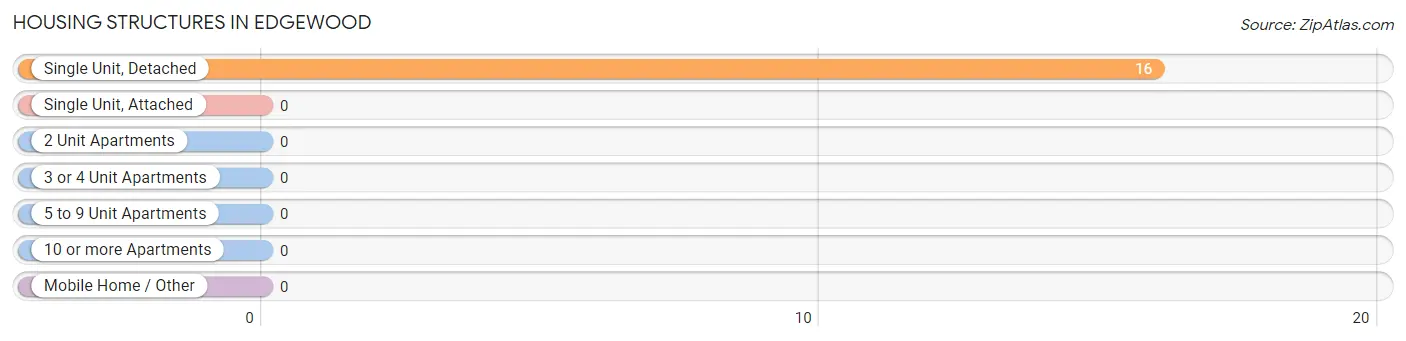
Housing Structures in Edgewood
| Structure Type | # Housing Units | % Housing Units |
| Single Unit, Detached | 16 | 100.0% |
| Single Unit, Attached | 0 | 0.0% |
| 2 Unit Apartments | 0 | 0.0% |
| 3 or 4 Unit Apartments | 0 | 0.0% |
| 5 to 9 Unit Apartments | 0 | 0.0% |
| 10 or more Apartments | 0 | 0.0% |
| Mobile Home / Other | 0 | 0.0% |
| Total | 16 | 100.0% |
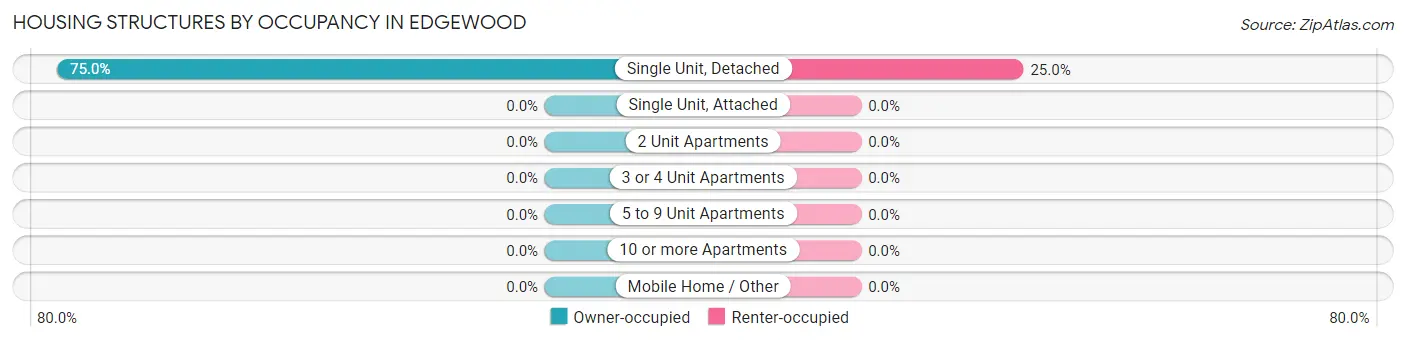
Housing Structures by Occupancy in Edgewood
| Structure Type | Owner-occupied | Renter-occupied |
| Single Unit, Detached | 12 (75.0%) | 4 (25.0%) |
| Single Unit, Attached | 0 (0.0%) | 0 (0.0%) |
| 2 Unit Apartments | 0 (0.0%) | 0 (0.0%) |
| 3 or 4 Unit Apartments | 0 (0.0%) | 0 (0.0%) |
| 5 to 9 Unit Apartments | 0 (0.0%) | 0 (0.0%) |
| 10 or more Apartments | 0 (0.0%) | 0 (0.0%) |
| Mobile Home / Other | 0 (0.0%) | 0 (0.0%) |
| Total | 12 (75.0%) | 4 (25.0%) |
Housing Structures by Number of Rooms in Edgewood
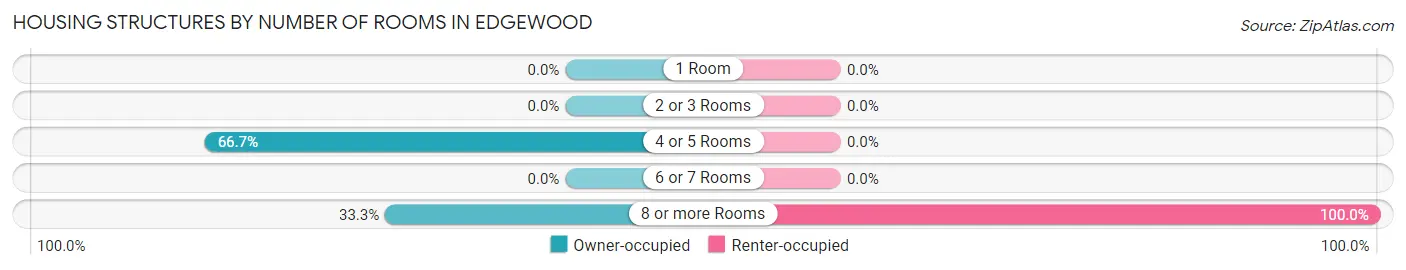
| Number of Rooms | Owner-occupied | Renter-occupied |
| 1 Room | 0 (0.0%) | 0 (0.0%) |
| 2 or 3 Rooms | 0 (0.0%) | 0 (0.0%) |
| 4 or 5 Rooms | 8 (66.7%) | 0 (0.0%) |
| 6 or 7 Rooms | 0 (0.0%) | 0 (0.0%) |
| 8 or more Rooms | 4 (33.3%) | 4 (100.0%) |
| Total | 12 (100.0%) | 4 (100.0%) |
Housing Structure by Heating Type in Edgewood
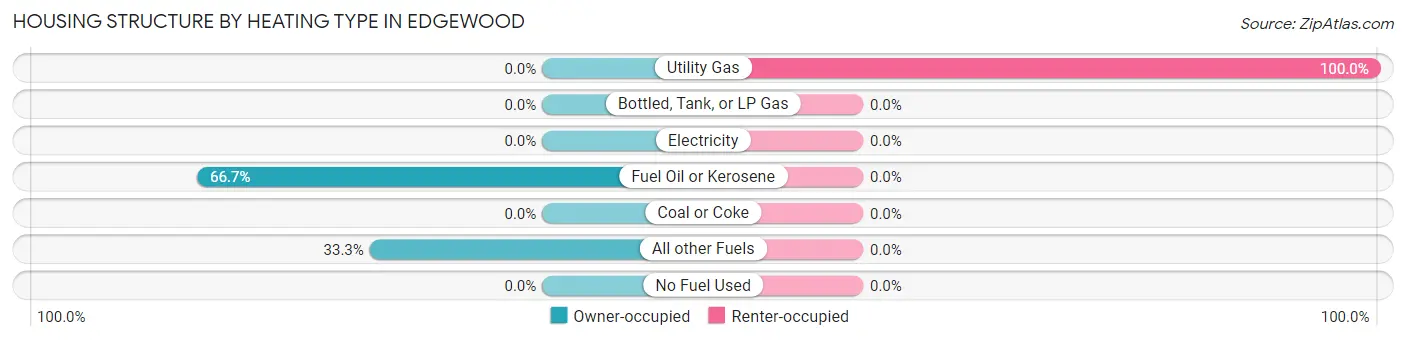
| Heating Type | Owner-occupied | Renter-occupied |
| Utility Gas | 0 (0.0%) | 4 (100.0%) |
| Bottled, Tank, or LP Gas | 0 (0.0%) | 0 (0.0%) |
| Electricity | 0 (0.0%) | 0 (0.0%) |
| Fuel Oil or Kerosene | 8 (66.7%) | 0 (0.0%) |
| Coal or Coke | 0 (0.0%) | 0 (0.0%) |
| All other Fuels | 4 (33.3%) | 0 (0.0%) |
| No Fuel Used | 0 (0.0%) | 0 (0.0%) |
| Total | 12 (100.0%) | 4 (100.0%) |
Household Vehicle Usage in Edgewood
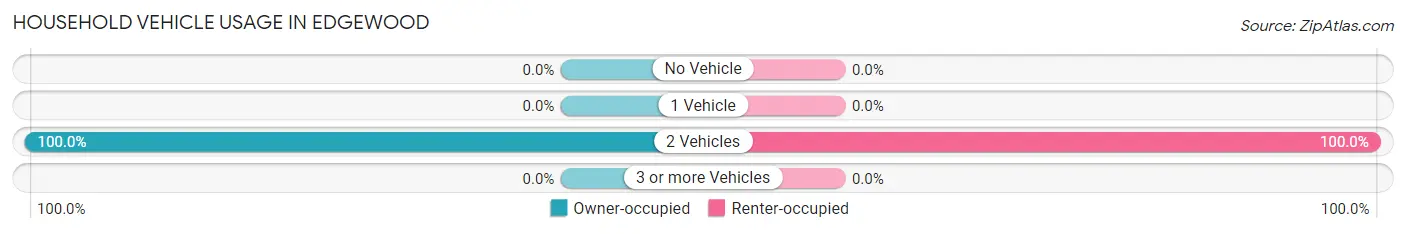
| Vehicles per Household | Owner-occupied | Renter-occupied |
| No Vehicle | 0 (0.0%) | 0 (0.0%) |
| 1 Vehicle | 0 (0.0%) | 0 (0.0%) |
| 2 Vehicles | 12 (100.0%) | 4 (100.0%) |
| 3 or more Vehicles | 0 (0.0%) | 0 (0.0%) |
| Total | 12 (100.0%) | 4 (100.0%) |
Real Estate & Mortgages in Edgewood
Real Estate and Mortgage Overview in Edgewood
| Characteristic | Without Mortgage | With Mortgage |
| Housing Units | 3 | 9 |
| Median Property Value | - | - |
| Median Household Income | - | - |
| Monthly Housing Costs | - | - |
| Real Estate Taxes | - | - |
Property Value by Mortgage Status in Edgewood
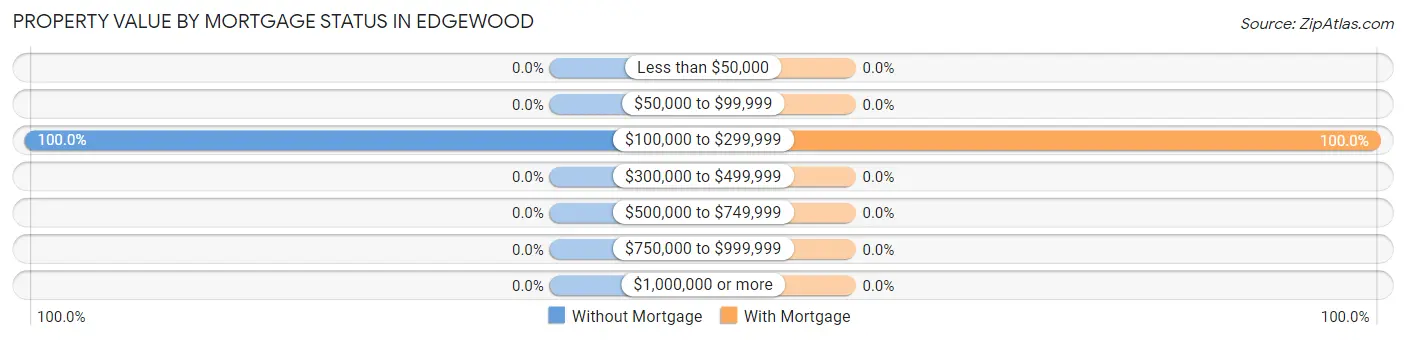
| Property Value | Without Mortgage | With Mortgage |
| Less than $50,000 | 0 (0.0%) | 0 (0.0%) |
| $50,000 to $99,999 | 0 (0.0%) | 0 (0.0%) |
| $100,000 to $299,999 | 3 (100.0%) | 9 (100.0%) |
| $300,000 to $499,999 | 0 (0.0%) | 0 (0.0%) |
| $500,000 to $749,999 | 0 (0.0%) | 0 (0.0%) |
| $750,000 to $999,999 | 0 (0.0%) | 0 (0.0%) |
| $1,000,000 or more | 0 (0.0%) | 0 (0.0%) |
| Total | 3 (100.0%) | 9 (100.0%) |
Household Income by Mortgage Status in Edgewood
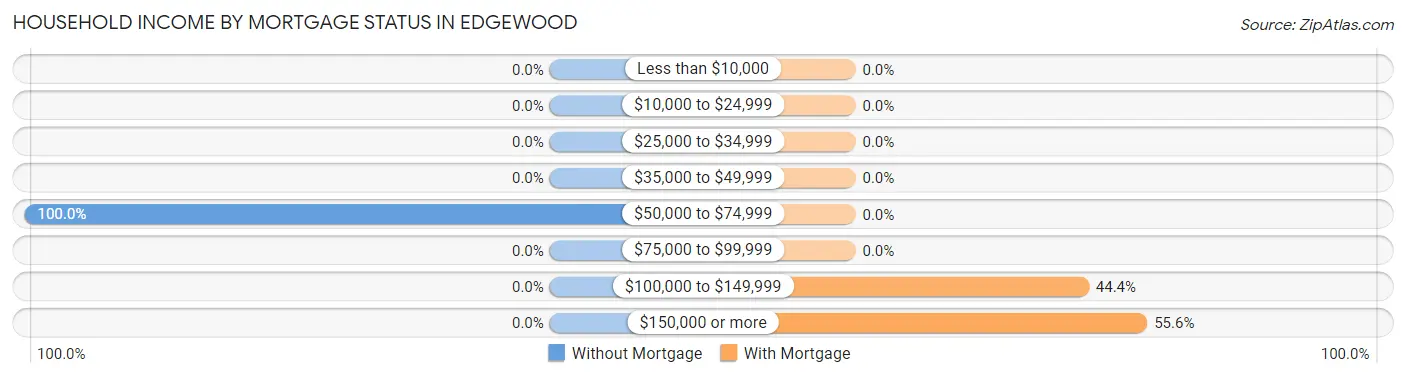
| Household Income | Without Mortgage | With Mortgage |
| Less than $10,000 | 0 (0.0%) | 0 (0.0%) |
| $10,000 to $24,999 | 0 (0.0%) | 0 (0.0%) |
| $25,000 to $34,999 | 0 (0.0%) | 0 (0.0%) |
| $35,000 to $49,999 | 0 (0.0%) | 0 (0.0%) |
| $50,000 to $74,999 | 3 (100.0%) | 0 (0.0%) |
| $75,000 to $99,999 | 0 (0.0%) | 0 (0.0%) |
| $100,000 to $149,999 | 0 (0.0%) | 4 (44.4%) |
| $150,000 or more | 0 (0.0%) | 5 (55.6%) |
| Total | 3 (100.0%) | 9 (100.0%) |
Property Value to Household Income Ratio in Edgewood
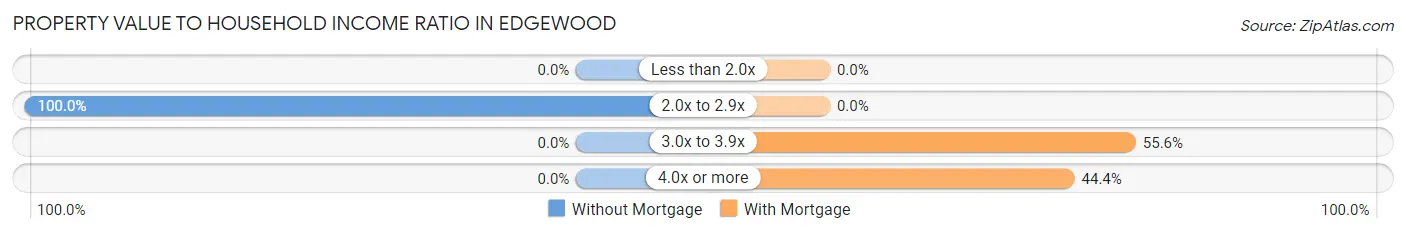
| Value-to-Income Ratio | Without Mortgage | With Mortgage |
| Less than 2.0x | 0 (0.0%) | 0 (0.0%) |
| 2.0x to 2.9x | 3 (100.0%) | 0 (0.0%) |
| 3.0x to 3.9x | 0 (0.0%) | 5 (55.6%) |
| 4.0x or more | 0 (0.0%) | 4 (44.4%) |
| Total | 3 (100.0%) | 9 (100.0%) |
Real Estate Taxes by Mortgage Status in Edgewood
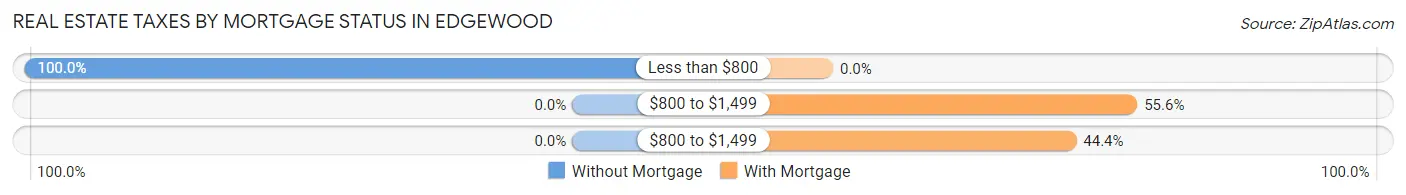
| Property Taxes | Without Mortgage | With Mortgage |
| Less than $800 | 3 (100.0%) | 0 (0.0%) |
| $800 to $1,499 | 0 (0.0%) | 5 (55.6%) |
| $800 to $1,499 | 0 (0.0%) | 4 (44.4%) |
| Total | 3 (100.0%) | 9 (100.0%) |
Health & Disability in Edgewood
Health Insurance Coverage by Age in Edgewood
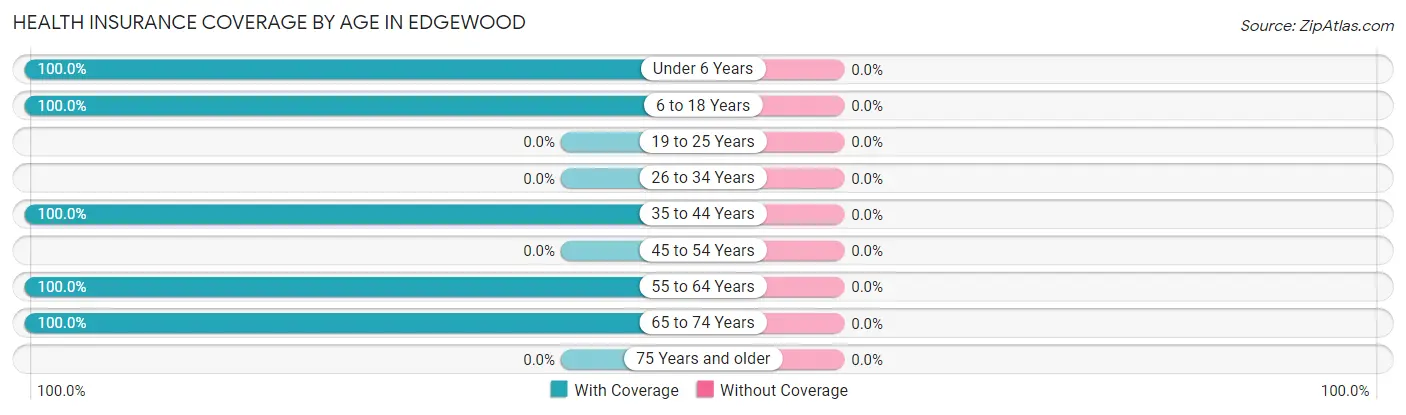
| Age Bracket | With Coverage | Without Coverage |
| Under 6 Years | 12 (100.0%) | 0 (0.0%) |
| 6 to 18 Years | 4 (100.0%) | 0 (0.0%) |
| 19 to 25 Years | 0 (0.0%) | 0 (0.0%) |
| 26 to 34 Years | 0 (0.0%) | 0 (0.0%) |
| 35 to 44 Years | 7 (100.0%) | 0 (0.0%) |
| 45 to 54 Years | 0 (0.0%) | 0 (0.0%) |
| 55 to 64 Years | 17 (100.0%) | 0 (0.0%) |
| 65 to 74 Years | 6 (100.0%) | 0 (0.0%) |
| 75 Years and older | 0 (0.0%) | 0 (0.0%) |
| Total | 46 (100.0%) | 0 (0.0%) |
Health Insurance Coverage by Citizenship Status in Edgewood
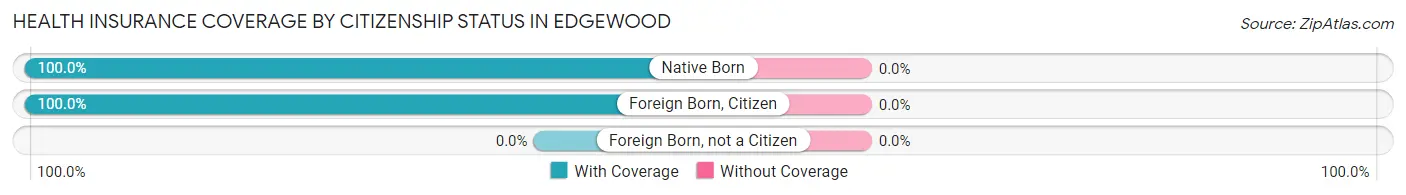
| Citizenship Status | With Coverage | Without Coverage |
| Native Born | 12 (100.0%) | 0 (0.0%) |
| Foreign Born, Citizen | 4 (100.0%) | 0 (0.0%) |
| Foreign Born, not a Citizen | 0 (0.0%) | 0 (0.0%) |
Health Insurance Coverage by Household Income in Edgewood
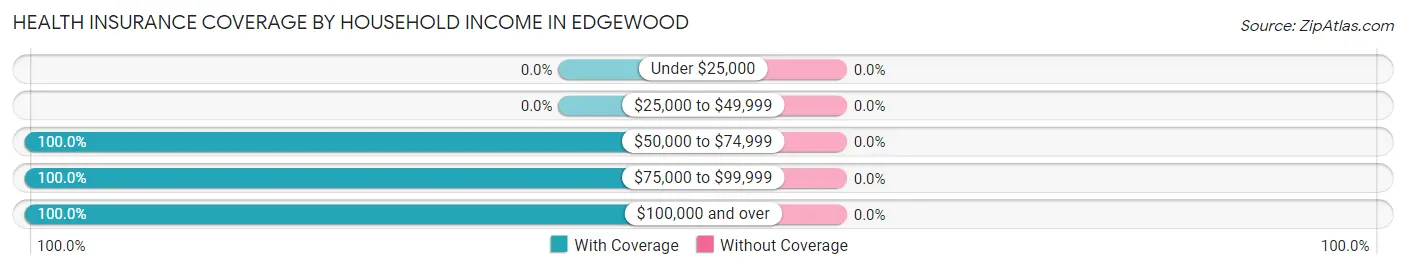
| Household Income | With Coverage | Without Coverage |
| Under $25,000 | 0 (0.0%) | 0 (0.0%) |
| $25,000 to $49,999 | 0 (0.0%) | 0 (0.0%) |
| $50,000 to $74,999 | 6 (100.0%) | 0 (0.0%) |
| $75,000 to $99,999 | 31 (100.0%) | 0 (0.0%) |
| $100,000 and over | 9 (100.0%) | 0 (0.0%) |
Public vs Private Health Insurance Coverage by Age in Edgewood
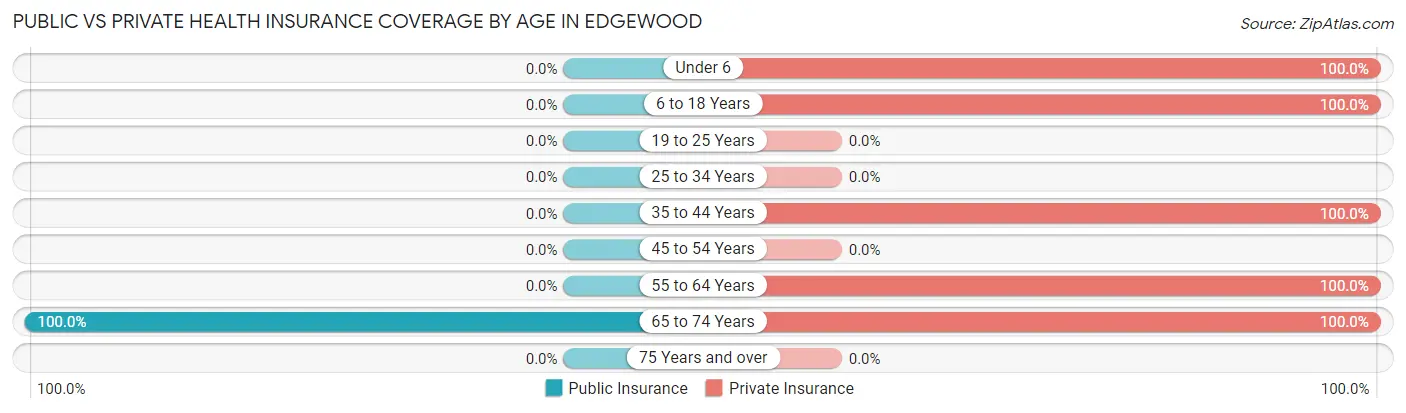
| Age Bracket | Public Insurance | Private Insurance |
| Under 6 | 0 (0.0%) | 12 (100.0%) |
| 6 to 18 Years | 0 (0.0%) | 4 (100.0%) |
| 19 to 25 Years | 0 (0.0%) | 0 (0.0%) |
| 25 to 34 Years | 0 (0.0%) | 0 (0.0%) |
| 35 to 44 Years | 0 (0.0%) | 7 (100.0%) |
| 45 to 54 Years | 0 (0.0%) | 0 (0.0%) |
| 55 to 64 Years | 0 (0.0%) | 17 (100.0%) |
| 65 to 74 Years | 6 (100.0%) | 6 (100.0%) |
| 75 Years and over | 0 (0.0%) | 0 (0.0%) |
| Total | 6 (13.0%) | 46 (100.0%) |
Disability Status by Sex by Age in Edgewood
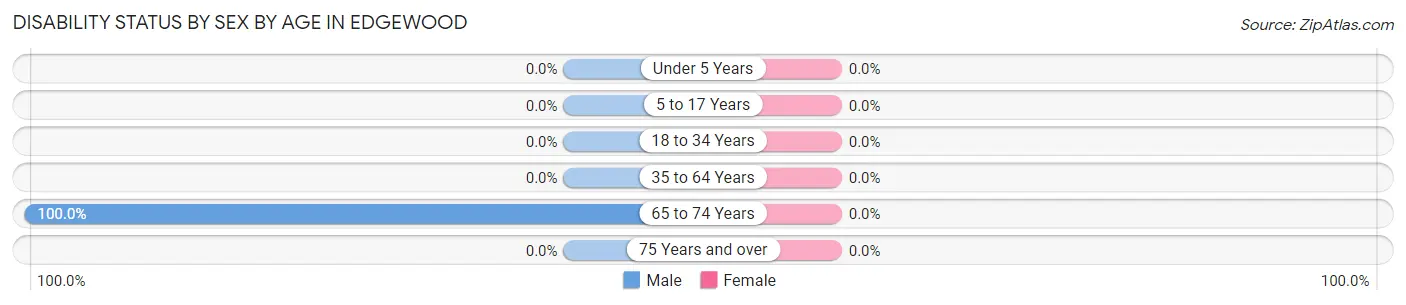
| Age Bracket | Male | Female |
| Under 5 Years | 0 (0.0%) | 0 (0.0%) |
| 5 to 17 Years | 0 (0.0%) | 0 (0.0%) |
| 18 to 34 Years | 0 (0.0%) | 0 (0.0%) |
| 35 to 64 Years | 0 (0.0%) | 0 (0.0%) |
| 65 to 74 Years | 3 (100.0%) | 0 (0.0%) |
| 75 Years and over | 0 (0.0%) | 0 (0.0%) |
Disability Class by Sex by Age in Edgewood
Disability Class: Hearing Difficulty
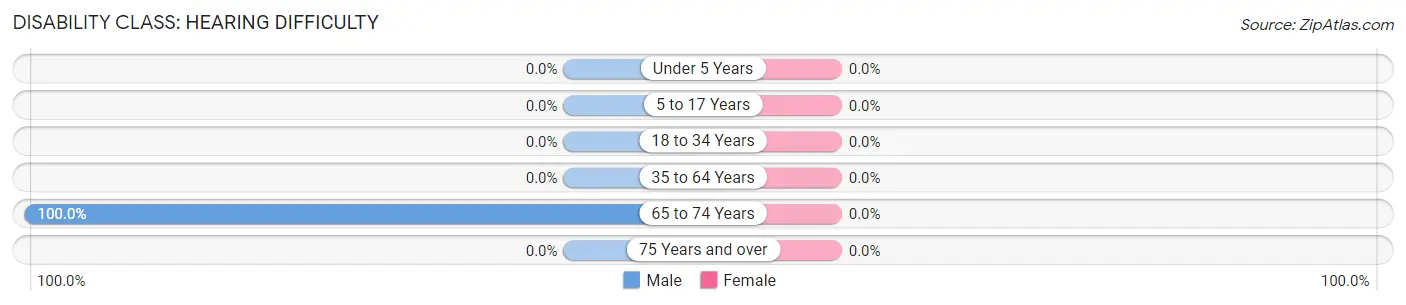
| Age Bracket | Male | Female |
| Under 5 Years | 0 (0.0%) | 0 (0.0%) |
| 5 to 17 Years | 0 (0.0%) | 0 (0.0%) |
| 18 to 34 Years | 0 (0.0%) | 0 (0.0%) |
| 35 to 64 Years | 0 (0.0%) | 0 (0.0%) |
| 65 to 74 Years | 3 (100.0%) | 0 (0.0%) |
| 75 Years and over | 0 (0.0%) | 0 (0.0%) |
Disability Class: Vision Difficulty
| Age Bracket | Male | Female |
| Under 5 Years | 0 (0.0%) | 0 (0.0%) |
| 5 to 17 Years | 0 (0.0%) | 0 (0.0%) |
| 18 to 34 Years | 0 (0.0%) | 0 (0.0%) |
| 35 to 64 Years | 0 (0.0%) | 0 (0.0%) |
| 65 to 74 Years | 0 (0.0%) | 0 (0.0%) |
| 75 Years and over | 0 (0.0%) | 0 (0.0%) |
Disability Class: Cognitive Difficulty
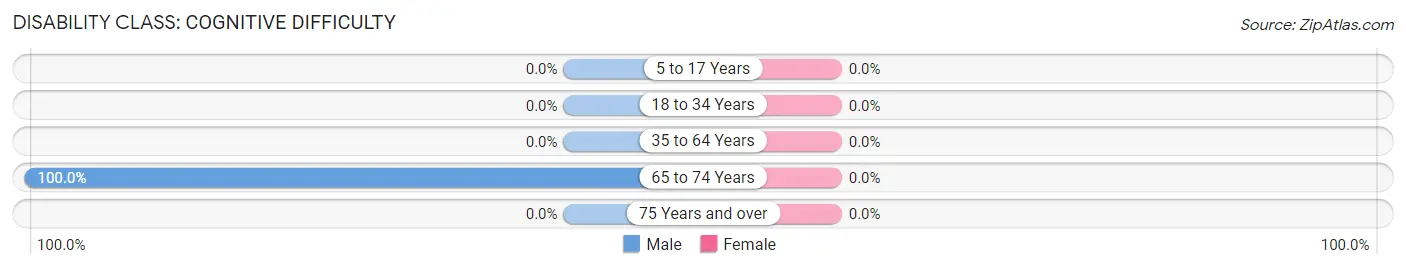
| Age Bracket | Male | Female |
| 5 to 17 Years | 0 (0.0%) | 0 (0.0%) |
| 18 to 34 Years | 0 (0.0%) | 0 (0.0%) |
| 35 to 64 Years | 0 (0.0%) | 0 (0.0%) |
| 65 to 74 Years | 3 (100.0%) | 0 (0.0%) |
| 75 Years and over | 0 (0.0%) | 0 (0.0%) |
Disability Class: Ambulatory Difficulty

| Age Bracket | Male | Female |
| 5 to 17 Years | 0 (0.0%) | 0 (0.0%) |
| 18 to 34 Years | 0 (0.0%) | 0 (0.0%) |
| 35 to 64 Years | 0 (0.0%) | 0 (0.0%) |
| 65 to 74 Years | 3 (100.0%) | 0 (0.0%) |
| 75 Years and over | 0 (0.0%) | 0 (0.0%) |
Disability Class: Self-Care Difficulty

| Age Bracket | Male | Female |
| 5 to 17 Years | 0 (0.0%) | 0 (0.0%) |
| 18 to 34 Years | 0 (0.0%) | 0 (0.0%) |
| 35 to 64 Years | 0 (0.0%) | 0 (0.0%) |
| 65 to 74 Years | 3 (100.0%) | 0 (0.0%) |
| 75 Years and over | 0 (0.0%) | 0 (0.0%) |
Technology Access in Edgewood
Computing Device Access in Edgewood
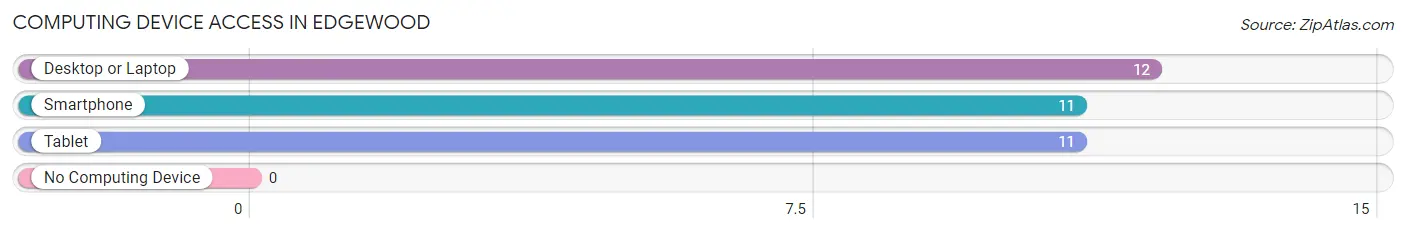
| Device Type | # Households | % Households |
| Desktop or Laptop | 12 | 75.0% |
| Smartphone | 11 | 68.8% |
| Tablet | 11 | 68.8% |
| No Computing Device | 0 | 0.0% |
| Total | 16 | 100.0% |
Internet Access in Edgewood
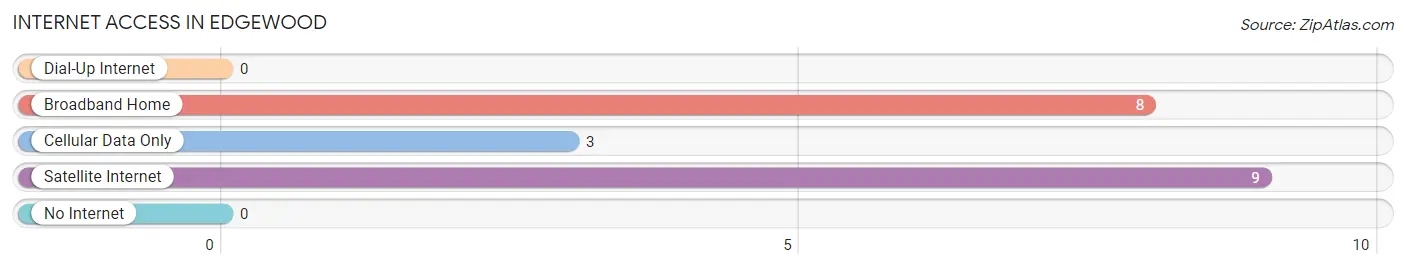
| Internet Type | # Households | % Households |
| Dial-Up Internet | 0 | 0.0% |
| Broadband Home | 8 | 50.0% |
| Cellular Data Only | 3 | 18.8% |
| Satellite Internet | 9 | 56.2% |
| No Internet | 0 | 0.0% |
| Total | 16 | 100.0% |
Edgewood Summary
Edgewood is a small unincorporated community located in the San Bernardino Mountains of San Bernardino County, California. It is situated at an elevation of 6,000 feet (1,829 m) above sea level. The population of Edgewood was estimated to be around 1,000 in 2000.
History
Edgewood was founded in the late 1800s by a group of settlers who were looking for a place to homestead. The area was originally known as “The Edgewood Ranch” and was used for cattle grazing and timber harvesting. In the early 1900s, the area was developed into a resort community and was known as “The Edgewood Resort”. The resort was popular with tourists and locals alike and was a popular destination for fishing, hunting, and camping.
In the 1950s, the resort was sold and the area was developed into a residential community. The community was named Edgewood and was incorporated in 1959. The town was known for its small-town charm and was a popular destination for weekend getaways.
Geography
Edgewood is located in the San Bernardino Mountains of San Bernardino County, California. It is situated at an elevation of 6,000 feet (1,829 m) above sea level. The area is surrounded by the San Bernardino National Forest and is home to a variety of wildlife, including deer, bears, and mountain lions.
The climate in Edgewood is generally mild, with temperatures ranging from the mid-30s in the winter to the mid-80s in the summer. The area receives an average of 20 inches of precipitation per year, with most of it falling in the winter months.
Economy
The economy of Edgewood is largely based on tourism and recreation. The area is home to several resorts and campgrounds, as well as a variety of outdoor activities such as hiking, fishing, and camping. The area is also home to several small businesses, including restaurants, shops, and galleries.
Demographics
As of the 2000 census, the population of Edgewood was estimated to be around 1,000. The racial makeup of the town was 94.7% White, 0.7% African American, 0.3% Native American, 0.3% Asian, 0.1% Pacific Islander, 0.7% from other races, and 3.0% from two or more races. The median household income was $37,500 and the median family income was $41,250. The per capita income was $19,890.
Conclusion
Edgewood is a small unincorporated community located in the San Bernardino Mountains of San Bernardino County, California. It is situated at an elevation of 6,000 feet (1,829 m) above sea level and has a population of around 1,000. The economy of Edgewood is largely based on tourism and recreation, and the area is home to several resorts and campgrounds, as well as a variety of outdoor activities. The racial makeup of the town is 94.7% White, 0.7% African American, 0.3% Native American, 0.3% Asian, 0.1% Pacific Islander, 0.7% from other races, and 3.0% from two or more races. The median household income was $37,500 and the median family income was $41,250.
Common Questions
What is Per Capita Income in Edgewood?
Per Capita income in Edgewood is $27,348.
What is the Median Family Income in Edgewood?
Median Family Income in Edgewood is $93,125.
What is the Median Household income in Edgewood?
Median Household Income in Edgewood is $93,125.
What is Inequality or Gini Index in Edgewood?
Inequality or Gini Index in Edgewood is 0.11.
What is the Total Population of Edgewood?
Total Population of Edgewood is 46.
What is the Total Male Population of Edgewood?
Total Male Population of Edgewood is 14.
What is the Total Female Population of Edgewood?
Total Female Population of Edgewood is 32.
What is the Ratio of Males per 100 Females in Edgewood?
There are 43.75 Males per 100 Females in Edgewood.
What is the Ratio of Females per 100 Males in Edgewood?
There are 228.57 Females per 100 Males in Edgewood.
What is the Median Population Age in Edgewood?
Median Population Age in Edgewood is 50.0 Years.
What is the Average Family Size in Edgewood
Average Family Size in Edgewood is 2.9 People.
What is the Average Household Size in Edgewood
Average Household Size in Edgewood is 2.9 People.
How Large is the Labor Force in Edgewood?
There are 18 People in the Labor Forcein in Edgewood.
What is the Percentage of People in the Labor Force in Edgewood?
60.0% of People are in the Labor Force in Edgewood.