Camanche North Shore, CA Map & Demographics
Camanche North Shore Map
Camanche North Shore Overview
$24,123
PER CAPITA INCOME
$56,250
AVG FAMILY INCOME
$48,974
AVG HOUSEHOLD INCOME
62.4%
WAGE / INCOME GAP [ % ]
37.6¢/ $1
WAGE / INCOME GAP [ $ ]
0.44
INEQUALITY / GINI INDEX
1,106
TOTAL POPULATION
509
MALE POPULATION
597
FEMALE POPULATION
85.26
MALES / 100 FEMALES
117.29
FEMALES / 100 MALES
39.9
MEDIAN AGE
3.5
AVG FAMILY SIZE
2.8
AVG HOUSEHOLD SIZE
351
LABOR FORCE [ PEOPLE ]
38.3%
PERCENT IN LABOR FORCE
7.4%
UNEMPLOYMENT RATE
Income in Camanche North Shore
Income Overview in Camanche North Shore
Per Capita Income in Camanche North Shore is $24,123, while median incomes of families and households are $56,250 and $48,974 respectively.
| Characteristic | Number | Measure |
| Per Capita Income | 1,106 | $24,123 |
| Median Family Income | 251 | $56,250 |
| Mean Family Income | 251 | $65,319 |
| Median Household Income | 402 | $48,974 |
| Mean Household Income | 402 | $59,504 |
| Income Deficit | 251 | $0 |
| Wage / Income Gap (%) | 1,106 | 62.39% |
| Wage / Income Gap ($) | 1,106 | 37.61¢ per $1 |
| Gini / Inequality Index | 1,106 | 0.44 |
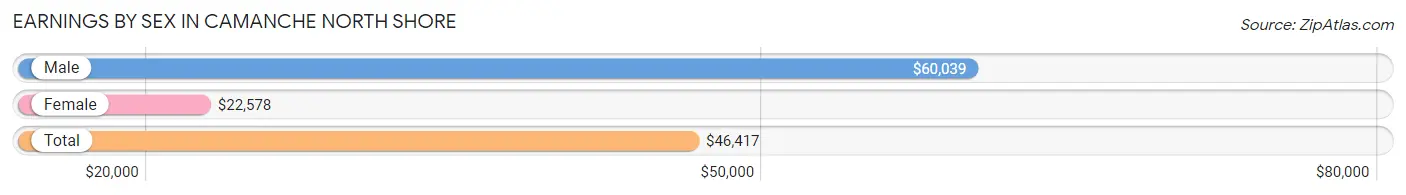
Earnings by Sex in Camanche North Shore
Average Earnings in Camanche North Shore are $46,417, $60,039 for men and $22,578 for women, a difference of 62.4%.
| Sex | Number | Average Earnings |
| Male | 205 (59.9%) | $60,039 |
| Female | 137 (40.1%) | $22,578 |
| Total | 342 (100.0%) | $46,417 |
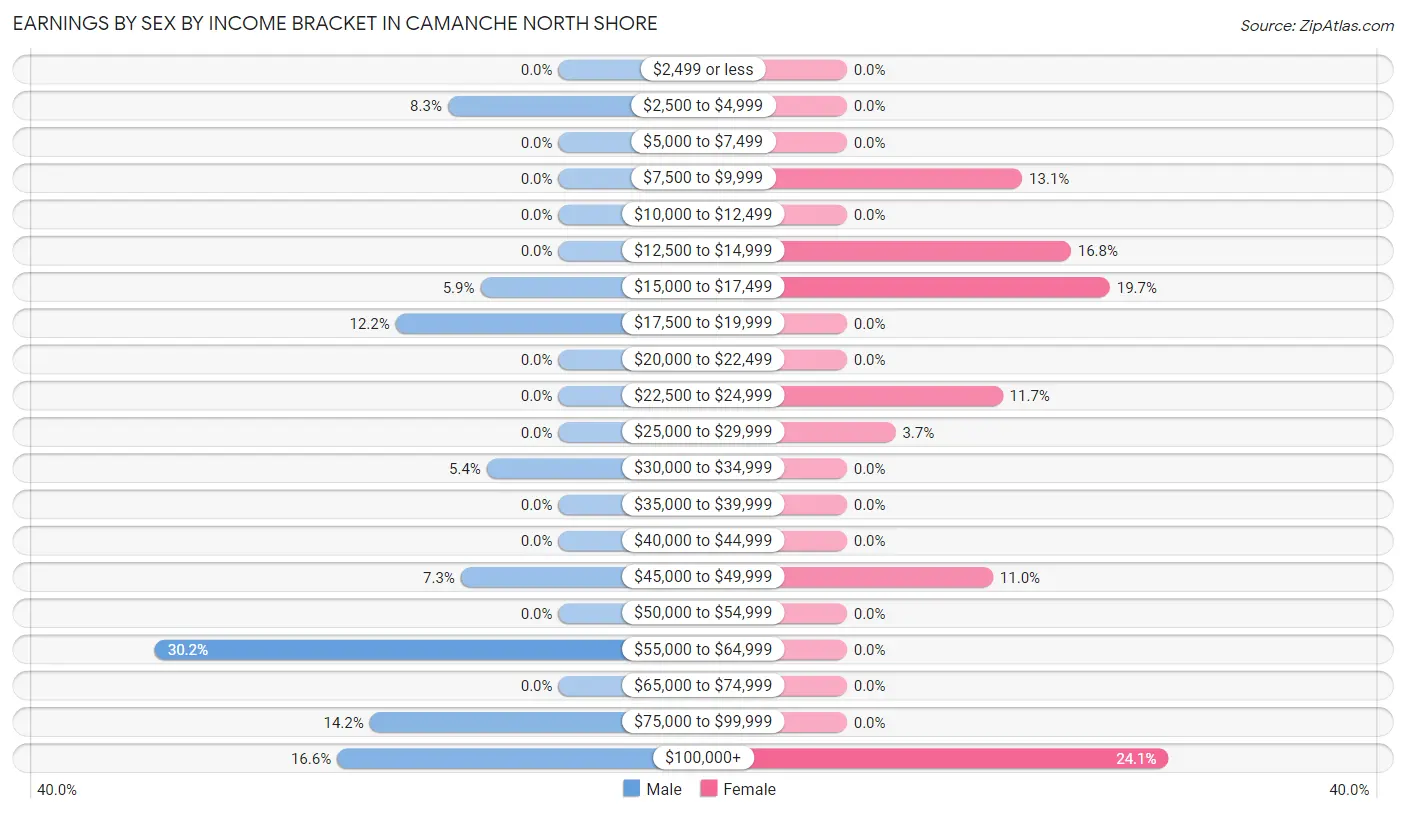
Earnings by Sex by Income Bracket in Camanche North Shore
The most common earnings brackets in Camanche North Shore are $55,000 to $64,999 for men (62 | 30.2%) and $100,000+ for women (33 | 24.1%).
| Income | Male | Female |
| $2,499 or less | 0 (0.0%) | 0 (0.0%) |
| $2,500 to $4,999 | 17 (8.3%) | 0 (0.0%) |
| $5,000 to $7,499 | 0 (0.0%) | 0 (0.0%) |
| $7,500 to $9,999 | 0 (0.0%) | 18 (13.1%) |
| $10,000 to $12,499 | 0 (0.0%) | 0 (0.0%) |
| $12,500 to $14,999 | 0 (0.0%) | 23 (16.8%) |
| $15,000 to $17,499 | 12 (5.9%) | 27 (19.7%) |
| $17,500 to $19,999 | 25 (12.2%) | 0 (0.0%) |
| $20,000 to $22,499 | 0 (0.0%) | 0 (0.0%) |
| $22,500 to $24,999 | 0 (0.0%) | 16 (11.7%) |
| $25,000 to $29,999 | 0 (0.0%) | 5 (3.6%) |
| $30,000 to $34,999 | 11 (5.4%) | 0 (0.0%) |
| $35,000 to $39,999 | 0 (0.0%) | 0 (0.0%) |
| $40,000 to $44,999 | 0 (0.0%) | 0 (0.0%) |
| $45,000 to $49,999 | 15 (7.3%) | 15 (11.0%) |
| $50,000 to $54,999 | 0 (0.0%) | 0 (0.0%) |
| $55,000 to $64,999 | 62 (30.2%) | 0 (0.0%) |
| $65,000 to $74,999 | 0 (0.0%) | 0 (0.0%) |
| $75,000 to $99,999 | 29 (14.1%) | 0 (0.0%) |
| $100,000+ | 34 (16.6%) | 33 (24.1%) |
| Total | 205 (100.0%) | 137 (100.0%) |
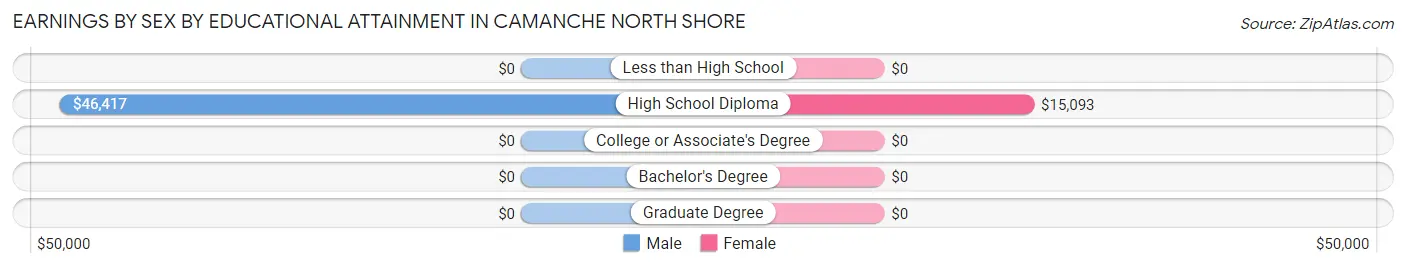
Earnings by Sex by Educational Attainment in Camanche North Shore
Average earnings in Camanche North Shore are $60,039 for men and $22,578 for women, a difference of 62.4%. Men with an educational attainment of high school diploma enjoy the highest average annual earnings of $46,417, while those with high school diploma education earn the least with $46,417. Women with an educational attainment of high school diploma earn the most with the average annual earnings of $15,093, while those with high school diploma education have the smallest earnings of $15,093.
| Educational Attainment | Male Income | Female Income |
| Less than High School | - | - |
| High School Diploma | $46,417 | $15,093 |
| College or Associate's Degree | - | - |
| Bachelor's Degree | - | - |
| Graduate Degree | - | - |
| Total | $60,039 | $22,578 |
Family Income in Camanche North Shore
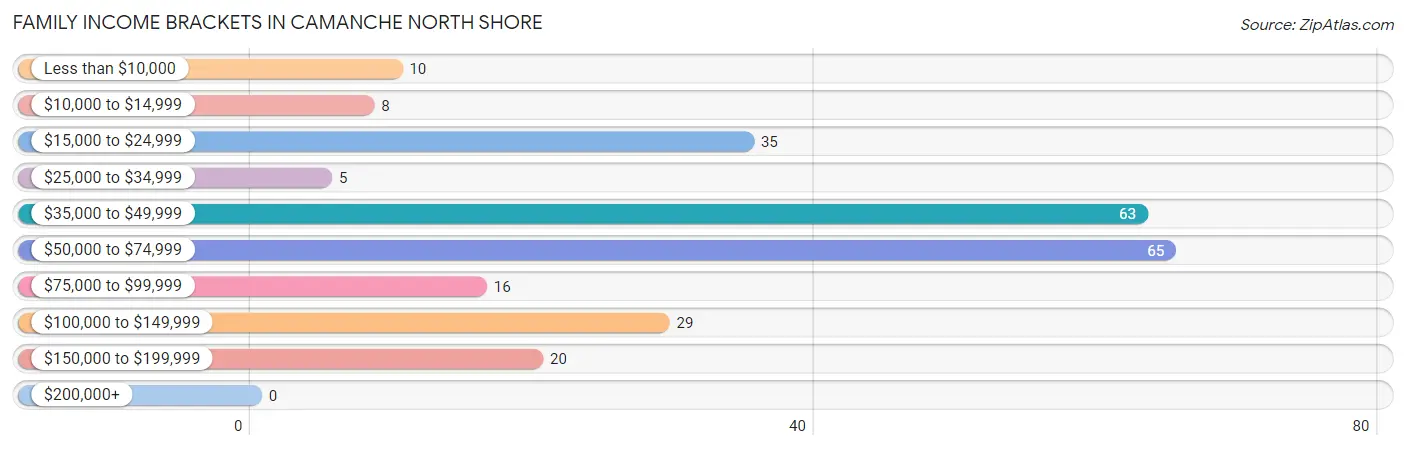
Family Income Brackets in Camanche North Shore
According to the Camanche North Shore family income data, there are 65 families falling into the $50,000 to $74,999 income range, which is the most common income bracket and makes up 25.9% of all families.
| Income Bracket | # Families | % Families |
| Less than $10,000 | 10 | 4.0% |
| $10,000 to $14,999 | 8 | 3.2% |
| $15,000 to $24,999 | 35 | 13.9% |
| $25,000 to $34,999 | 5 | 2.0% |
| $35,000 to $49,999 | 63 | 25.1% |
| $50,000 to $74,999 | 65 | 25.9% |
| $75,000 to $99,999 | 16 | 6.4% |
| $100,000 to $149,999 | 29 | 11.6% |
| $150,000 to $199,999 | 20 | 8.0% |
| $200,000+ | 0 | 0.0% |
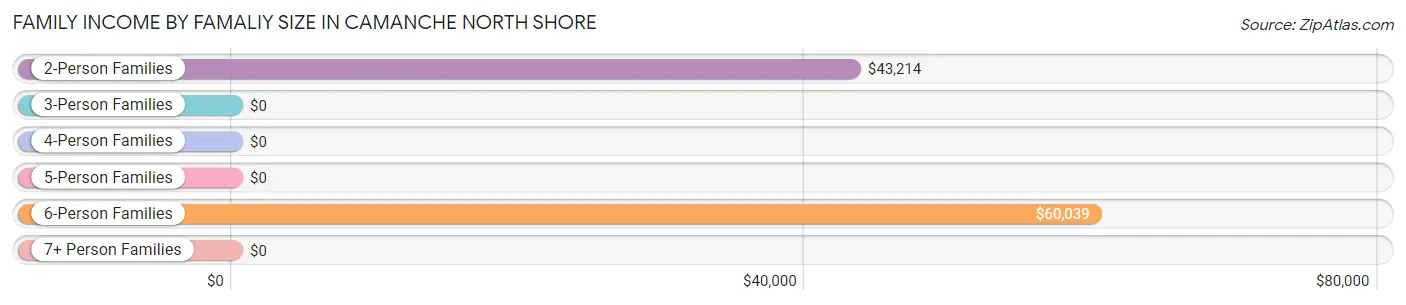
Family Income by Famaliy Size in Camanche North Shore
6-person families (63 | 25.1%) account for the highest median family income in Camanche North Shore with $60,039 per family, while 2-person families (124 | 49.4%) have the highest median income of $21,607 per family member.
| Income Bracket | # Families | Median Income |
| 2-Person Families | 124 (49.4%) | $43,214 |
| 3-Person Families | 44 (17.5%) | $0 |
| 4-Person Families | 20 (8.0%) | $0 |
| 5-Person Families | 0 (0.0%) | $0 |
| 6-Person Families | 63 (25.1%) | $60,039 |
| 7+ Person Families | 0 (0.0%) | $0 |
| Total | 251 (100.0%) | $56,250 |
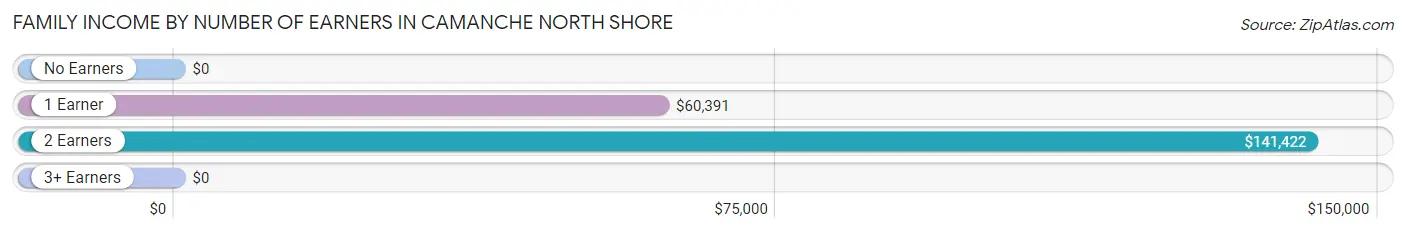
Family Income by Number of Earners in Camanche North Shore
| Number of Earners | # Families | Median Income |
| No Earners | 98 (39.0%) | $0 |
| 1 Earner | 88 (35.1%) | $60,391 |
| 2 Earners | 65 (25.9%) | $141,422 |
| 3+ Earners | 0 (0.0%) | $0 |
| Total | 251 (100.0%) | $56,250 |
Household Income in Camanche North Shore
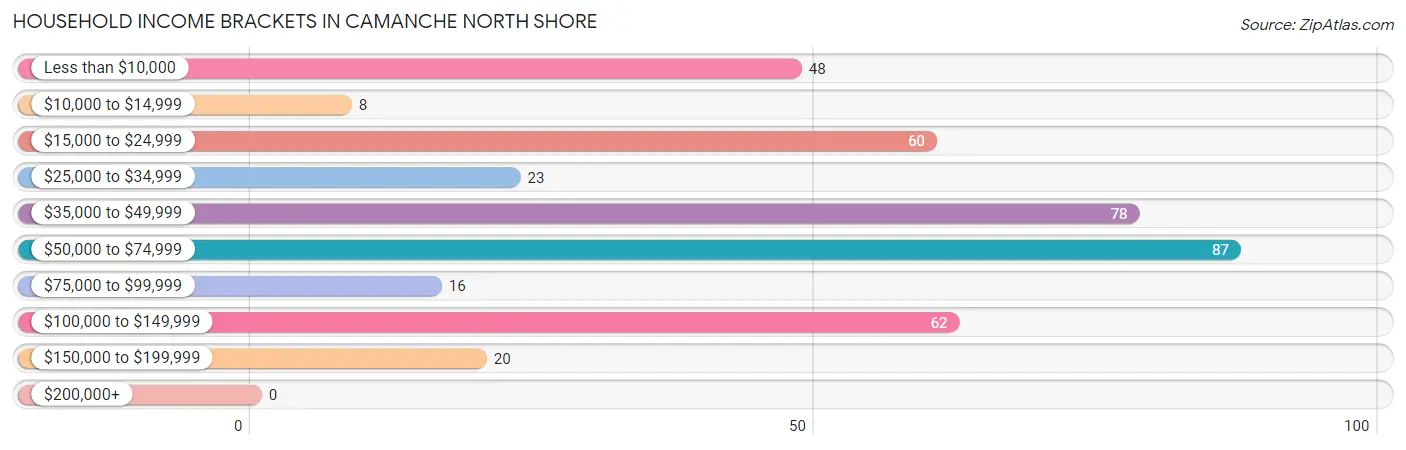
Household Income Brackets in Camanche North Shore
With 87 households falling in the category, the $50,000 to $74,999 income range is the most frequent in Camanche North Shore, accounting for 21.6% of all households.
| Income Bracket | # Households | % Households |
| Less than $10,000 | 48 | 11.9% |
| $10,000 to $14,999 | 8 | 2.0% |
| $15,000 to $24,999 | 60 | 14.9% |
| $25,000 to $34,999 | 23 | 5.7% |
| $35,000 to $49,999 | 78 | 19.4% |
| $50,000 to $74,999 | 87 | 21.6% |
| $75,000 to $99,999 | 16 | 4.0% |
| $100,000 to $149,999 | 62 | 15.4% |
| $150,000 to $199,999 | 20 | 5.0% |
| $200,000+ | 0 | 0.0% |
Household Income by Householder Age in Camanche North Shore
The median household income in Camanche North Shore is $48,974, with the highest median household income of $58,693 found in the 25 to 44 years age bracket for the primary householder. A total of 121 households (30.1%) fall into this category.
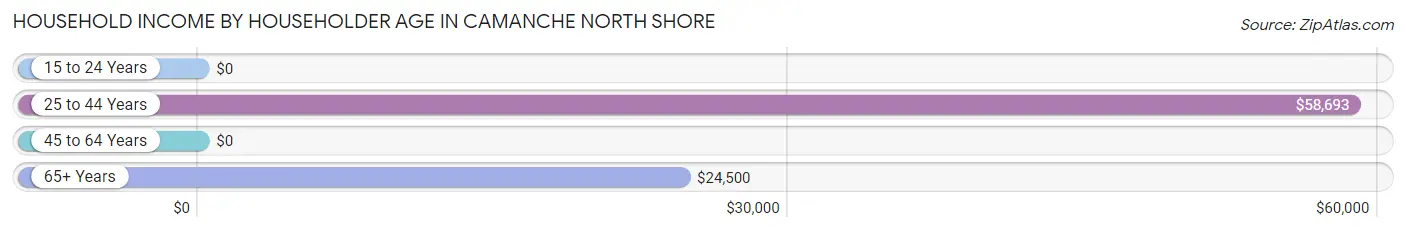
| Income Bracket | # Households | Median Income |
| 15 to 24 Years | 0 (0.0%) | $0 |
| 25 to 44 Years | 121 (30.1%) | $58,693 |
| 45 to 64 Years | 199 (49.5%) | $0 |
| 65+ Years | 82 (20.4%) | $24,500 |
| Total | 402 (100.0%) | $48,974 |
Poverty in Camanche North Shore
Income Below Poverty by Sex and Age in Camanche North Shore
With 18.9% poverty level for males and 13.6% for females among the residents of Camanche North Shore, 6 to 11 year old males and 65 to 74 year old females are the most vulnerable to poverty, with 10 males (100.0%) and 15 females (71.4%) in their respective age groups living below the poverty level.
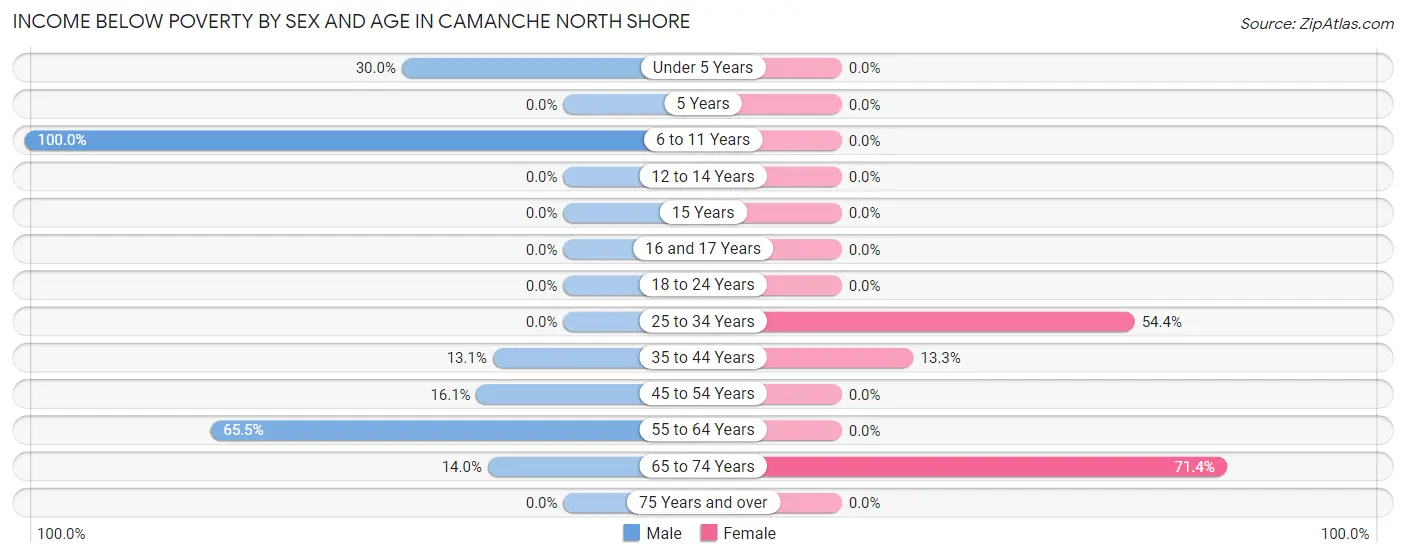
| Age Bracket | Male | Female |
| Under 5 Years | 9 (30.0%) | 0 (0.0%) |
| 5 Years | 0 (0.0%) | 0 (0.0%) |
| 6 to 11 Years | 10 (100.0%) | 0 (0.0%) |
| 12 to 14 Years | 0 (0.0%) | 0 (0.0%) |
| 15 Years | 0 (0.0%) | 0 (0.0%) |
| 16 and 17 Years | 0 (0.0%) | 0 (0.0%) |
| 18 to 24 Years | 0 (0.0%) | 0 (0.0%) |
| 25 to 34 Years | 0 (0.0%) | 56 (54.4%) |
| 35 to 44 Years | 16 (13.1%) | 10 (13.3%) |
| 45 to 54 Years | 15 (16.1%) | 0 (0.0%) |
| 55 to 64 Years | 38 (65.5%) | 0 (0.0%) |
| 65 to 74 Years | 8 (14.0%) | 15 (71.4%) |
| 75 Years and over | 0 (0.0%) | 0 (0.0%) |
| Total | 96 (18.9%) | 81 (13.6%) |
Income Above Poverty by Sex and Age in Camanche North Shore
According to the poverty statistics in Camanche North Shore, males aged 12 to 14 years and females aged under 5 years are the age groups that are most secure financially, with 100.0% of males and 100.0% of females in these age groups living above the poverty line.
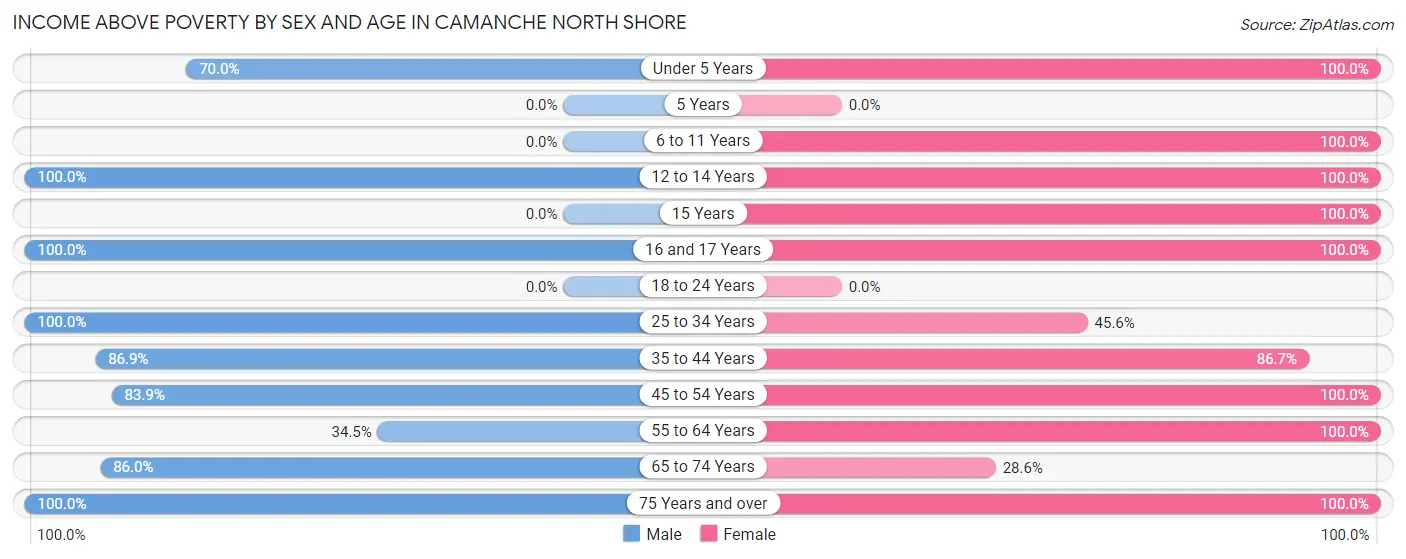
| Age Bracket | Male | Female |
| Under 5 Years | 21 (70.0%) | 13 (100.0%) |
| 5 Years | 0 (0.0%) | 0 (0.0%) |
| 6 to 11 Years | 0 (0.0%) | 50 (100.0%) |
| 12 to 14 Years | 46 (100.0%) | 7 (100.0%) |
| 15 Years | 0 (0.0%) | 34 (100.0%) |
| 16 and 17 Years | 18 (100.0%) | 29 (100.0%) |
| 18 to 24 Years | 0 (0.0%) | 0 (0.0%) |
| 25 to 34 Years | 53 (100.0%) | 47 (45.6%) |
| 35 to 44 Years | 106 (86.9%) | 65 (86.7%) |
| 45 to 54 Years | 78 (83.9%) | 39 (100.0%) |
| 55 to 64 Years | 20 (34.5%) | 136 (100.0%) |
| 65 to 74 Years | 49 (86.0%) | 6 (28.6%) |
| 75 Years and over | 22 (100.0%) | 90 (100.0%) |
| Total | 413 (81.1%) | 516 (86.4%) |
Income Below Poverty Among Married-Couple Families in Camanche North Shore
The poverty statistics for married-couple families in Camanche North Shore show that 4.4% or 8 of the total 182 families live below the poverty line. Families with no children have the highest poverty rate of 6.1%, comprising of 8 families. On the other hand, families with 1 or 2 children have the lowest poverty rate of 0.0%, which includes 0 families.
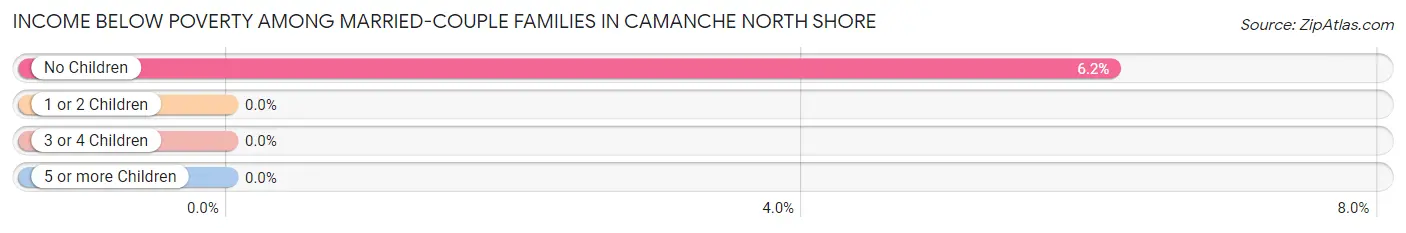
| Children | Above Poverty | Below Poverty |
| No Children | 122 (93.9%) | 8 (6.1%) |
| 1 or 2 Children | 20 (100.0%) | 0 (0.0%) |
| 3 or 4 Children | 32 (100.0%) | 0 (0.0%) |
| 5 or more Children | 0 (0.0%) | 0 (0.0%) |
| Total | 174 (95.6%) | 8 (4.4%) |
Income Below Poverty Among Single-Parent Households in Camanche North Shore
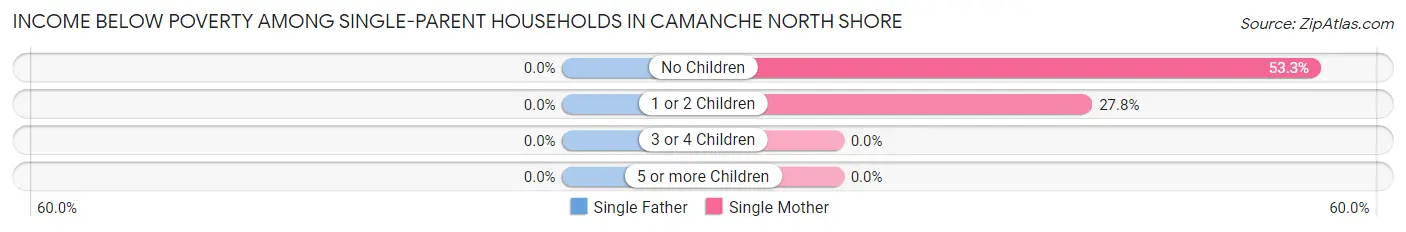
| Children | Single Father | Single Mother |
| No Children | 0 (0.0%) | 8 (53.3%) |
| 1 or 2 Children | 0 (0.0%) | 10 (27.8%) |
| 3 or 4 Children | 0 (0.0%) | 0 (0.0%) |
| 5 or more Children | 0 (0.0%) | 0 (0.0%) |
| Total | 0 (0.0%) | 18 (29.5%) |
Income Below Poverty Among Married-Couple vs Single-Parent Households in Camanche North Shore
The poverty data for Camanche North Shore shows that 8 of the married-couple family households (4.4%) and 18 of the single-parent households (26.1%) are living below the poverty level. Within the married-couple family households, those with no children have the highest poverty rate, with 8 households (6.1%) falling below the poverty line. Among the single-parent households, those with no children have the highest poverty rate, with 8 household (34.8%) living below poverty.
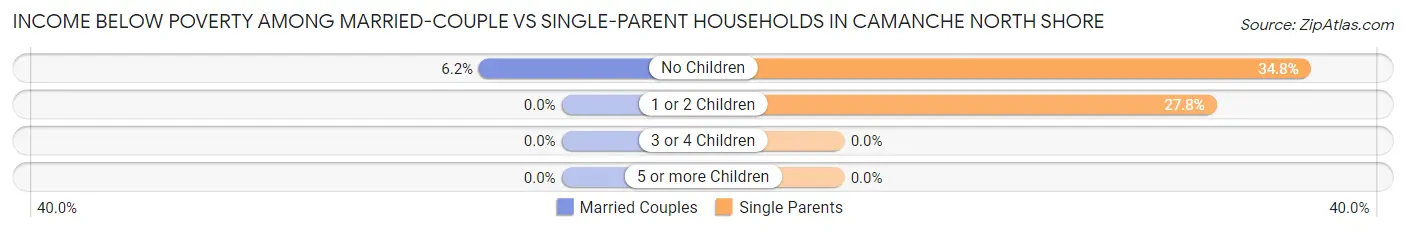
| Children | Married-Couple Families | Single-Parent Households |
| No Children | 8 (6.1%) | 8 (34.8%) |
| 1 or 2 Children | 0 (0.0%) | 10 (27.8%) |
| 3 or 4 Children | 0 (0.0%) | 0 (0.0%) |
| 5 or more Children | 0 (0.0%) | 0 (0.0%) |
| Total | 8 (4.4%) | 18 (26.1%) |
Race in Camanche North Shore
The most populous races in Camanche North Shore are White / Caucasian (1,002 | 90.6%), Hispanic or Latino (59 | 5.3%), and Two or more Races (40 | 3.6%).
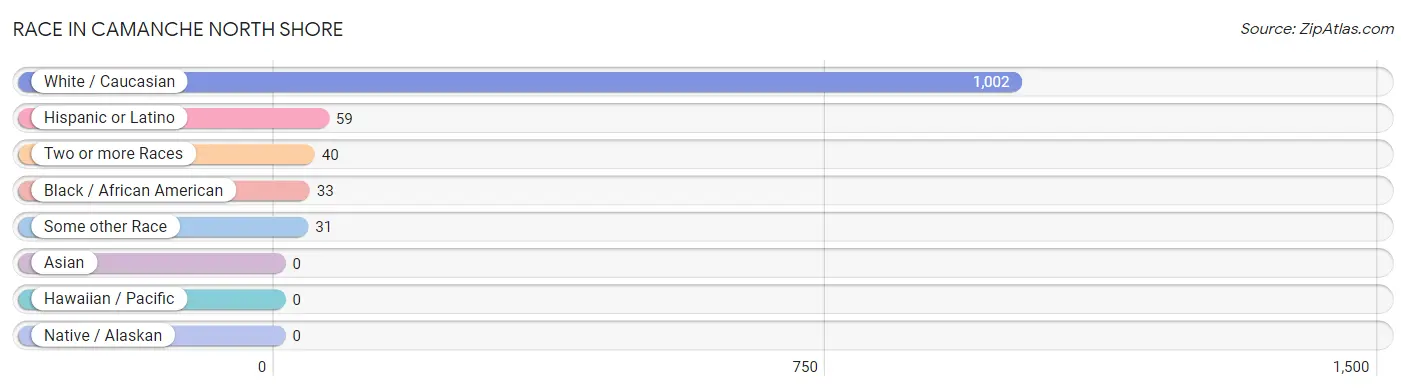
| Race | # Population | % Population |
| Asian | 0 | 0.0% |
| Black / African American | 33 | 3.0% |
| Hawaiian / Pacific | 0 | 0.0% |
| Hispanic or Latino | 59 | 5.3% |
| Native / Alaskan | 0 | 0.0% |
| White / Caucasian | 1,002 | 90.6% |
| Two or more Races | 40 | 3.6% |
| Some other Race | 31 | 2.8% |
| Total | 1,106 | 100.0% |
Ancestry in Camanche North Shore
The most populous ancestries reported in Camanche North Shore are German (170 | 15.4%), European (116 | 10.5%), Greek (48 | 4.3%), American (44 | 4.0%), and Italian (44 | 4.0%), together accounting for 38.2% of all Camanche North Shore residents.
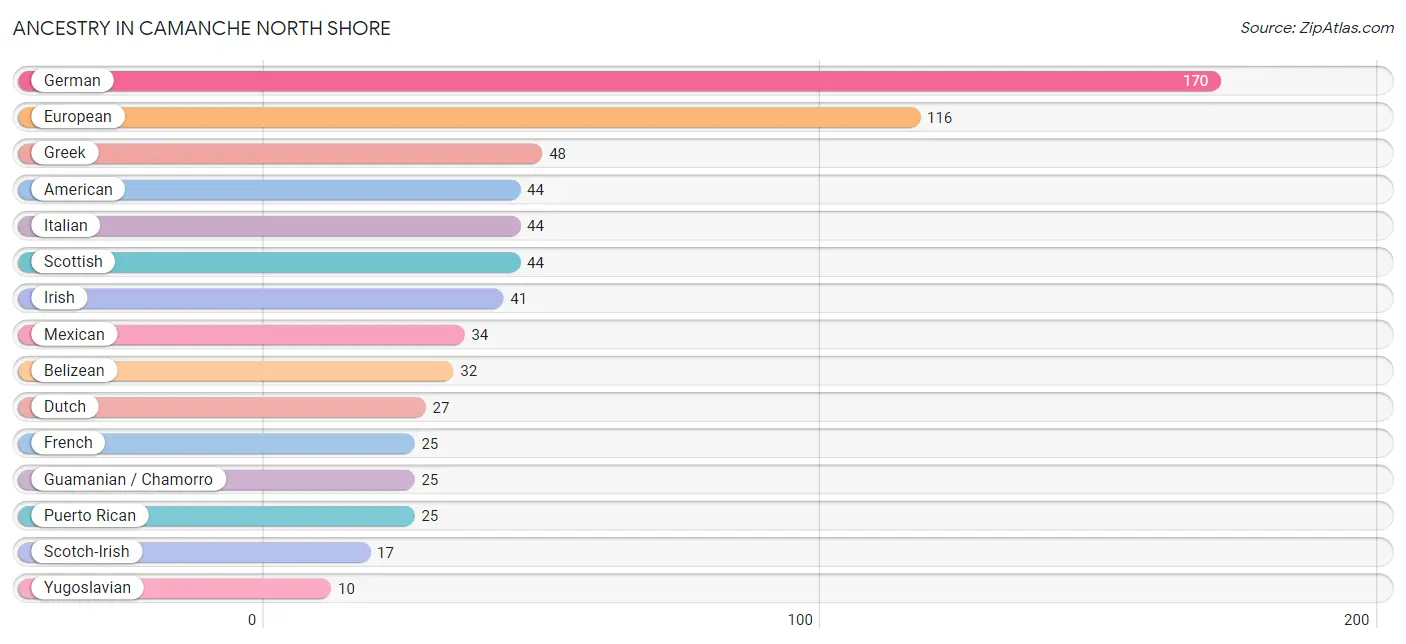
| Ancestry | # Population | % Population |
| American | 44 | 4.0% |
| Belizean | 32 | 2.9% |
| Danish | 9 | 0.8% |
| Dutch | 27 | 2.4% |
| European | 116 | 10.5% |
| Finnish | 7 | 0.6% |
| French | 25 | 2.3% |
| German | 170 | 15.4% |
| Greek | 48 | 4.3% |
| Guamanian / Chamorro | 25 | 2.3% |
| Irish | 41 | 3.7% |
| Italian | 44 | 4.0% |
| Mexican | 34 | 3.1% |
| Puerto Rican | 25 | 2.3% |
| Scotch-Irish | 17 | 1.5% |
| Scottish | 44 | 4.0% |
| Swedish | 8 | 0.7% |
| Yugoslavian | 10 | 0.9% | View All 18 Rows |
Immigrants in Camanche North Shore
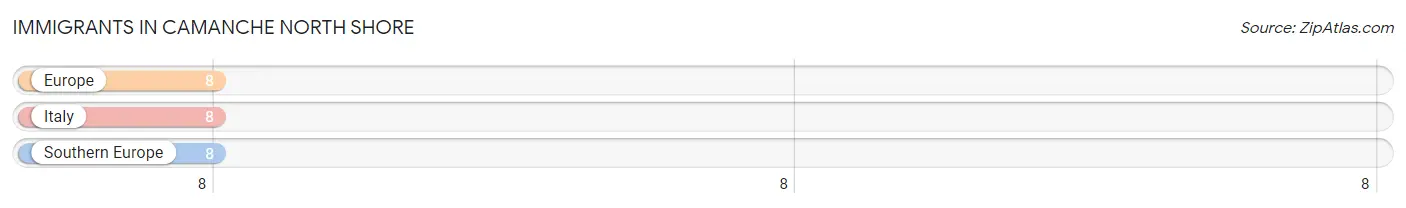
The most numerous immigrant groups reported in Camanche North Shore came from Europe (8 | 0.7%), Italy (8 | 0.7%), and Southern Europe (8 | 0.7%), together accounting for 2.2% of all Camanche North Shore residents.
| Immigration Origin | # Population | % Population |
| Europe | 8 | 0.7% |
| Italy | 8 | 0.7% |
| Southern Europe | 8 | 0.7% | View All 3 Rows |
Sex and Age in Camanche North Shore
Sex and Age in Camanche North Shore
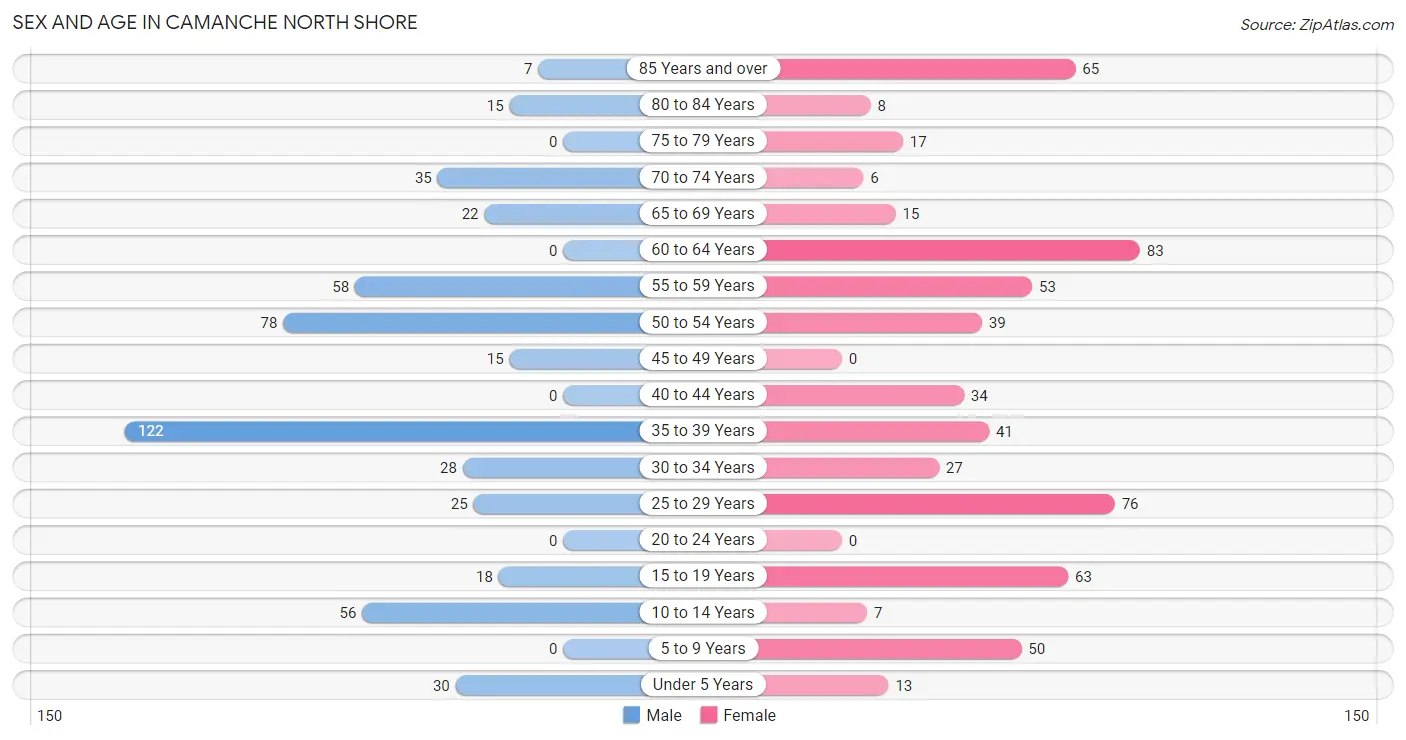
The most populous age groups in Camanche North Shore are 35 to 39 Years (122 | 24.0%) for men and 60 to 64 Years (83 | 13.9%) for women.
| Age Bracket | Male | Female |
| Under 5 Years | 30 (5.9%) | 13 (2.2%) |
| 5 to 9 Years | 0 (0.0%) | 50 (8.4%) |
| 10 to 14 Years | 56 (11.0%) | 7 (1.2%) |
| 15 to 19 Years | 18 (3.5%) | 63 (10.5%) |
| 20 to 24 Years | 0 (0.0%) | 0 (0.0%) |
| 25 to 29 Years | 25 (4.9%) | 76 (12.7%) |
| 30 to 34 Years | 28 (5.5%) | 27 (4.5%) |
| 35 to 39 Years | 122 (24.0%) | 41 (6.9%) |
| 40 to 44 Years | 0 (0.0%) | 34 (5.7%) |
| 45 to 49 Years | 15 (2.9%) | 0 (0.0%) |
| 50 to 54 Years | 78 (15.3%) | 39 (6.5%) |
| 55 to 59 Years | 58 (11.4%) | 53 (8.9%) |
| 60 to 64 Years | 0 (0.0%) | 83 (13.9%) |
| 65 to 69 Years | 22 (4.3%) | 15 (2.5%) |
| 70 to 74 Years | 35 (6.9%) | 6 (1.0%) |
| 75 to 79 Years | 0 (0.0%) | 17 (2.9%) |
| 80 to 84 Years | 15 (2.9%) | 8 (1.3%) |
| 85 Years and over | 7 (1.4%) | 65 (10.9%) |
| Total | 509 (100.0%) | 597 (100.0%) |
Families and Households in Camanche North Shore
Median Family Size in Camanche North Shore
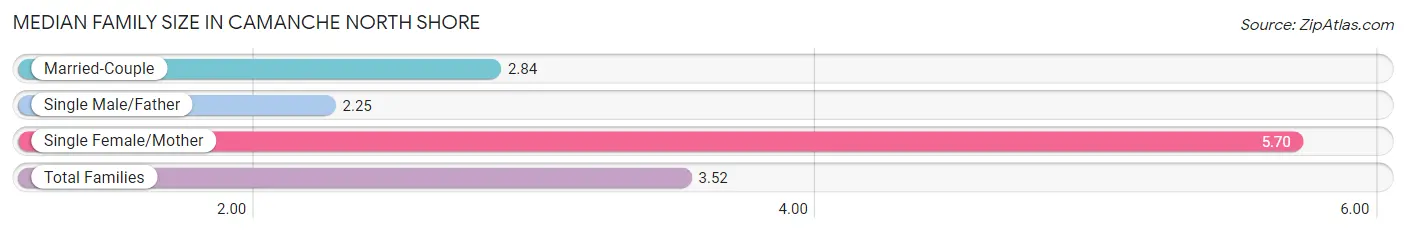
The median family size in Camanche North Shore is 3.52 persons per family, with single female/mother families (61 | 24.3%) accounting for the largest median family size of 5.7 persons per family. On the other hand, single male/father families (8 | 3.2%) represent the smallest median family size with 2.25 persons per family.
| Family Type | # Families | Family Size |
| Married-Couple | 182 (72.5%) | 2.84 |
| Single Male/Father | 8 (3.2%) | 2.25 |
| Single Female/Mother | 61 (24.3%) | 5.70 |
| Total Families | 251 (100.0%) | 3.52 |
Median Household Size in Camanche North Shore
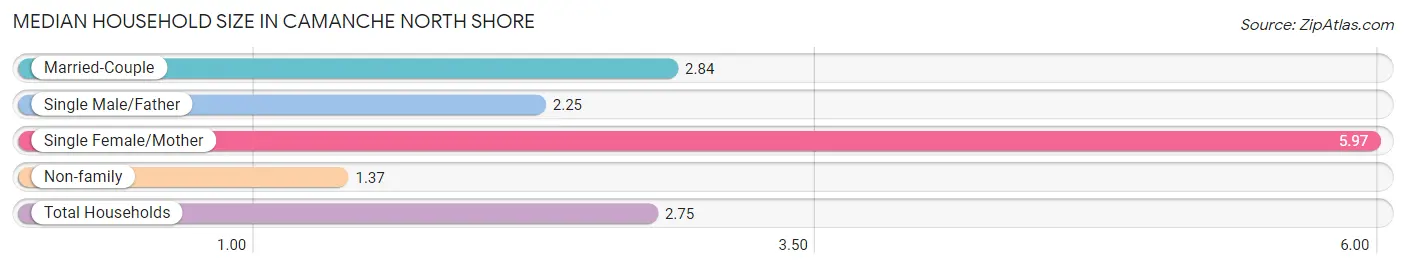
The median household size in Camanche North Shore is 2.75 persons per household, with single female/mother households (61 | 15.2%) accounting for the largest median household size of 5.97 persons per household. non-family households (151 | 37.6%) represent the smallest median household size with 1.37 persons per household.
| Household Type | # Households | Household Size |
| Married-Couple | 182 (45.3%) | 2.84 |
| Single Male/Father | 8 (2.0%) | 2.25 |
| Single Female/Mother | 61 (15.2%) | 5.97 |
| Non-family | 151 (37.6%) | 1.37 |
| Total Households | 402 (100.0%) | 2.75 |
Household Size by Marriage Status in Camanche North Shore
Out of a total of 402 households in Camanche North Shore, 251 (62.4%) are family households, while 151 (37.6%) are nonfamily households. The most numerous type of family households are 2-person households, comprising 124, and the most common type of nonfamily households are 1-person households, comprising 126.
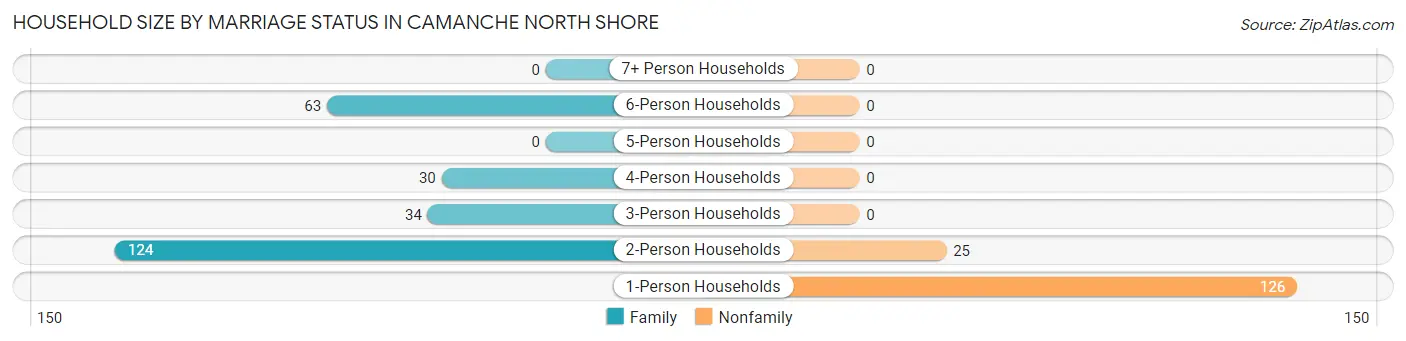
| Household Size | Family Households | Nonfamily Households |
| 1-Person Households | - | 126 (31.3%) |
| 2-Person Households | 124 (30.8%) | 25 (6.2%) |
| 3-Person Households | 34 (8.5%) | 0 (0.0%) |
| 4-Person Households | 30 (7.5%) | 0 (0.0%) |
| 5-Person Households | 0 (0.0%) | 0 (0.0%) |
| 6-Person Households | 63 (15.7%) | 0 (0.0%) |
| 7+ Person Households | 0 (0.0%) | 0 (0.0%) |
| Total | 251 (62.4%) | 151 (37.6%) |
Female Fertility in Camanche North Shore
Fertility by Age in Camanche North Shore
Average fertility rate in Camanche North Shore is 19.0 births per 1,000 women. Women in the age bracket of 20 to 34 years have the highest fertility rate with 49.0 births per 1,000 women. Women in the age bracket of 20 to 34 years acount for 100.0% of all women with births.
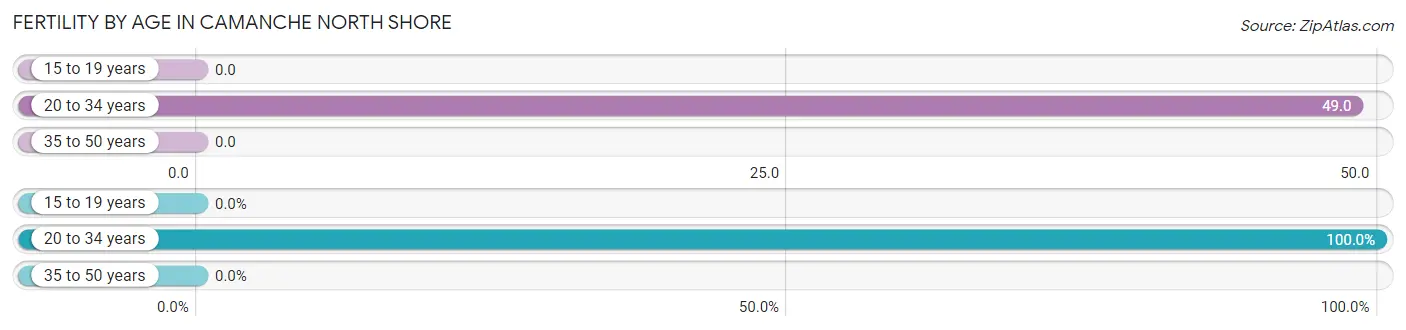
| Age Bracket | Women with Births | Births / 1,000 Women |
| 15 to 19 years | 0 (0.0%) | 0.0 |
| 20 to 34 years | 5 (100.0%) | 49.0 |
| 35 to 50 years | 0 (0.0%) | 0.0 |
| Total | 5 (100.0%) | 19.0 |
Fertility by Age by Marriage Status in Camanche North Shore
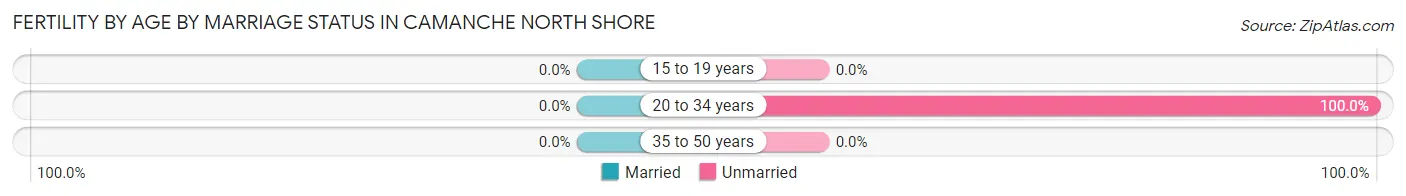
| Age Bracket | Married | Unmarried |
| 15 to 19 years | 0 (0.0%) | 0 (0.0%) |
| 20 to 34 years | 0 (0.0%) | 5 (100.0%) |
| 35 to 50 years | 0 (0.0%) | 0 (0.0%) |
| Total | 0 (0.0%) | 5 (100.0%) |
Fertility by Education in Camanche North Shore
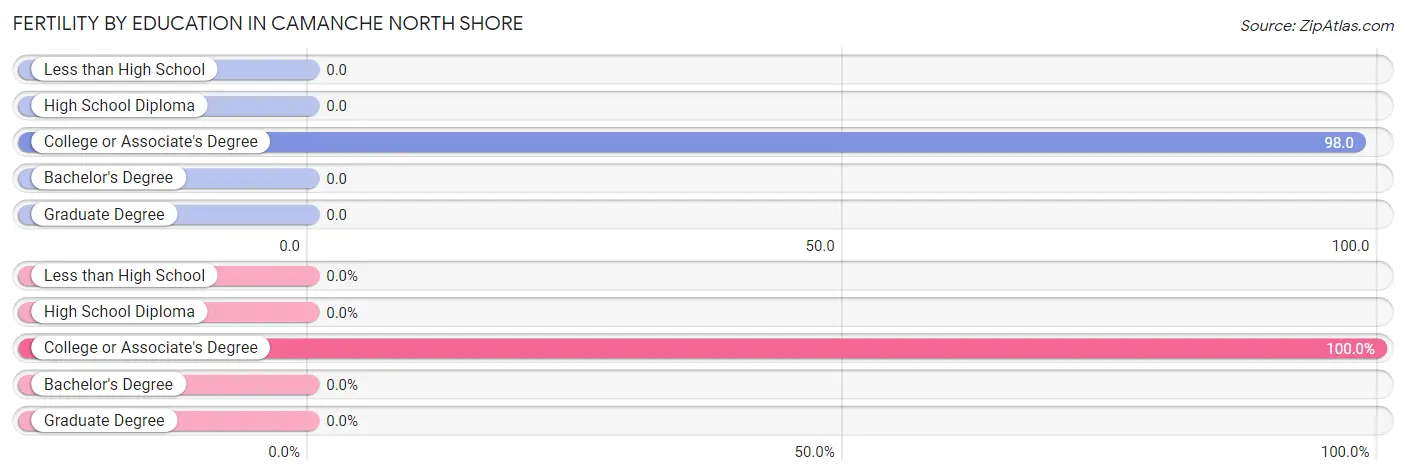
| Educational Attainment | Women with Births | Births / 1,000 Women |
| Less than High School | 0 (0.0%) | 0.0 |
| High School Diploma | 0 (0.0%) | 0.0 |
| College or Associate's Degree | 5 (100.0%) | 98.0 |
| Bachelor's Degree | 0 (0.0%) | 0.0 |
| Graduate Degree | 0 (0.0%) | 0.0 |
| Total | 5 (100.0%) | 19.0 |
Fertility by Education by Marriage Status in Camanche North Shore
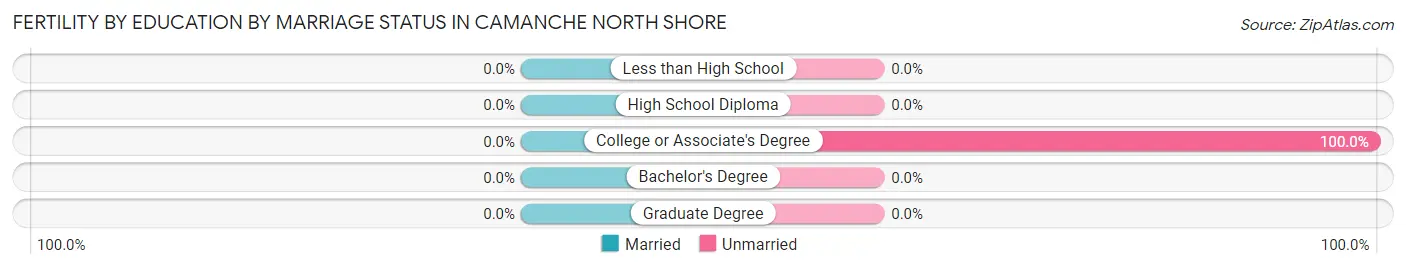
| Educational Attainment | Married | Unmarried |
| Less than High School | 0 (0.0%) | 0 (0.0%) |
| High School Diploma | 0 (0.0%) | 0 (0.0%) |
| College or Associate's Degree | 0 (0.0%) | 5 (100.0%) |
| Bachelor's Degree | 0 (0.0%) | 0 (0.0%) |
| Graduate Degree | 0 (0.0%) | 0 (0.0%) |
| Total | 0 (0.0%) | 5 (100.0%) |
Employment Characteristics in Camanche North Shore
Employment by Class of Employer in Camanche North Shore
Among the 320 employed individuals in Camanche North Shore, private company employees (197 | 61.6%), self-employed (not incorporated) (56 | 17.5%), and self-employed (incorporated) (34 | 10.6%) make up the most common classes of employment.
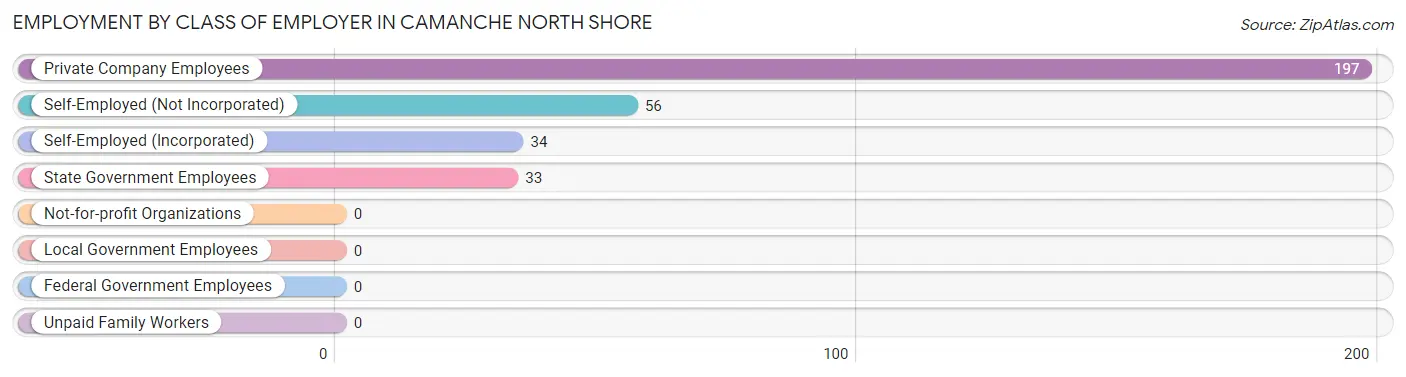
| Employer Class | # Employees | % Employees |
| Private Company Employees | 197 | 61.6% |
| Self-Employed (Incorporated) | 34 | 10.6% |
| Self-Employed (Not Incorporated) | 56 | 17.5% |
| Not-for-profit Organizations | 0 | 0.0% |
| Local Government Employees | 0 | 0.0% |
| State Government Employees | 33 | 10.3% |
| Federal Government Employees | 0 | 0.0% |
| Unpaid Family Workers | 0 | 0.0% |
| Total | 320 | 100.0% |
Employment Status by Age in Camanche North Shore
According to the labor force statistics for Camanche North Shore, out of the total population over 16 years of age (916), 38.3% or 351 individuals are in the labor force, with 7.4% or 26 of them unemployed. The age group with the highest labor force participation rate is 45 to 54 years, with 88.6% or 117 individuals in the labor force. Within the labor force, the 35 to 44 years age range has the highest percentage of unemployed individuals, with 32.5% or 26 of them being unemployed.
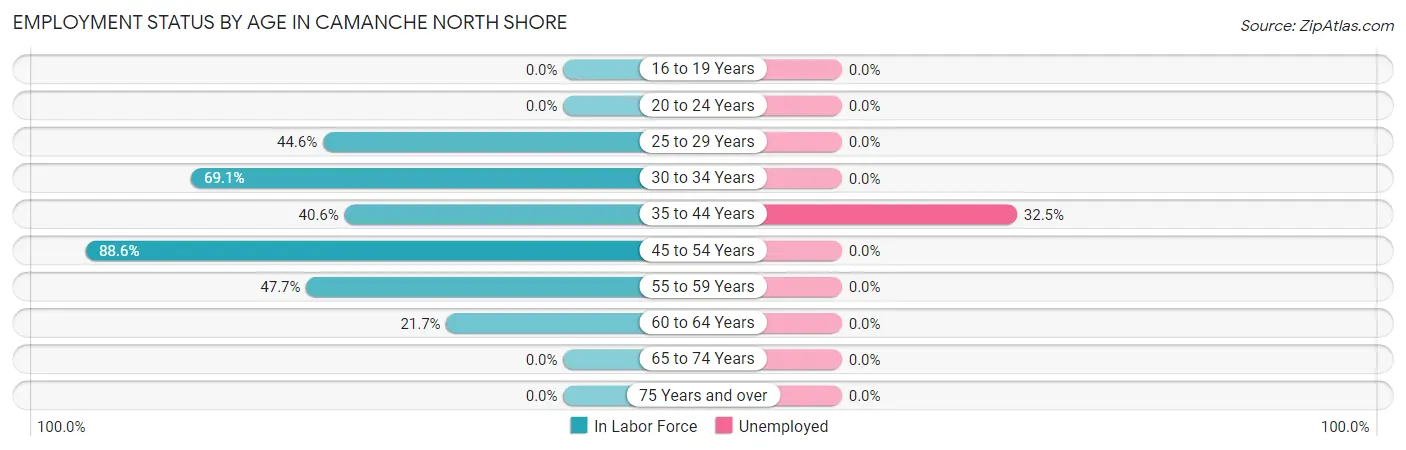
| Age Bracket | In Labor Force | Unemployed |
| 16 to 19 Years | 0 (0.0%) | 0 (0.0%) |
| 20 to 24 Years | 0 (0.0%) | 0 (0.0%) |
| 25 to 29 Years | 45 (44.6%) | 0 (0.0%) |
| 30 to 34 Years | 38 (69.1%) | 0 (0.0%) |
| 35 to 44 Years | 80 (40.6%) | 26 (32.5%) |
| 45 to 54 Years | 117 (88.6%) | 0 (0.0%) |
| 55 to 59 Years | 53 (47.7%) | 0 (0.0%) |
| 60 to 64 Years | 18 (21.7%) | 0 (0.0%) |
| 65 to 74 Years | 0 (0.0%) | 0 (0.0%) |
| 75 Years and over | 0 (0.0%) | 0 (0.0%) |
| Total | 351 (38.3%) | 26 (7.4%) |
Employment Status by Educational Attainment in Camanche North Shore
According to labor force statistics for Camanche North Shore, 51.7% of individuals (351) out of the total population between 25 and 64 years of age (679) are in the labor force, with 7.4% or 26 of them being unemployed. The group with the highest labor force participation rate are those with the educational attainment of college / associate degree, with 70.8% or 182 individuals in the labor force. Within the labor force, individuals with college / associate degree education have the highest percentage of unemployment, with 14.3% or 26 of them being unemployed.
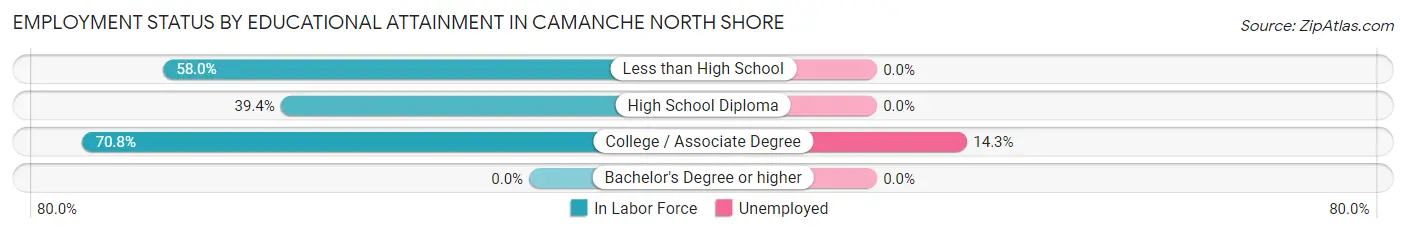
| Educational Attainment | In Labor Force | Unemployed |
| Less than High School | 29 (58.0%) | 0 (0.0%) |
| High School Diploma | 140 (39.4%) | 0 (0.0%) |
| College / Associate Degree | 182 (70.8%) | 37 (14.3%) |
| Bachelor's Degree or higher | 0 (0.0%) | 0 (0.0%) |
| Total | 351 (51.7%) | 50 (7.4%) |
Employment Occupations by Sex in Camanche North Shore
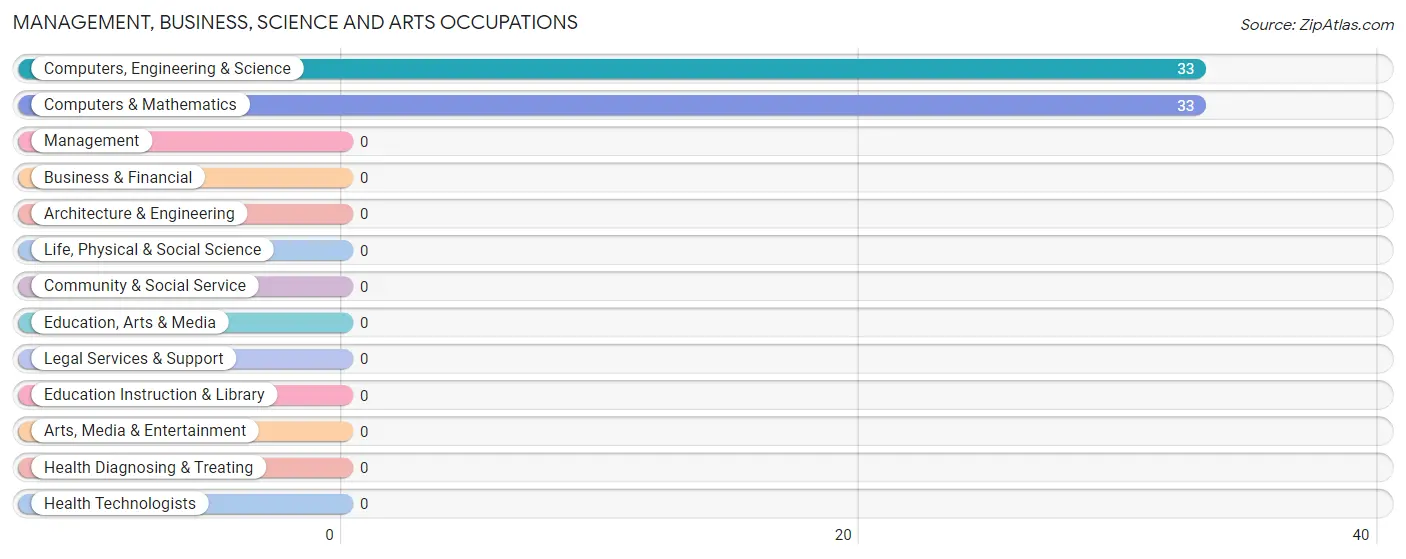
Management, Business, Science and Arts Occupations
The most common Management, Business, Science and Arts occupations in Camanche North Shore are Computers, Engineering & Science (33 | 10.2%), and Computers & Mathematics (33 | 10.2%).
Management, Business, Science and Arts Occupations by Sex
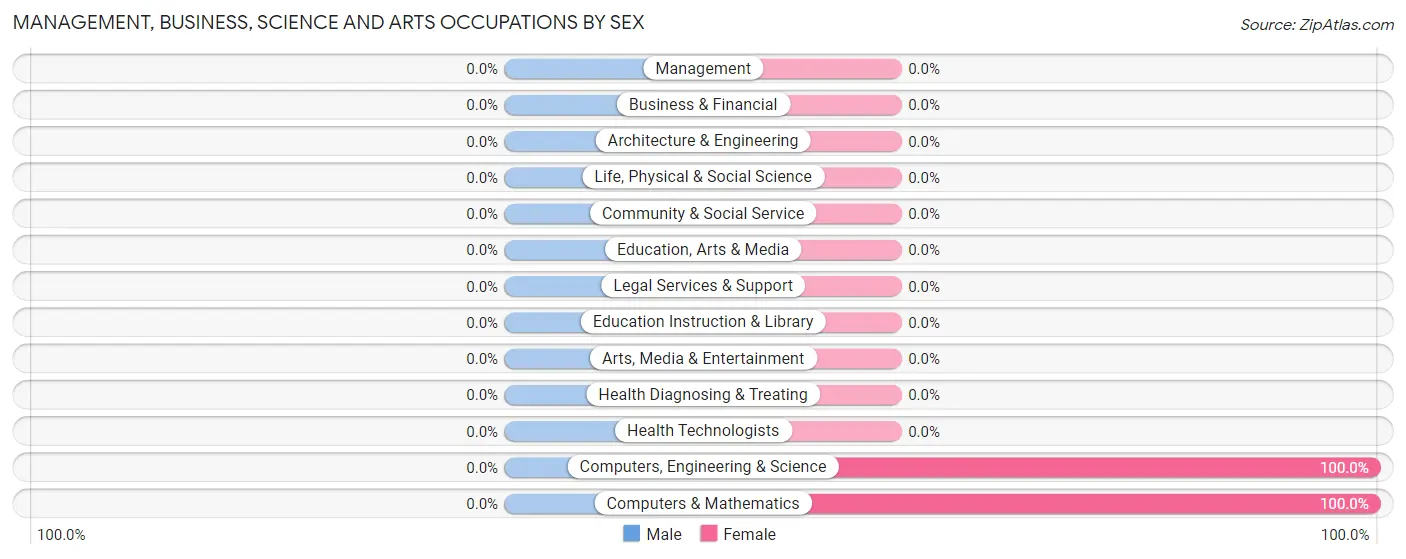
| Occupation | Male | Female |
| Management | 0 (0.0%) | 0 (0.0%) |
| Business & Financial | 0 (0.0%) | 0 (0.0%) |
| Computers, Engineering & Science | 0 (0.0%) | 33 (100.0%) |
| Computers & Mathematics | 0 (0.0%) | 33 (100.0%) |
| Architecture & Engineering | 0 (0.0%) | 0 (0.0%) |
| Life, Physical & Social Science | 0 (0.0%) | 0 (0.0%) |
| Community & Social Service | 0 (0.0%) | 0 (0.0%) |
| Education, Arts & Media | 0 (0.0%) | 0 (0.0%) |
| Legal Services & Support | 0 (0.0%) | 0 (0.0%) |
| Education Instruction & Library | 0 (0.0%) | 0 (0.0%) |
| Arts, Media & Entertainment | 0 (0.0%) | 0 (0.0%) |
| Health Diagnosing & Treating | 0 (0.0%) | 0 (0.0%) |
| Health Technologists | 0 (0.0%) | 0 (0.0%) |
| Total (Category) | 0 (0.0%) | 33 (100.0%) |
| Total (Overall) | 188 (57.9%) | 137 (42.1%) |
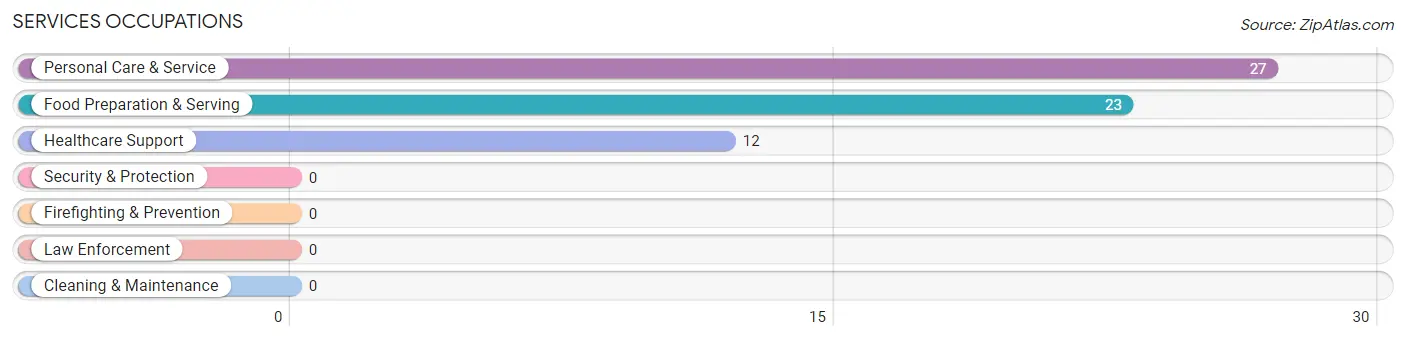
Services Occupations
The most common Services occupations in Camanche North Shore are Personal Care & Service (27 | 8.3%), Food Preparation & Serving (23 | 7.1%), and Healthcare Support (12 | 3.7%).
Services Occupations by Sex
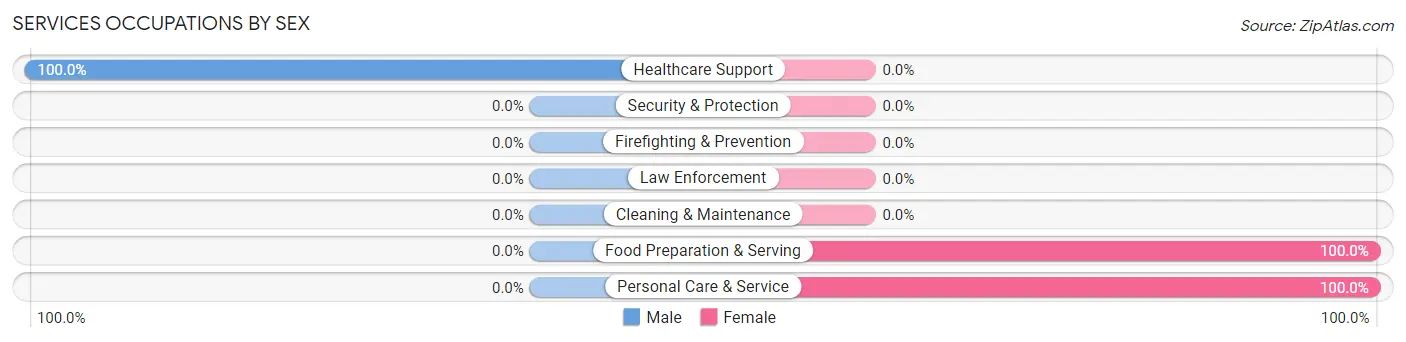
| Occupation | Male | Female |
| Healthcare Support | 12 (100.0%) | 0 (0.0%) |
| Security & Protection | 0 (0.0%) | 0 (0.0%) |
| Firefighting & Prevention | 0 (0.0%) | 0 (0.0%) |
| Law Enforcement | 0 (0.0%) | 0 (0.0%) |
| Food Preparation & Serving | 0 (0.0%) | 23 (100.0%) |
| Cleaning & Maintenance | 0 (0.0%) | 0 (0.0%) |
| Personal Care & Service | 0 (0.0%) | 27 (100.0%) |
| Total (Category) | 12 (19.4%) | 50 (80.6%) |
| Total (Overall) | 188 (57.9%) | 137 (42.1%) |
Sales and Office Occupations
The most common Sales and Office occupations in Camanche North Shore are Office & Administration (61 | 18.8%), and Sales & Related (18 | 5.5%).
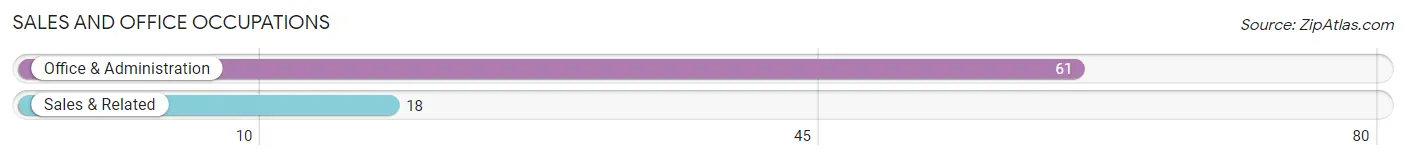
Sales and Office Occupations by Sex
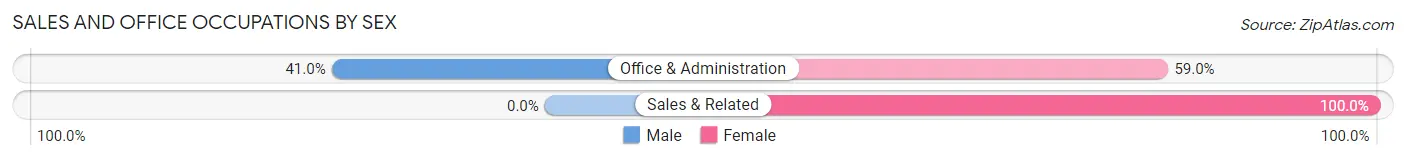
| Occupation | Male | Female |
| Sales & Related | 0 (0.0%) | 18 (100.0%) |
| Office & Administration | 25 (41.0%) | 36 (59.0%) |
| Total (Category) | 25 (31.7%) | 54 (68.3%) |
| Total (Overall) | 188 (57.9%) | 137 (42.1%) |
Natural Resources, Construction and Maintenance Occupations
The most common Natural Resources, Construction and Maintenance occupations in Camanche North Shore are , and Installation, Maintenance & Repair (29 | 8.9%).
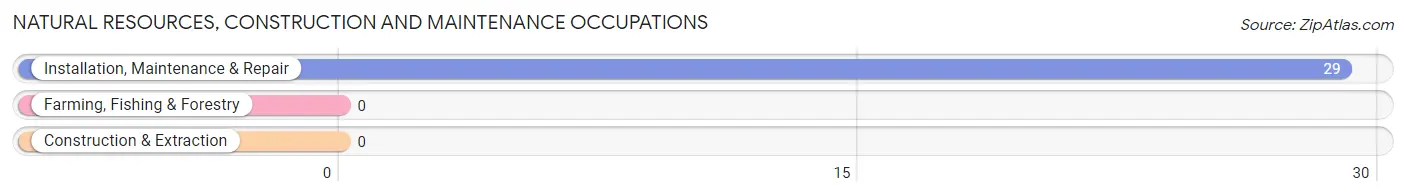
Natural Resources, Construction and Maintenance Occupations by Sex
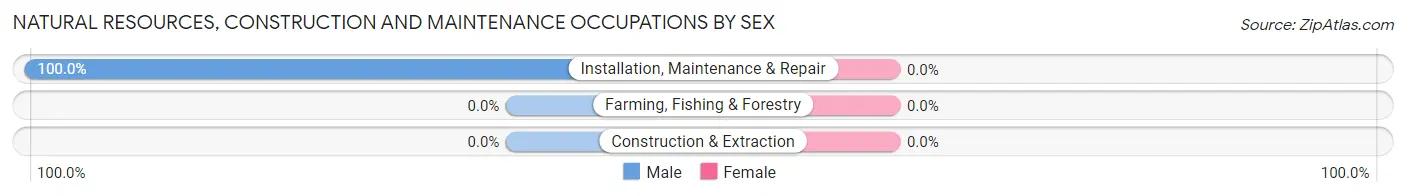
| Occupation | Male | Female |
| Farming, Fishing & Forestry | 0 (0.0%) | 0 (0.0%) |
| Construction & Extraction | 0 (0.0%) | 0 (0.0%) |
| Installation, Maintenance & Repair | 29 (100.0%) | 0 (0.0%) |
| Total (Category) | 29 (100.0%) | 0 (0.0%) |
| Total (Overall) | 188 (57.9%) | 137 (42.1%) |
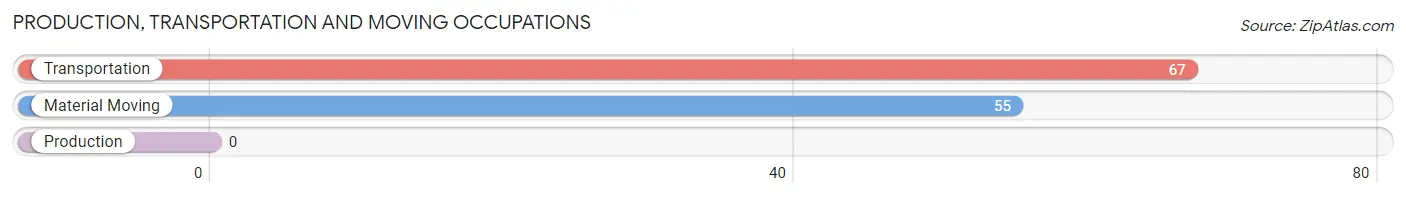
Production, Transportation and Moving Occupations
The most common Production, Transportation and Moving occupations in Camanche North Shore are Transportation (67 | 20.6%), and Material Moving (55 | 16.9%).
Production, Transportation and Moving Occupations by Sex
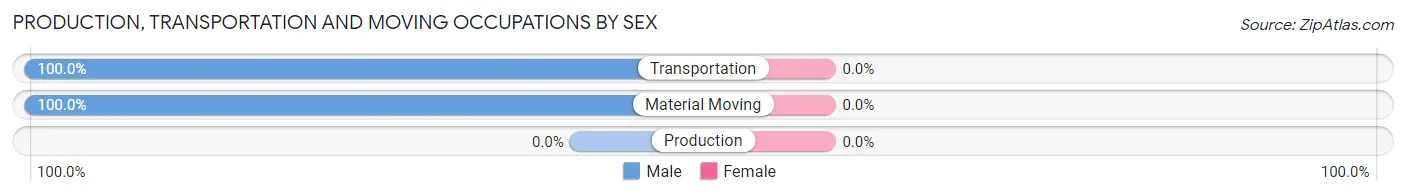
| Occupation | Male | Female |
| Production | 0 (0.0%) | 0 (0.0%) |
| Transportation | 67 (100.0%) | 0 (0.0%) |
| Material Moving | 55 (100.0%) | 0 (0.0%) |
| Total (Category) | 122 (100.0%) | 0 (0.0%) |
| Total (Overall) | 188 (57.9%) | 137 (42.1%) |
Employment Industries by Sex in Camanche North Shore
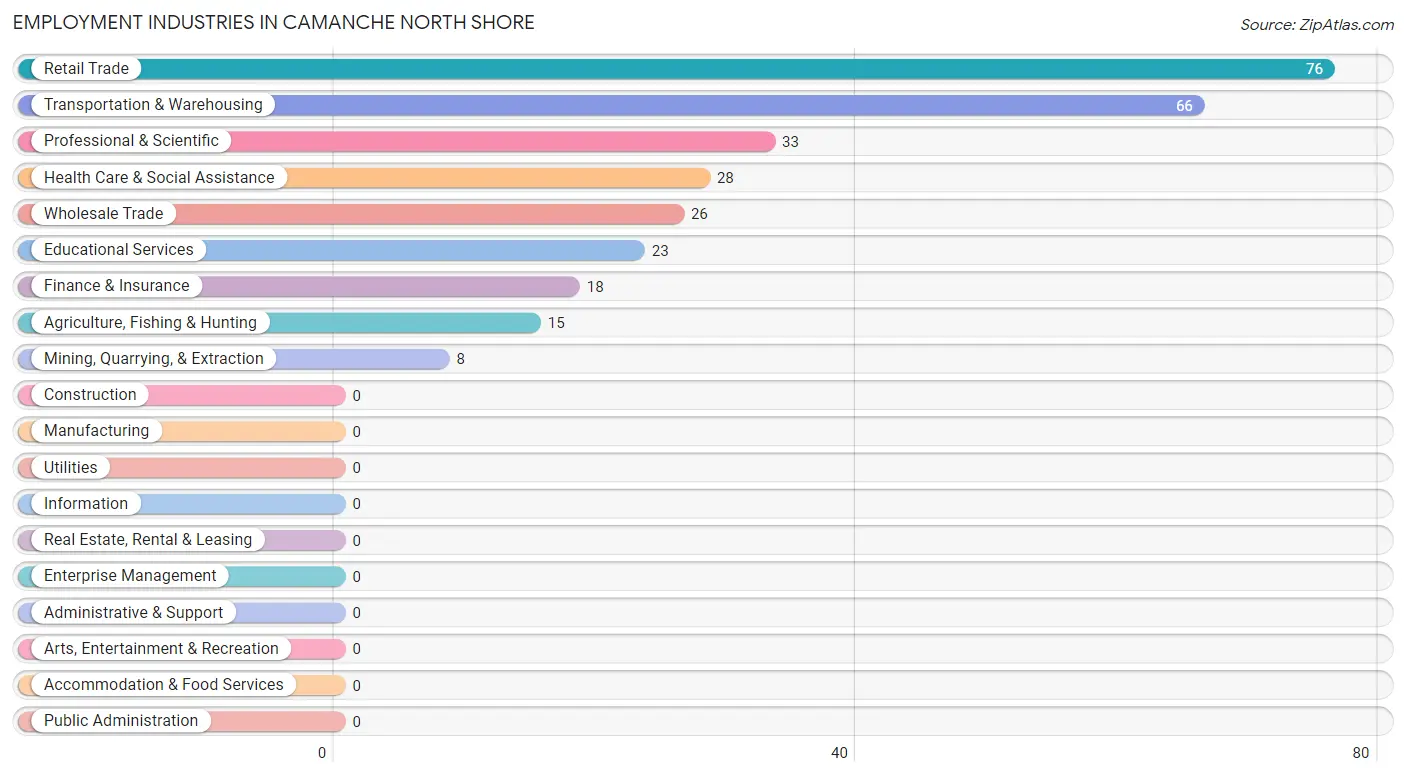
Employment Industries in Camanche North Shore
The major employment industries in Camanche North Shore include Retail Trade (76 | 23.4%), Transportation & Warehousing (66 | 20.3%), Professional & Scientific (33 | 10.2%), Health Care & Social Assistance (28 | 8.6%), and Wholesale Trade (26 | 8.0%).
Employment Industries by Sex in Camanche North Shore
The Camanche North Shore industries that see more men than women are Mining, Quarrying, & Extraction (100.0%), Wholesale Trade (100.0%), and Retail Trade (100.0%), whereas the industries that tend to have a higher number of women are Agriculture, Fishing & Hunting (100.0%), Finance & Insurance (100.0%), and Professional & Scientific (100.0%).
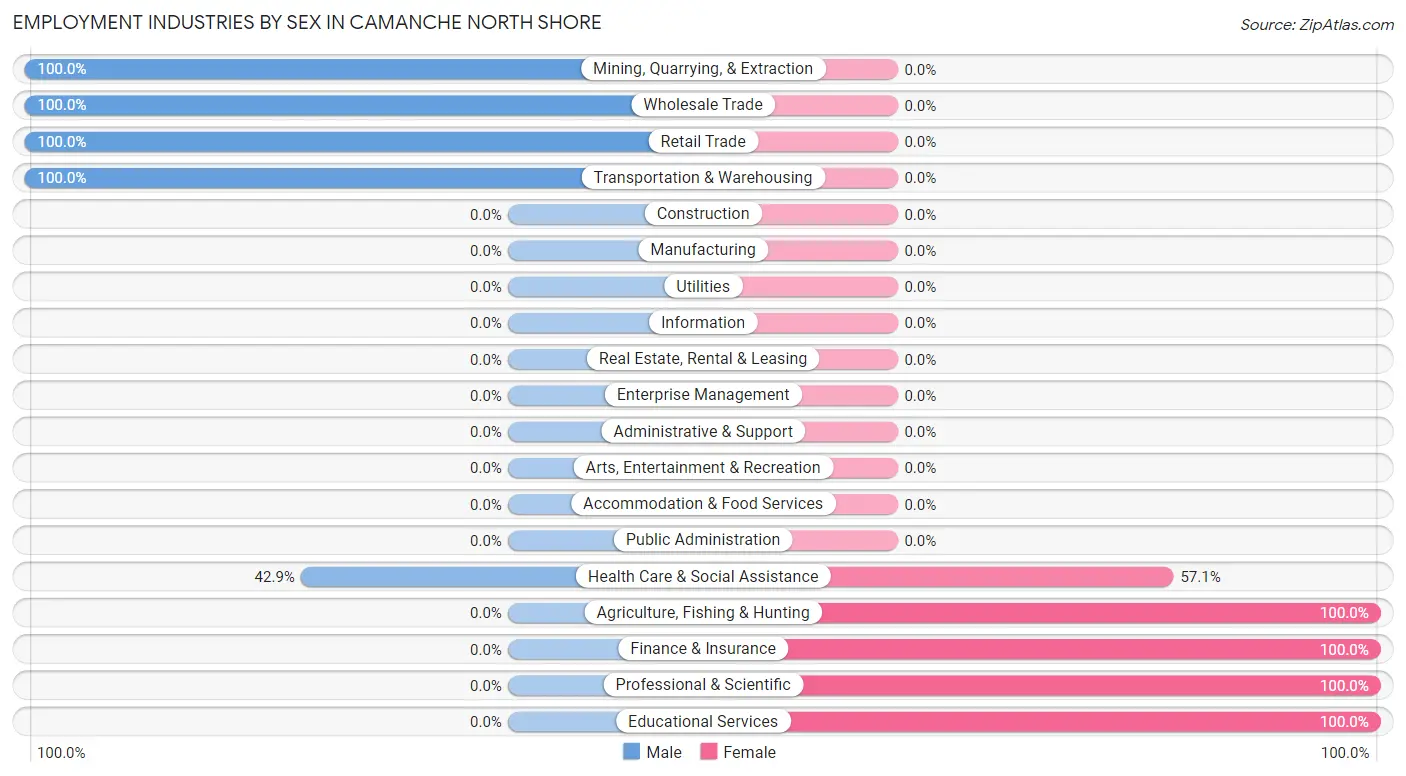
| Industry | Male | Female |
| Agriculture, Fishing & Hunting | 0 (0.0%) | 15 (100.0%) |
| Mining, Quarrying, & Extraction | 8 (100.0%) | 0 (0.0%) |
| Construction | 0 (0.0%) | 0 (0.0%) |
| Manufacturing | 0 (0.0%) | 0 (0.0%) |
| Wholesale Trade | 26 (100.0%) | 0 (0.0%) |
| Retail Trade | 76 (100.0%) | 0 (0.0%) |
| Transportation & Warehousing | 66 (100.0%) | 0 (0.0%) |
| Utilities | 0 (0.0%) | 0 (0.0%) |
| Information | 0 (0.0%) | 0 (0.0%) |
| Finance & Insurance | 0 (0.0%) | 18 (100.0%) |
| Real Estate, Rental & Leasing | 0 (0.0%) | 0 (0.0%) |
| Professional & Scientific | 0 (0.0%) | 33 (100.0%) |
| Enterprise Management | 0 (0.0%) | 0 (0.0%) |
| Administrative & Support | 0 (0.0%) | 0 (0.0%) |
| Educational Services | 0 (0.0%) | 23 (100.0%) |
| Health Care & Social Assistance | 12 (42.9%) | 16 (57.1%) |
| Arts, Entertainment & Recreation | 0 (0.0%) | 0 (0.0%) |
| Accommodation & Food Services | 0 (0.0%) | 0 (0.0%) |
| Public Administration | 0 (0.0%) | 0 (0.0%) |
| Total | 188 (57.9%) | 137 (42.1%) |
Education in Camanche North Shore
School Enrollment in Camanche North Shore
The most common levels of schooling among the 266 students in Camanche North Shore are high school (88 | 33.1%), college / undergraduate (72 | 27.1%), and middle school (56 | 21.0%).
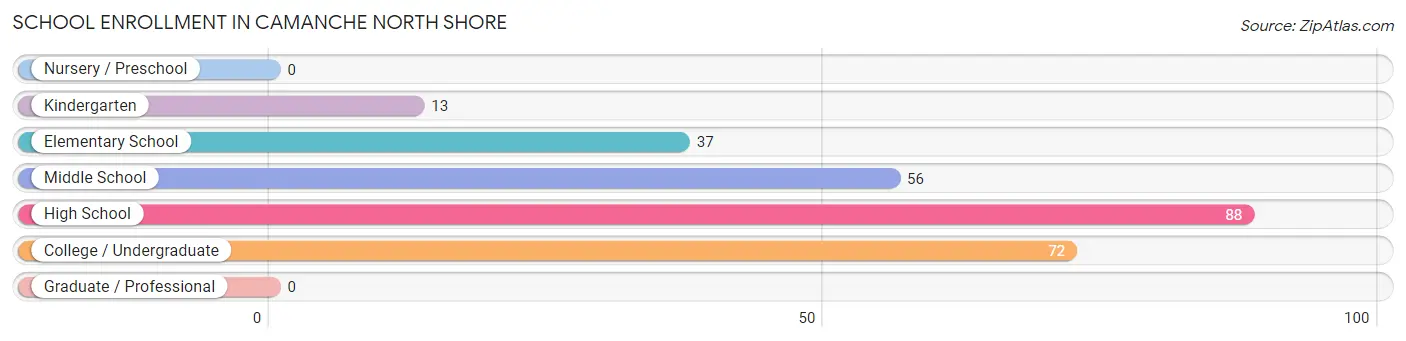
| School Level | # Students | % Students |
| Nursery / Preschool | 0 | 0.0% |
| Kindergarten | 13 | 4.9% |
| Elementary School | 37 | 13.9% |
| Middle School | 56 | 21.0% |
| High School | 88 | 33.1% |
| College / Undergraduate | 72 | 27.1% |
| Graduate / Professional | 0 | 0.0% |
| Total | 266 | 100.0% |
School Enrollment by Age by Funding Source in Camanche North Shore
Out of a total of 266 students who are enrolled in schools in Camanche North Shore, 16 (6.0%) attend a private institution, while the remaining 250 (94.0%) are enrolled in public schools. The age group of 35 years and over has the highest likelihood of being enrolled in private schools, with 16 (100.0% in the age bracket) enrolled. Conversely, the age group of 5 to 9 year old has the lowest likelihood of being enrolled in a private school, with 50 (100.0% in the age bracket) attending a public institution.
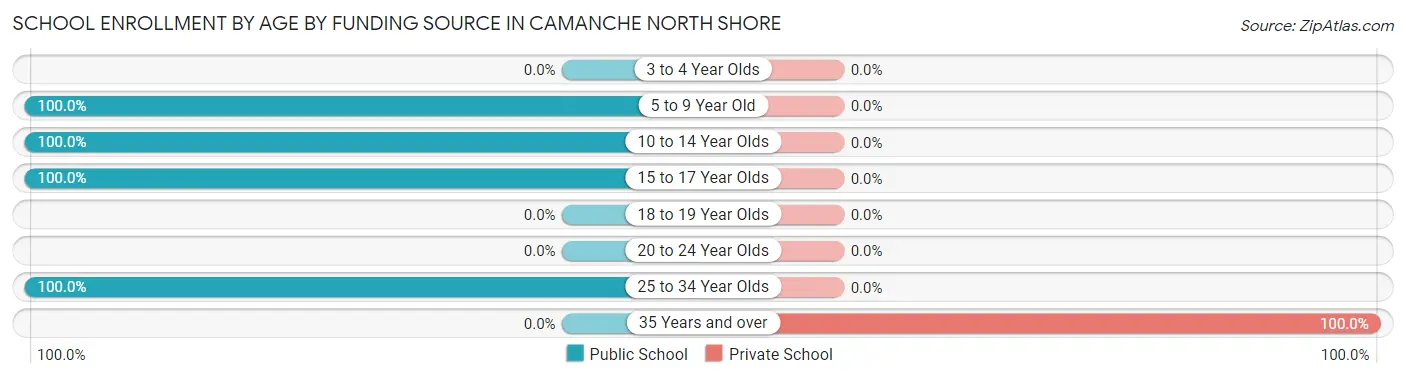
| Age Bracket | Public School | Private School |
| 3 to 4 Year Olds | 0 (0.0%) | 0 (0.0%) |
| 5 to 9 Year Old | 50 (100.0%) | 0 (0.0%) |
| 10 to 14 Year Olds | 63 (100.0%) | 0 (0.0%) |
| 15 to 17 Year Olds | 81 (100.0%) | 0 (0.0%) |
| 18 to 19 Year Olds | 0 (0.0%) | 0 (0.0%) |
| 20 to 24 Year Olds | 0 (0.0%) | 0 (0.0%) |
| 25 to 34 Year Olds | 56 (100.0%) | 0 (0.0%) |
| 35 Years and over | 0 (0.0%) | 16 (100.0%) |
| Total | 250 (94.0%) | 16 (6.0%) |
Educational Attainment by Field of Study in Camanche North Shore
Communications (17 | 63.0%), and bio, nature & agricultural (10 | 37.0%) are the most common fields of study among 27 individuals in Camanche North Shore who have obtained a bachelor's degree or higher.
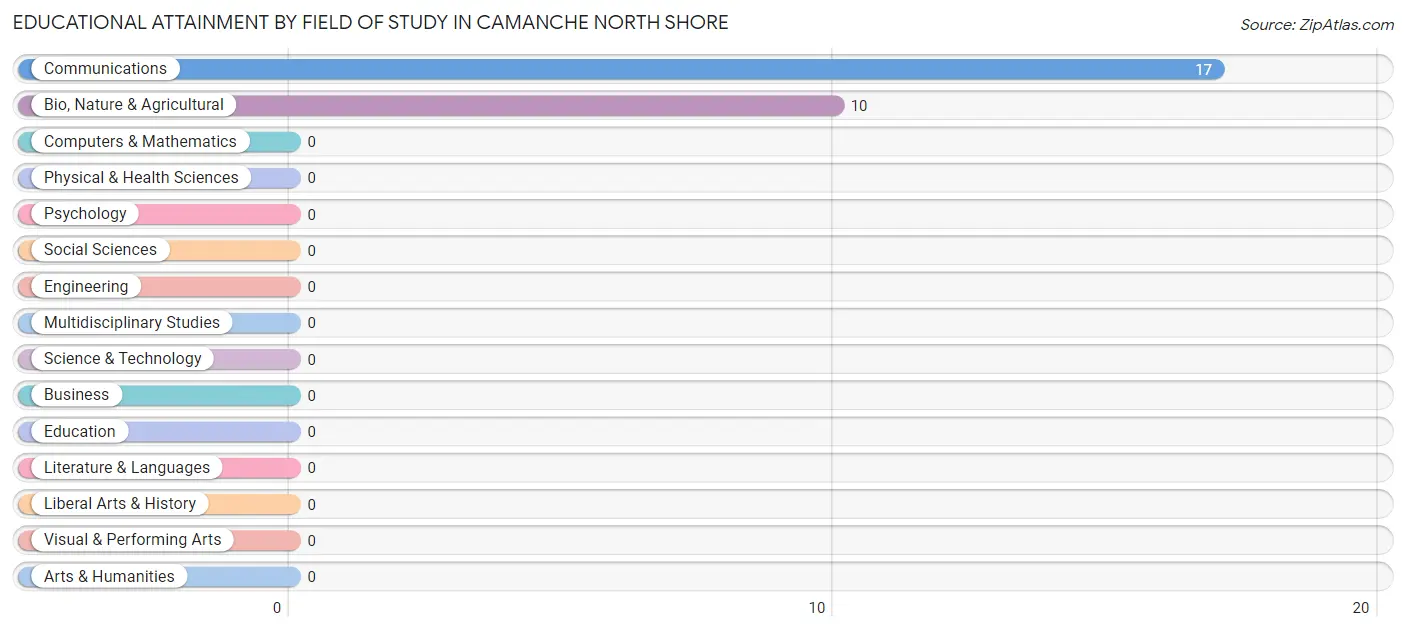
| Field of Study | # Graduates | % Graduates |
| Computers & Mathematics | 0 | 0.0% |
| Bio, Nature & Agricultural | 10 | 37.0% |
| Physical & Health Sciences | 0 | 0.0% |
| Psychology | 0 | 0.0% |
| Social Sciences | 0 | 0.0% |
| Engineering | 0 | 0.0% |
| Multidisciplinary Studies | 0 | 0.0% |
| Science & Technology | 0 | 0.0% |
| Business | 0 | 0.0% |
| Education | 0 | 0.0% |
| Literature & Languages | 0 | 0.0% |
| Liberal Arts & History | 0 | 0.0% |
| Visual & Performing Arts | 0 | 0.0% |
| Communications | 17 | 63.0% |
| Arts & Humanities | 0 | 0.0% |
| Total | 27 | 100.0% |
Transportation & Commute in Camanche North Shore
Vehicle Availability by Sex in Camanche North Shore
The most prevalent vehicle ownership categories in Camanche North Shore are males with 2 vehicles (92, accounting for 48.9%) and females with 2 vehicles (23, making up 69.7%).
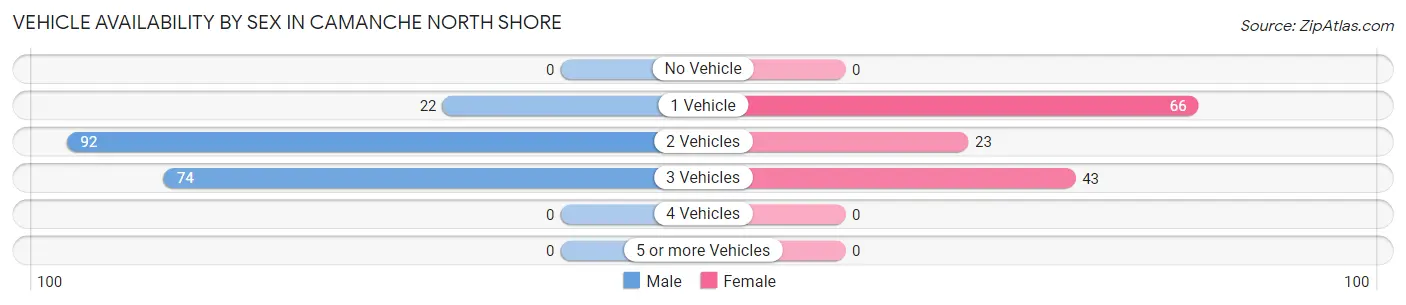
| Vehicles Available | Male | Female |
| No Vehicle | 0 (0.0%) | 0 (0.0%) |
| 1 Vehicle | 22 (11.7%) | 66 (50.0%) |
| 2 Vehicles | 92 (48.9%) | 23 (17.4%) |
| 3 Vehicles | 74 (39.4%) | 43 (32.6%) |
| 4 Vehicles | 0 (0.0%) | 0 (0.0%) |
| 5 or more Vehicles | 0 (0.0%) | 0 (0.0%) |
| Total | 188 (100.0%) | 132 (100.0%) |
Commute Time in Camanche North Shore
The most frequently occuring commute durations in Camanche North Shore are 60 to 89 minutes (66 commuters, 25.7%), 45 to 59 minutes (46 commuters, 17.9%), and 10 to 14 minutes (33 commuters, 12.8%).
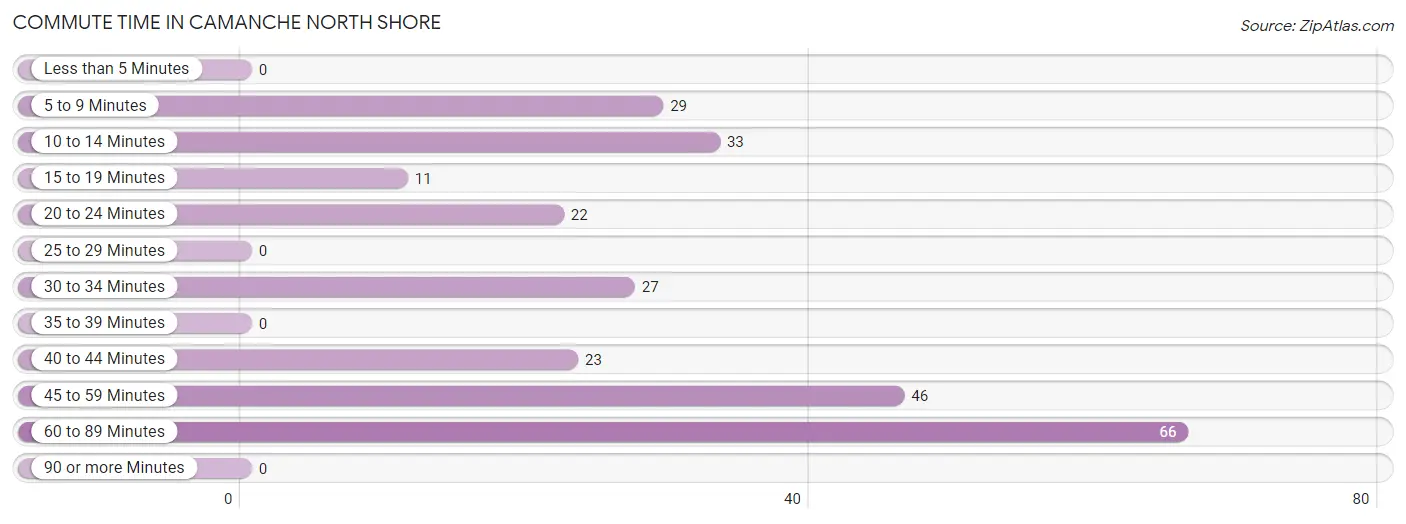
| Commute Time | # Commuters | % Commuters |
| Less than 5 Minutes | 0 | 0.0% |
| 5 to 9 Minutes | 29 | 11.3% |
| 10 to 14 Minutes | 33 | 12.8% |
| 15 to 19 Minutes | 11 | 4.3% |
| 20 to 24 Minutes | 22 | 8.6% |
| 25 to 29 Minutes | 0 | 0.0% |
| 30 to 34 Minutes | 27 | 10.5% |
| 35 to 39 Minutes | 0 | 0.0% |
| 40 to 44 Minutes | 23 | 8.9% |
| 45 to 59 Minutes | 46 | 17.9% |
| 60 to 89 Minutes | 66 | 25.7% |
| 90 or more Minutes | 0 | 0.0% |
Commute Time by Sex in Camanche North Shore
The most common commute times in Camanche North Shore are 60 to 89 minutes (66 commuters, 37.5%) for males and 45 to 59 minutes (31 commuters, 38.3%) for females.
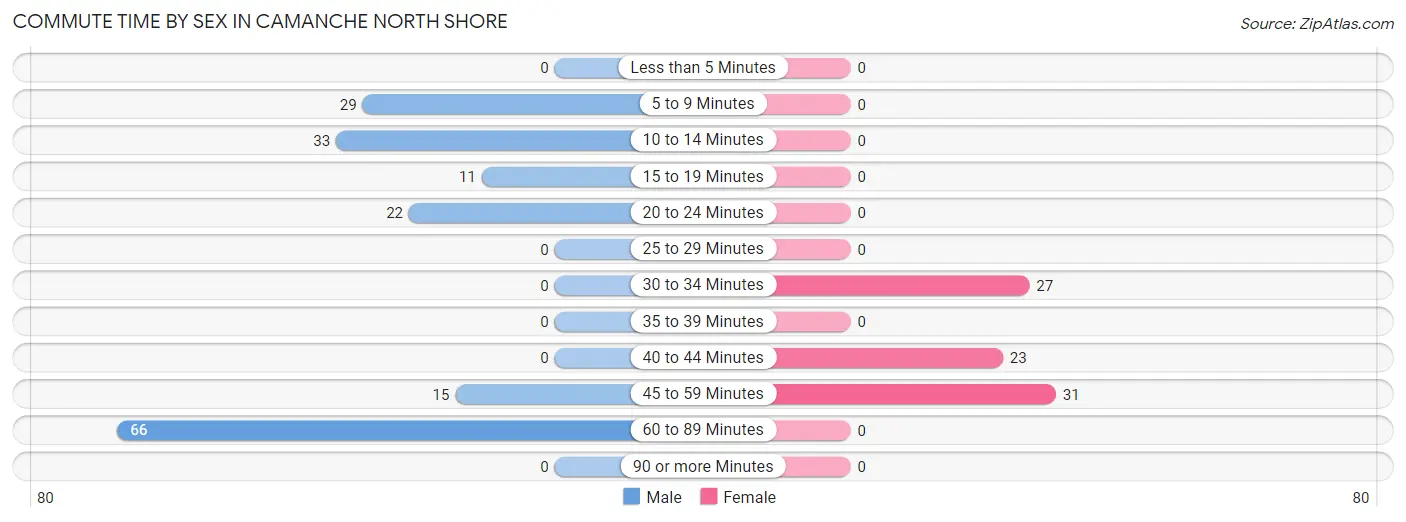
| Commute Time | Male | Female |
| Less than 5 Minutes | 0 (0.0%) | 0 (0.0%) |
| 5 to 9 Minutes | 29 (16.5%) | 0 (0.0%) |
| 10 to 14 Minutes | 33 (18.8%) | 0 (0.0%) |
| 15 to 19 Minutes | 11 (6.2%) | 0 (0.0%) |
| 20 to 24 Minutes | 22 (12.5%) | 0 (0.0%) |
| 25 to 29 Minutes | 0 (0.0%) | 0 (0.0%) |
| 30 to 34 Minutes | 0 (0.0%) | 27 (33.3%) |
| 35 to 39 Minutes | 0 (0.0%) | 0 (0.0%) |
| 40 to 44 Minutes | 0 (0.0%) | 23 (28.4%) |
| 45 to 59 Minutes | 15 (8.5%) | 31 (38.3%) |
| 60 to 89 Minutes | 66 (37.5%) | 0 (0.0%) |
| 90 or more Minutes | 0 (0.0%) | 0 (0.0%) |
Time of Departure to Work by Sex in Camanche North Shore
The most frequent times of departure to work in Camanche North Shore are 7:00 AM to 7:29 AM (51, 29.0%) for males and 5:30 AM to 5:59 AM (50, 61.7%) for females.
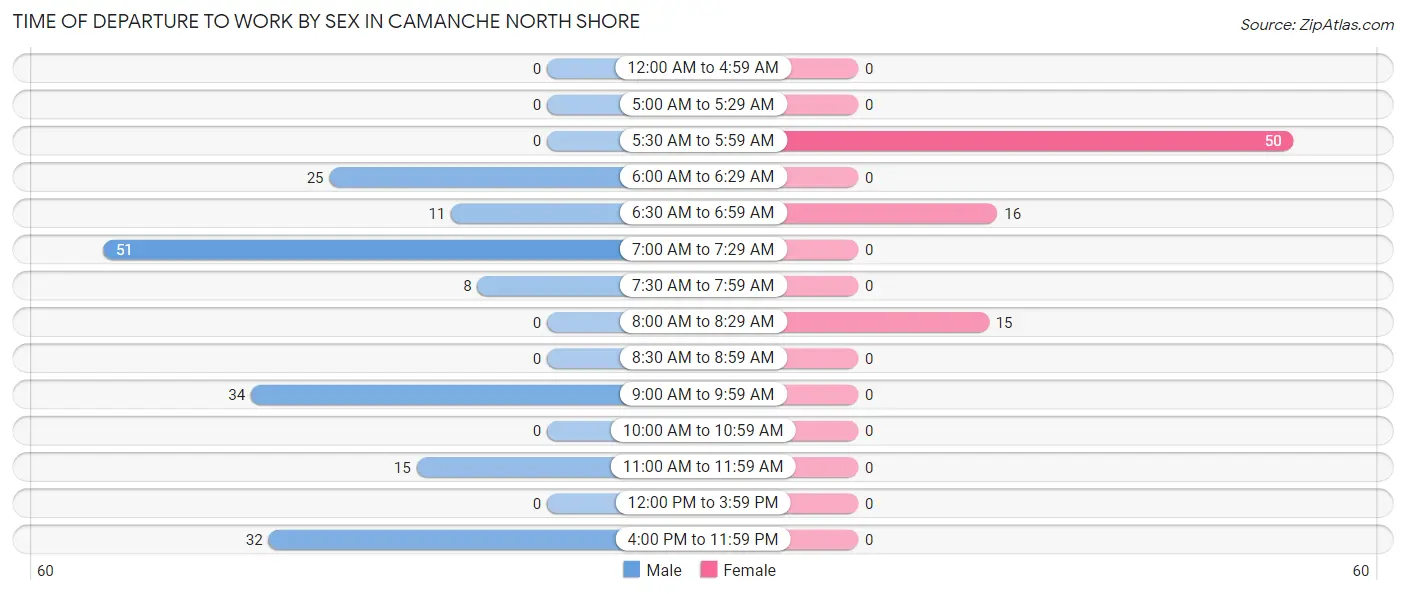
| Time of Departure | Male | Female |
| 12:00 AM to 4:59 AM | 0 (0.0%) | 0 (0.0%) |
| 5:00 AM to 5:29 AM | 0 (0.0%) | 0 (0.0%) |
| 5:30 AM to 5:59 AM | 0 (0.0%) | 50 (61.7%) |
| 6:00 AM to 6:29 AM | 25 (14.2%) | 0 (0.0%) |
| 6:30 AM to 6:59 AM | 11 (6.2%) | 16 (19.8%) |
| 7:00 AM to 7:29 AM | 51 (29.0%) | 0 (0.0%) |
| 7:30 AM to 7:59 AM | 8 (4.5%) | 0 (0.0%) |
| 8:00 AM to 8:29 AM | 0 (0.0%) | 15 (18.5%) |
| 8:30 AM to 8:59 AM | 0 (0.0%) | 0 (0.0%) |
| 9:00 AM to 9:59 AM | 34 (19.3%) | 0 (0.0%) |
| 10:00 AM to 10:59 AM | 0 (0.0%) | 0 (0.0%) |
| 11:00 AM to 11:59 AM | 15 (8.5%) | 0 (0.0%) |
| 12:00 PM to 3:59 PM | 0 (0.0%) | 0 (0.0%) |
| 4:00 PM to 11:59 PM | 32 (18.2%) | 0 (0.0%) |
| Total | 176 (100.0%) | 81 (100.0%) |
Housing Occupancy in Camanche North Shore
Occupancy by Ownership in Camanche North Shore
Of the total 402 dwellings in Camanche North Shore, owner-occupied units account for 332 (82.6%), while renter-occupied units make up 70 (17.4%).
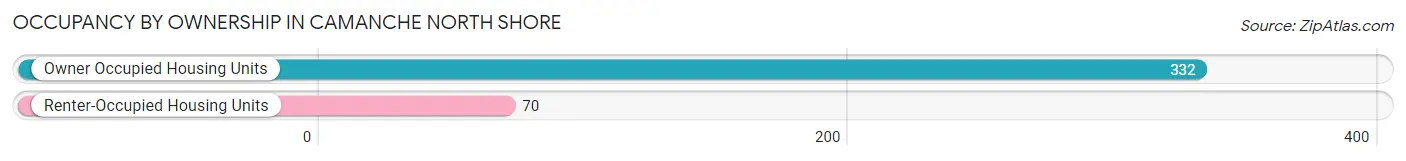
| Occupancy | # Housing Units | % Housing Units |
| Owner Occupied Housing Units | 332 | 82.6% |
| Renter-Occupied Housing Units | 70 | 17.4% |
| Total Occupied Housing Units | 402 | 100.0% |
Occupancy by Household Size in Camanche North Shore
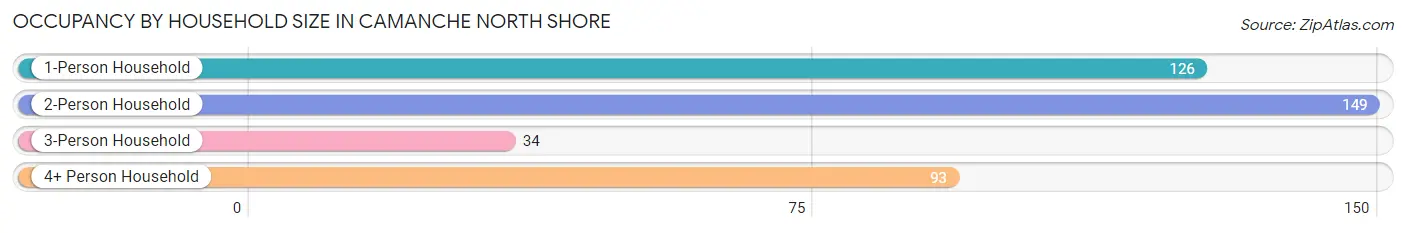
| Household Size | # Housing Units | % Housing Units |
| 1-Person Household | 126 | 31.3% |
| 2-Person Household | 149 | 37.1% |
| 3-Person Household | 34 | 8.5% |
| 4+ Person Household | 93 | 23.1% |
| Total Housing Units | 402 | 100.0% |
Occupancy by Ownership by Household Size in Camanche North Shore
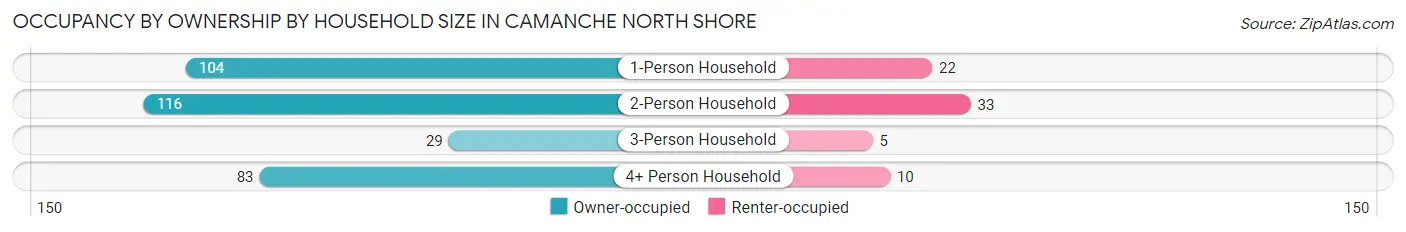
| Household Size | Owner-occupied | Renter-occupied |
| 1-Person Household | 104 (82.5%) | 22 (17.5%) |
| 2-Person Household | 116 (77.8%) | 33 (22.2%) |
| 3-Person Household | 29 (85.3%) | 5 (14.7%) |
| 4+ Person Household | 83 (89.2%) | 10 (10.7%) |
| Total Housing Units | 332 (82.6%) | 70 (17.4%) |
Occupancy by Educational Attainment in Camanche North Shore
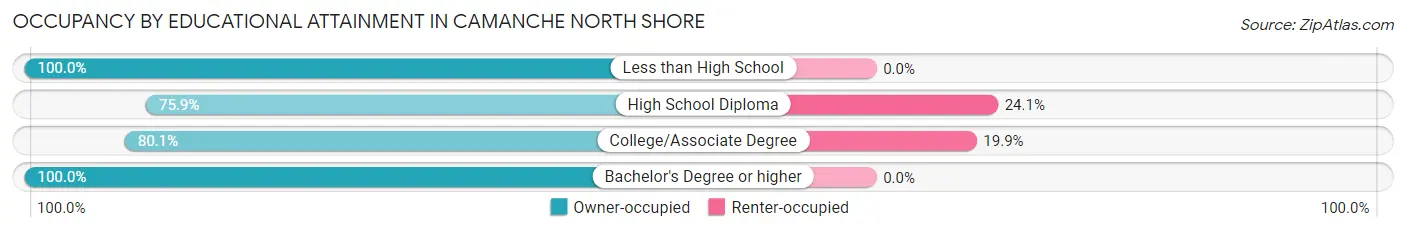
| Household Size | Owner-occupied | Renter-occupied |
| Less than High School | 58 (100.0%) | 0 (0.0%) |
| High School Diploma | 126 (75.9%) | 40 (24.1%) |
| College/Associate Degree | 121 (80.1%) | 30 (19.9%) |
| Bachelor's Degree or higher | 27 (100.0%) | 0 (0.0%) |
Occupancy by Age of Householder in Camanche North Shore
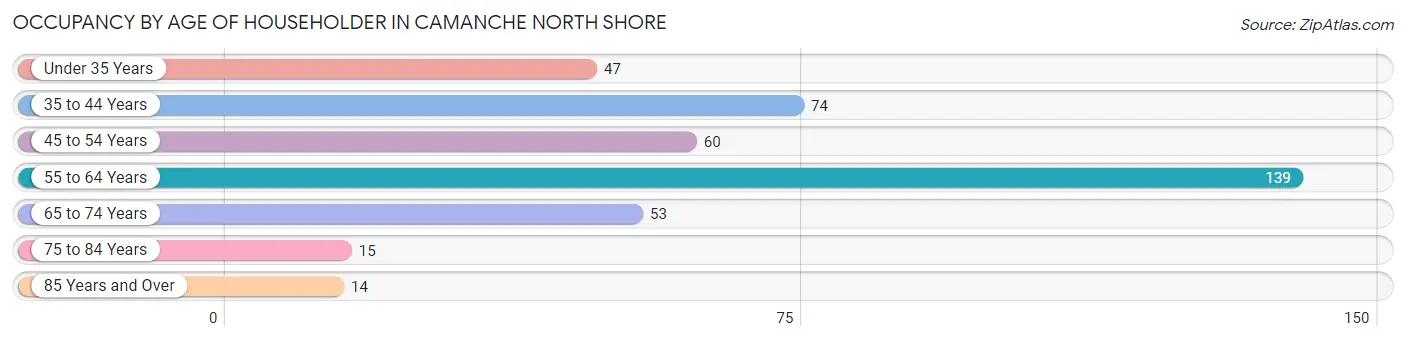
| Age Bracket | # Households | % Households |
| Under 35 Years | 47 | 11.7% |
| 35 to 44 Years | 74 | 18.4% |
| 45 to 54 Years | 60 | 14.9% |
| 55 to 64 Years | 139 | 34.6% |
| 65 to 74 Years | 53 | 13.2% |
| 75 to 84 Years | 15 | 3.7% |
| 85 Years and Over | 14 | 3.5% |
| Total | 402 | 100.0% |
Housing Finances in Camanche North Shore
Median Income by Occupancy in Camanche North Shore
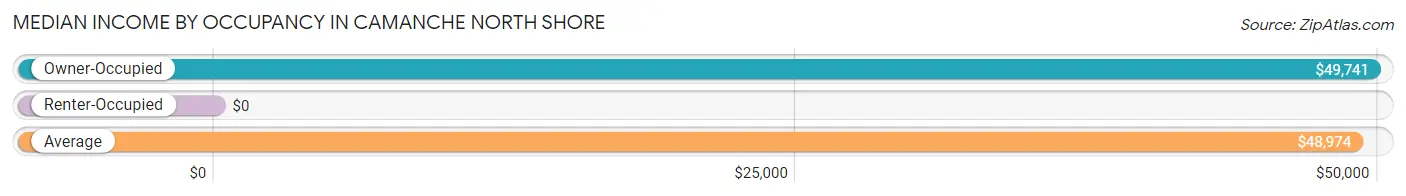
| Occupancy Type | # Households | Median Income |
| Owner-Occupied | 332 (82.6%) | $49,741 |
| Renter-Occupied | 70 (17.4%) | $0 |
| Average | 402 (100.0%) | $48,974 |
Occupancy by Householder Income Bracket in Camanche North Shore
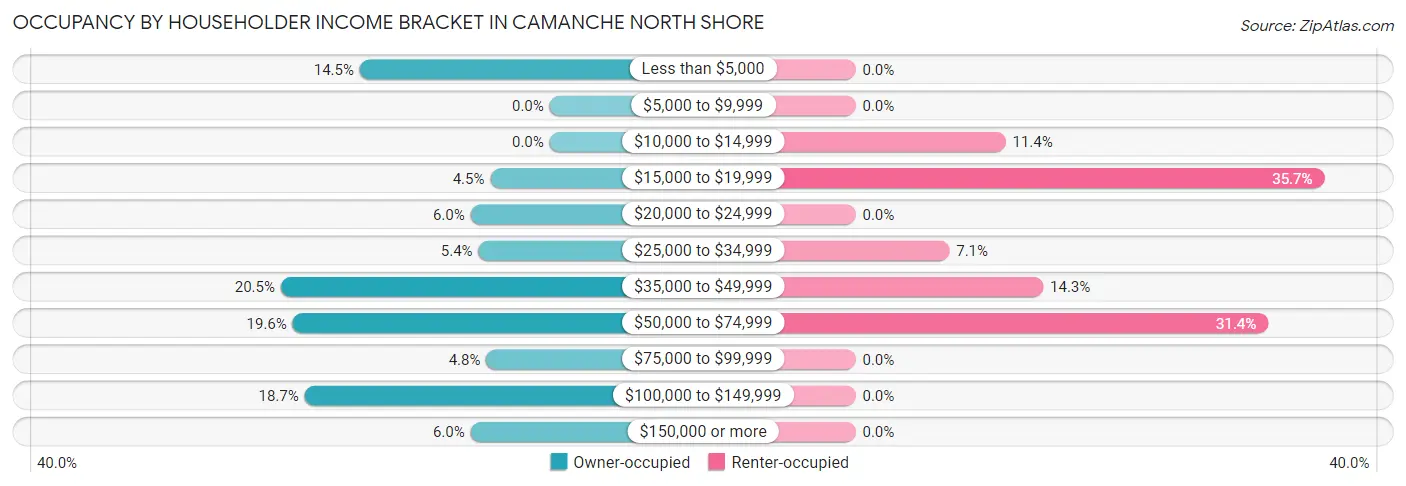
| Income Bracket | Owner-occupied | Renter-occupied |
| Less than $5,000 | 48 (14.5%) | 0 (0.0%) |
| $5,000 to $9,999 | 0 (0.0%) | 0 (0.0%) |
| $10,000 to $14,999 | 0 (0.0%) | 8 (11.4%) |
| $15,000 to $19,999 | 15 (4.5%) | 25 (35.7%) |
| $20,000 to $24,999 | 20 (6.0%) | 0 (0.0%) |
| $25,000 to $34,999 | 18 (5.4%) | 5 (7.1%) |
| $35,000 to $49,999 | 68 (20.5%) | 10 (14.3%) |
| $50,000 to $74,999 | 65 (19.6%) | 22 (31.4%) |
| $75,000 to $99,999 | 16 (4.8%) | 0 (0.0%) |
| $100,000 to $149,999 | 62 (18.7%) | 0 (0.0%) |
| $150,000 or more | 20 (6.0%) | 0 (0.0%) |
| Total | 332 (100.0%) | 70 (100.0%) |
Monthly Housing Cost Tiers in Camanche North Shore
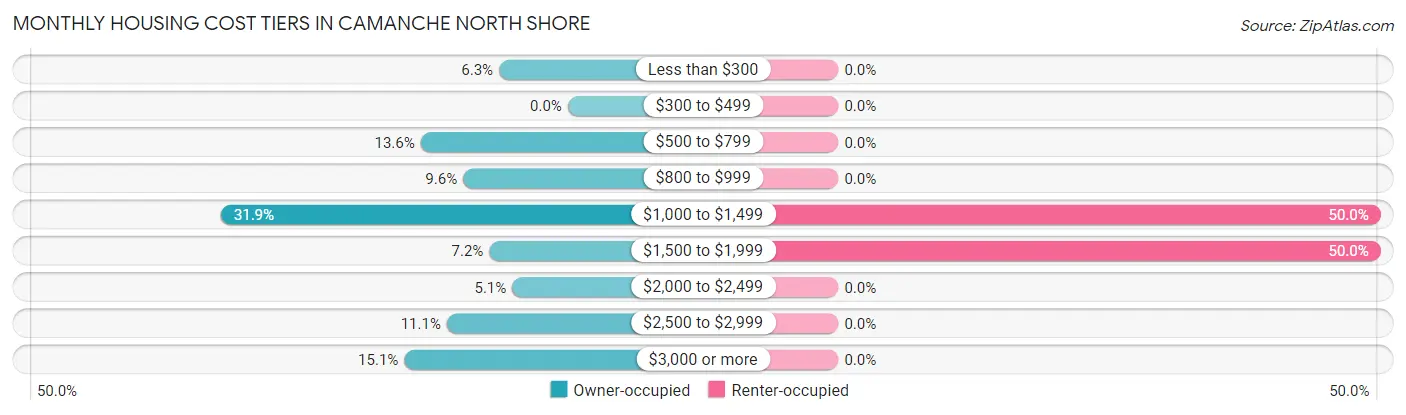
| Monthly Cost | Owner-occupied | Renter-occupied |
| Less than $300 | 21 (6.3%) | 0 (0.0%) |
| $300 to $499 | 0 (0.0%) | 0 (0.0%) |
| $500 to $799 | 45 (13.6%) | 0 (0.0%) |
| $800 to $999 | 32 (9.6%) | 0 (0.0%) |
| $1,000 to $1,499 | 106 (31.9%) | 35 (50.0%) |
| $1,500 to $1,999 | 24 (7.2%) | 35 (50.0%) |
| $2,000 to $2,499 | 17 (5.1%) | 0 (0.0%) |
| $2,500 to $2,999 | 37 (11.1%) | 0 (0.0%) |
| $3,000 or more | 50 (15.1%) | 0 (0.0%) |
| Total | 332 (100.0%) | 70 (100.0%) |
Physical Housing Characteristics in Camanche North Shore
Housing Structures in Camanche North Shore
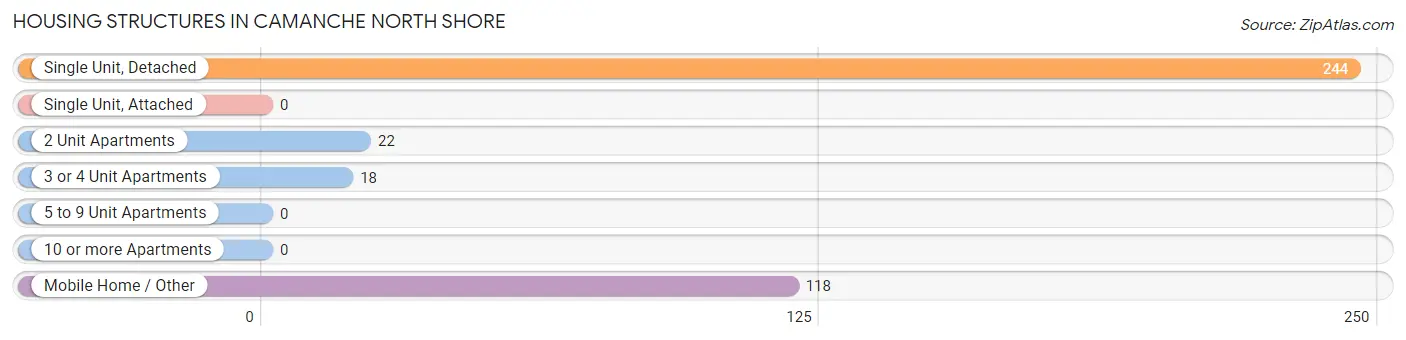
| Structure Type | # Housing Units | % Housing Units |
| Single Unit, Detached | 244 | 60.7% |
| Single Unit, Attached | 0 | 0.0% |
| 2 Unit Apartments | 22 | 5.5% |
| 3 or 4 Unit Apartments | 18 | 4.5% |
| 5 to 9 Unit Apartments | 0 | 0.0% |
| 10 or more Apartments | 0 | 0.0% |
| Mobile Home / Other | 118 | 29.3% |
| Total | 402 | 100.0% |
Housing Structures by Occupancy in Camanche North Shore
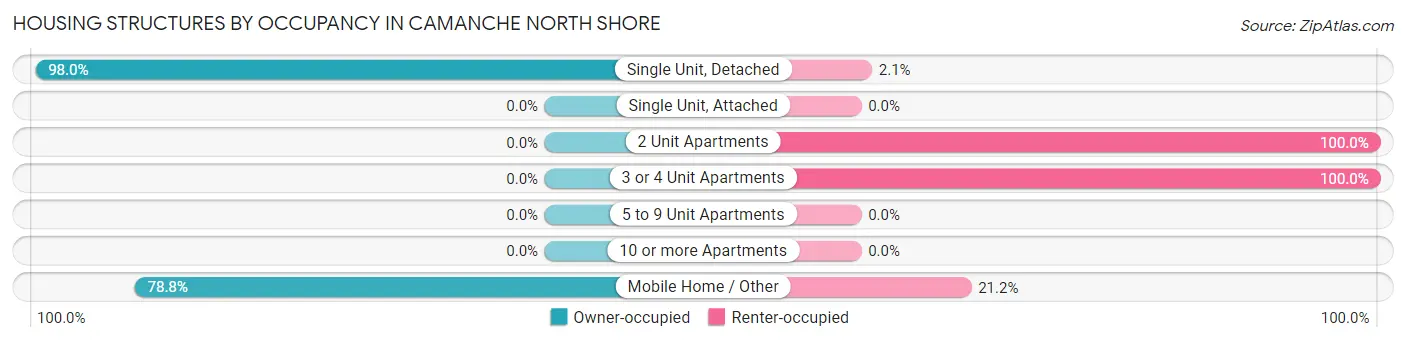
| Structure Type | Owner-occupied | Renter-occupied |
| Single Unit, Detached | 239 (98.0%) | 5 (2.1%) |
| Single Unit, Attached | 0 (0.0%) | 0 (0.0%) |
| 2 Unit Apartments | 0 (0.0%) | 22 (100.0%) |
| 3 or 4 Unit Apartments | 0 (0.0%) | 18 (100.0%) |
| 5 to 9 Unit Apartments | 0 (0.0%) | 0 (0.0%) |
| 10 or more Apartments | 0 (0.0%) | 0 (0.0%) |
| Mobile Home / Other | 93 (78.8%) | 25 (21.2%) |
| Total | 332 (82.6%) | 70 (17.4%) |
Housing Structures by Number of Rooms in Camanche North Shore
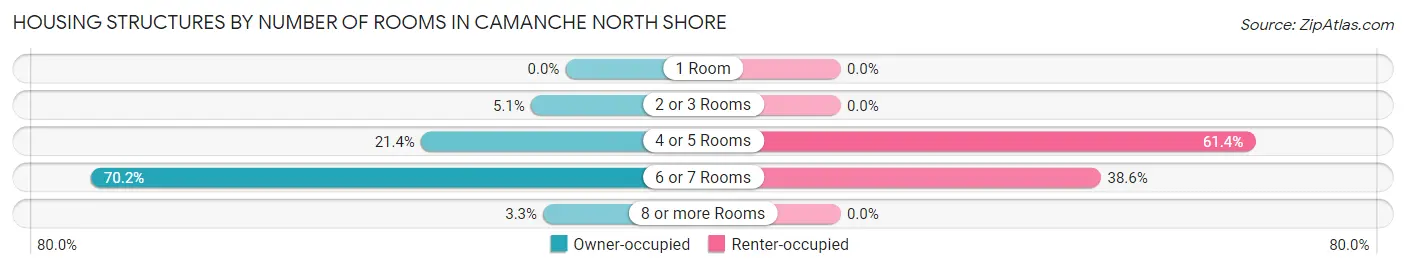
| Number of Rooms | Owner-occupied | Renter-occupied |
| 1 Room | 0 (0.0%) | 0 (0.0%) |
| 2 or 3 Rooms | 17 (5.1%) | 0 (0.0%) |
| 4 or 5 Rooms | 71 (21.4%) | 43 (61.4%) |
| 6 or 7 Rooms | 233 (70.2%) | 27 (38.6%) |
| 8 or more Rooms | 11 (3.3%) | 0 (0.0%) |
| Total | 332 (100.0%) | 70 (100.0%) |
Housing Structure by Heating Type in Camanche North Shore
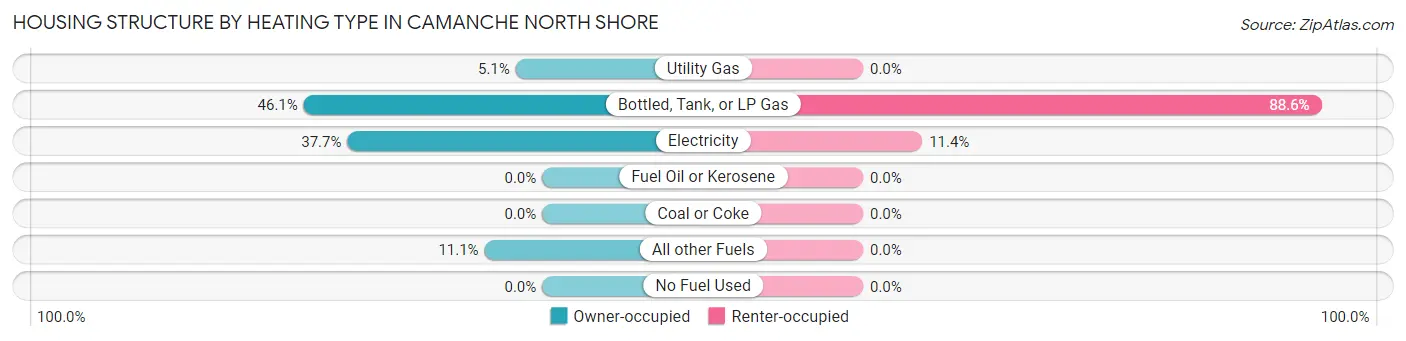
| Heating Type | Owner-occupied | Renter-occupied |
| Utility Gas | 17 (5.1%) | 0 (0.0%) |
| Bottled, Tank, or LP Gas | 153 (46.1%) | 62 (88.6%) |
| Electricity | 125 (37.7%) | 8 (11.4%) |
| Fuel Oil or Kerosene | 0 (0.0%) | 0 (0.0%) |
| Coal or Coke | 0 (0.0%) | 0 (0.0%) |
| All other Fuels | 37 (11.1%) | 0 (0.0%) |
| No Fuel Used | 0 (0.0%) | 0 (0.0%) |
| Total | 332 (100.0%) | 70 (100.0%) |
Household Vehicle Usage in Camanche North Shore
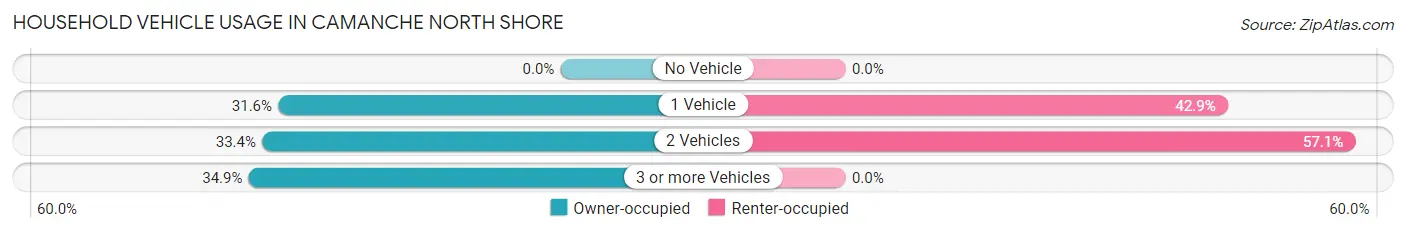
| Vehicles per Household | Owner-occupied | Renter-occupied |
| No Vehicle | 0 (0.0%) | 0 (0.0%) |
| 1 Vehicle | 105 (31.6%) | 30 (42.9%) |
| 2 Vehicles | 111 (33.4%) | 40 (57.1%) |
| 3 or more Vehicles | 116 (34.9%) | 0 (0.0%) |
| Total | 332 (100.0%) | 70 (100.0%) |
Real Estate & Mortgages in Camanche North Shore
Real Estate and Mortgage Overview in Camanche North Shore
| Characteristic | Without Mortgage | With Mortgage |
| Housing Units | 125 | 207 |
| Median Property Value | $301,100 | $352,200 |
| Median Household Income | $47,716 | $0 |
| Monthly Housing Costs | $790 | $50 |
| Real Estate Taxes | $3,217 | $16 |
Property Value by Mortgage Status in Camanche North Shore
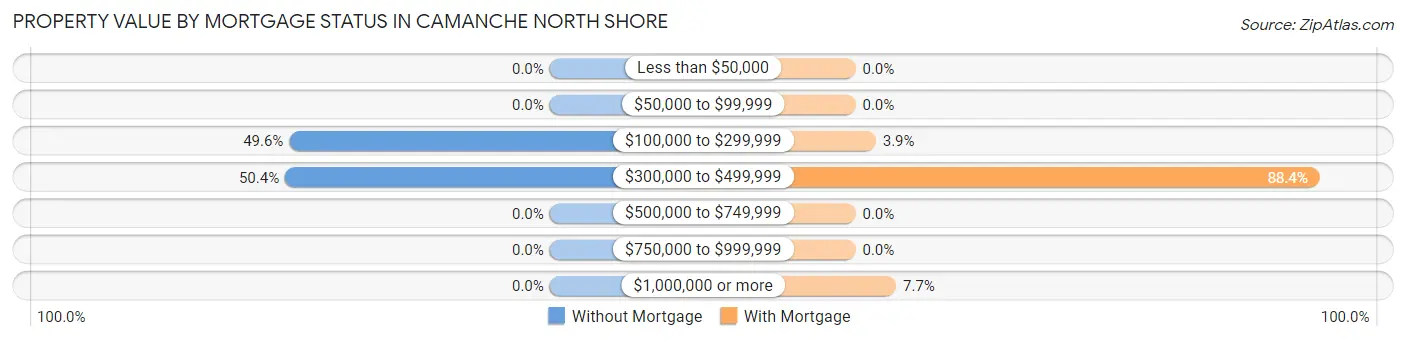
| Property Value | Without Mortgage | With Mortgage |
| Less than $50,000 | 0 (0.0%) | 0 (0.0%) |
| $50,000 to $99,999 | 0 (0.0%) | 0 (0.0%) |
| $100,000 to $299,999 | 62 (49.6%) | 8 (3.9%) |
| $300,000 to $499,999 | 63 (50.4%) | 183 (88.4%) |
| $500,000 to $749,999 | 0 (0.0%) | 0 (0.0%) |
| $750,000 to $999,999 | 0 (0.0%) | 0 (0.0%) |
| $1,000,000 or more | 0 (0.0%) | 16 (7.7%) |
| Total | 125 (100.0%) | 207 (100.0%) |
Household Income by Mortgage Status in Camanche North Shore
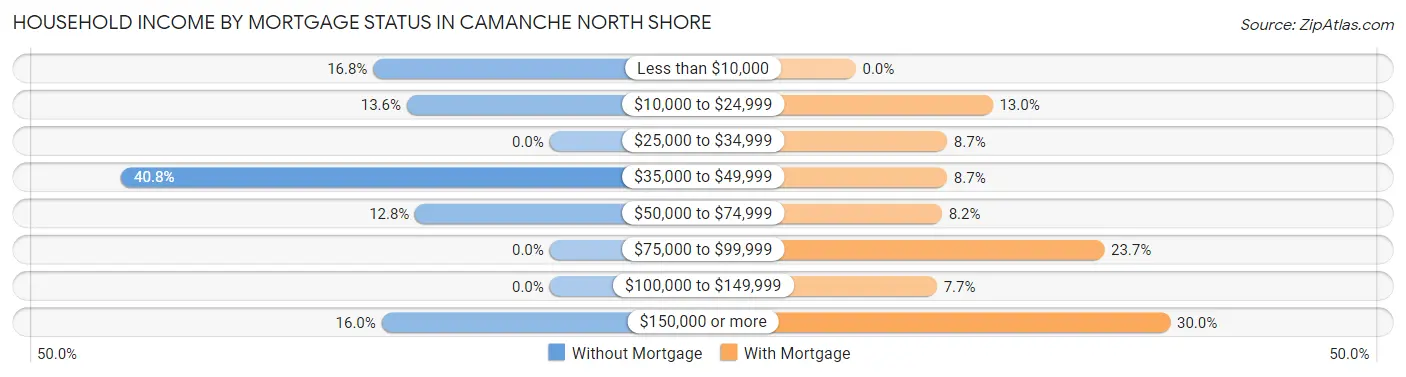
| Household Income | Without Mortgage | With Mortgage |
| Less than $10,000 | 21 (16.8%) | 0 (0.0%) |
| $10,000 to $24,999 | 17 (13.6%) | 27 (13.0%) |
| $25,000 to $34,999 | 0 (0.0%) | 18 (8.7%) |
| $35,000 to $49,999 | 51 (40.8%) | 18 (8.7%) |
| $50,000 to $74,999 | 16 (12.8%) | 17 (8.2%) |
| $75,000 to $99,999 | 0 (0.0%) | 49 (23.7%) |
| $100,000 to $149,999 | 0 (0.0%) | 16 (7.7%) |
| $150,000 or more | 20 (16.0%) | 62 (29.9%) |
| Total | 125 (100.0%) | 207 (100.0%) |
Property Value to Household Income Ratio in Camanche North Shore
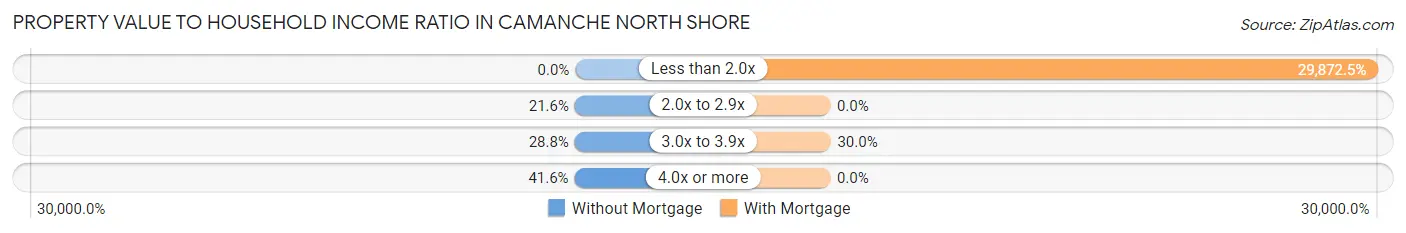
| Value-to-Income Ratio | Without Mortgage | With Mortgage |
| Less than 2.0x | 0 (0.0%) | 61,836 (29,872.5%) |
| 2.0x to 2.9x | 27 (21.6%) | 0 (0.0%) |
| 3.0x to 3.9x | 36 (28.8%) | 62 (29.9%) |
| 4.0x or more | 52 (41.6%) | 0 (0.0%) |
| Total | 125 (100.0%) | 207 (100.0%) |
Real Estate Taxes by Mortgage Status in Camanche North Shore
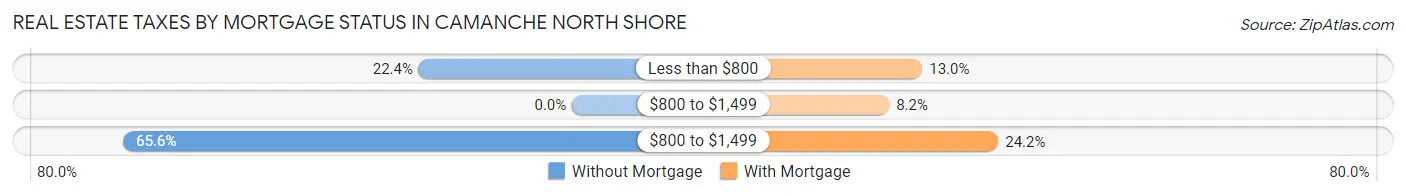
| Property Taxes | Without Mortgage | With Mortgage |
| Less than $800 | 28 (22.4%) | 27 (13.0%) |
| $800 to $1,499 | 0 (0.0%) | 17 (8.2%) |
| $800 to $1,499 | 82 (65.6%) | 50 (24.1%) |
| Total | 125 (100.0%) | 207 (100.0%) |
Health & Disability in Camanche North Shore
Health Insurance Coverage by Age in Camanche North Shore
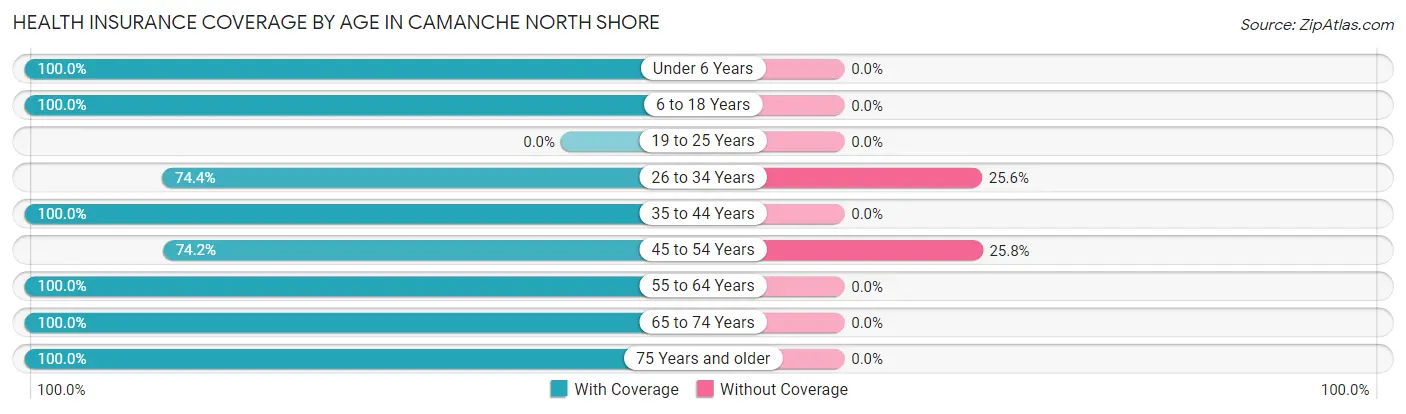
| Age Bracket | With Coverage | Without Coverage |
| Under 6 Years | 43 (100.0%) | 0 (0.0%) |
| 6 to 18 Years | 194 (100.0%) | 0 (0.0%) |
| 19 to 25 Years | 0 (0.0%) | 0 (0.0%) |
| 26 to 34 Years | 116 (74.4%) | 40 (25.6%) |
| 35 to 44 Years | 197 (100.0%) | 0 (0.0%) |
| 45 to 54 Years | 98 (74.2%) | 34 (25.8%) |
| 55 to 64 Years | 194 (100.0%) | 0 (0.0%) |
| 65 to 74 Years | 78 (100.0%) | 0 (0.0%) |
| 75 Years and older | 112 (100.0%) | 0 (0.0%) |
| Total | 1,032 (93.3%) | 74 (6.7%) |
Health Insurance Coverage by Citizenship Status in Camanche North Shore
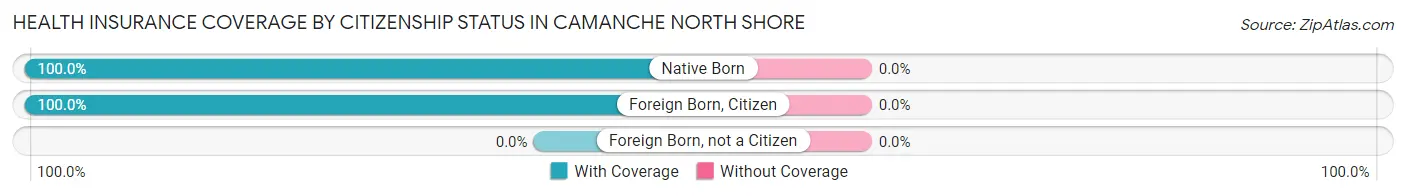
| Citizenship Status | With Coverage | Without Coverage |
| Native Born | 43 (100.0%) | 0 (0.0%) |
| Foreign Born, Citizen | 194 (100.0%) | 0 (0.0%) |
| Foreign Born, not a Citizen | 0 (0.0%) | 0 (0.0%) |
Health Insurance Coverage by Household Income in Camanche North Shore
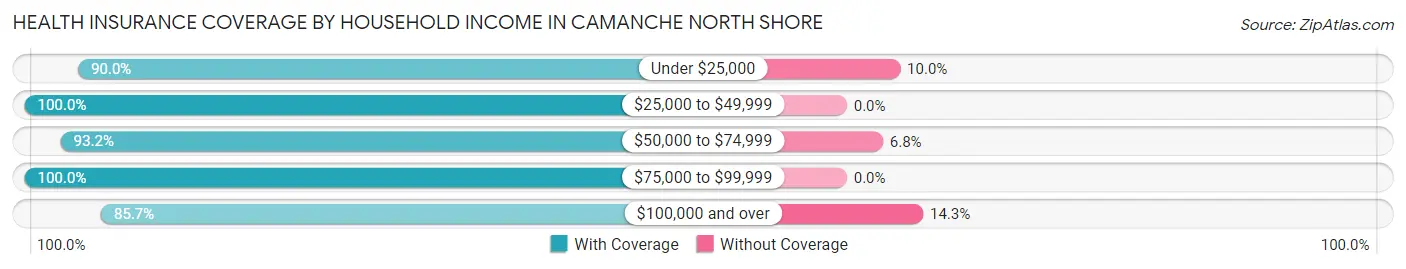
| Household Income | With Coverage | Without Coverage |
| Under $25,000 | 225 (90.0%) | 25 (10.0%) |
| $25,000 to $49,999 | 372 (100.0%) | 0 (0.0%) |
| $50,000 to $74,999 | 207 (93.2%) | 15 (6.8%) |
| $75,000 to $99,999 | 24 (100.0%) | 0 (0.0%) |
| $100,000 and over | 204 (85.7%) | 34 (14.3%) |
Public vs Private Health Insurance Coverage by Age in Camanche North Shore
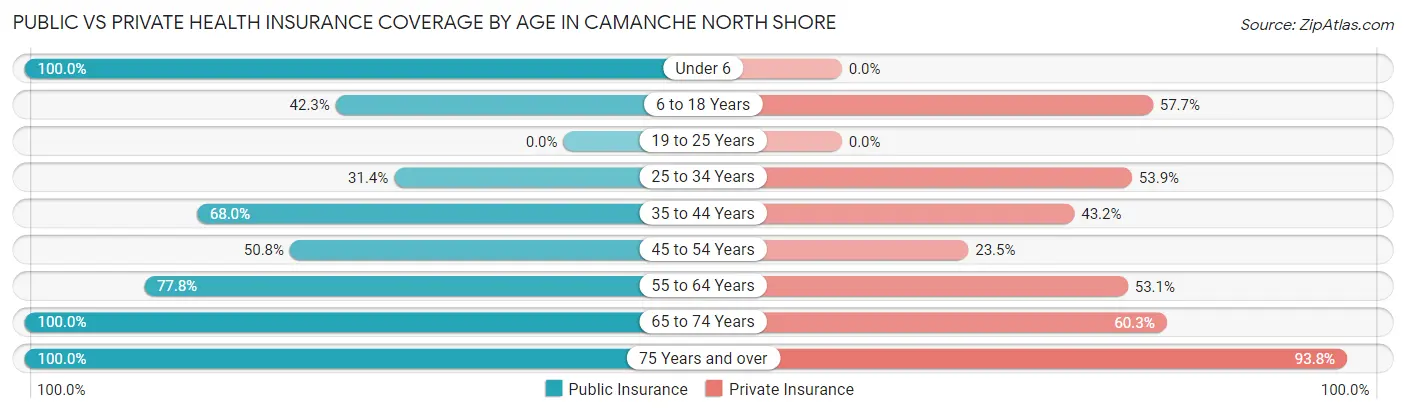
| Age Bracket | Public Insurance | Private Insurance |
| Under 6 | 43 (100.0%) | 0 (0.0%) |
| 6 to 18 Years | 82 (42.3%) | 112 (57.7%) |
| 19 to 25 Years | 0 (0.0%) | 0 (0.0%) |
| 25 to 34 Years | 49 (31.4%) | 84 (53.8%) |
| 35 to 44 Years | 134 (68.0%) | 85 (43.1%) |
| 45 to 54 Years | 67 (50.8%) | 31 (23.5%) |
| 55 to 64 Years | 151 (77.8%) | 103 (53.1%) |
| 65 to 74 Years | 78 (100.0%) | 47 (60.3%) |
| 75 Years and over | 112 (100.0%) | 105 (93.8%) |
| Total | 716 (64.7%) | 567 (51.3%) |
Disability Status by Sex by Age in Camanche North Shore
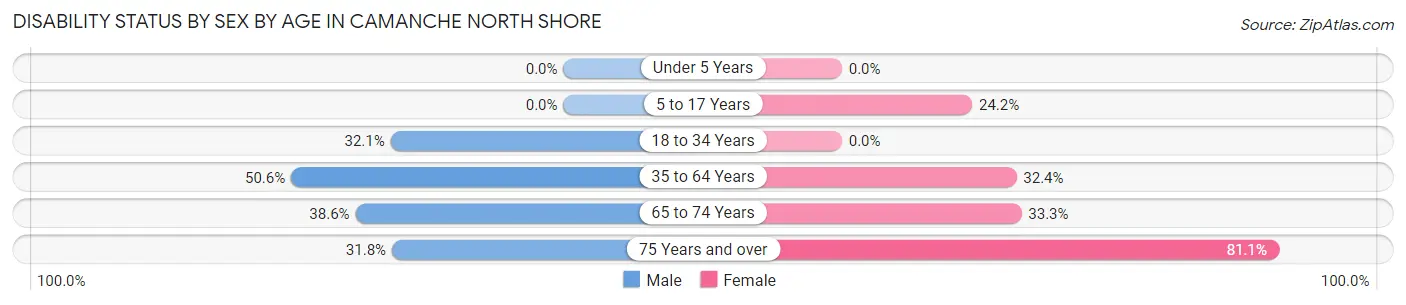
| Age Bracket | Male | Female |
| Under 5 Years | 0 (0.0%) | 0 (0.0%) |
| 5 to 17 Years | 0 (0.0%) | 29 (24.2%) |
| 18 to 34 Years | 17 (32.1%) | 0 (0.0%) |
| 35 to 64 Years | 138 (50.5%) | 81 (32.4%) |
| 65 to 74 Years | 22 (38.6%) | 7 (33.3%) |
| 75 Years and over | 7 (31.8%) | 73 (81.1%) |
Disability Class by Sex by Age in Camanche North Shore
Disability Class: Hearing Difficulty
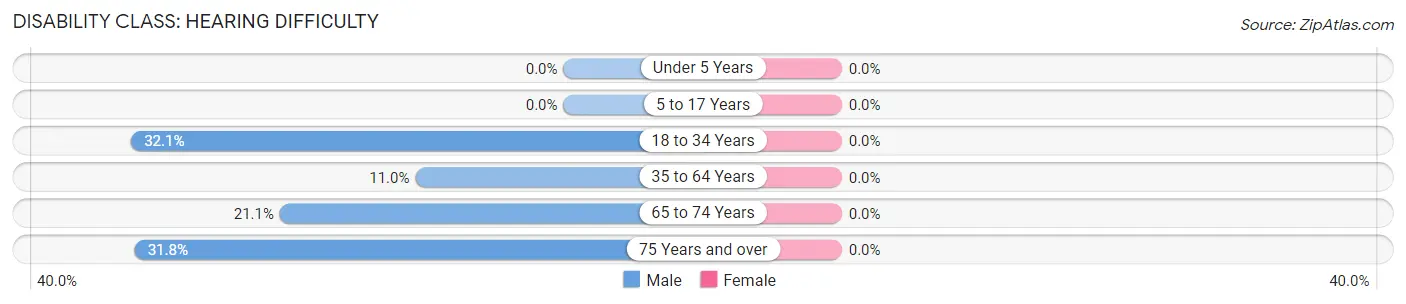
| Age Bracket | Male | Female |
| Under 5 Years | 0 (0.0%) | 0 (0.0%) |
| 5 to 17 Years | 0 (0.0%) | 0 (0.0%) |
| 18 to 34 Years | 17 (32.1%) | 0 (0.0%) |
| 35 to 64 Years | 30 (11.0%) | 0 (0.0%) |
| 65 to 74 Years | 12 (21.0%) | 0 (0.0%) |
| 75 Years and over | 7 (31.8%) | 0 (0.0%) |
Disability Class: Vision Difficulty
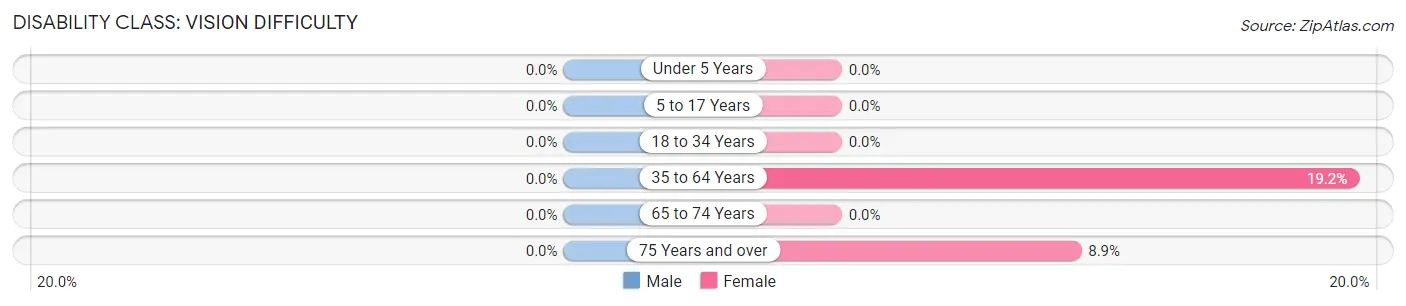
| Age Bracket | Male | Female |
| Under 5 Years | 0 (0.0%) | 0 (0.0%) |
| 5 to 17 Years | 0 (0.0%) | 0 (0.0%) |
| 18 to 34 Years | 0 (0.0%) | 0 (0.0%) |
| 35 to 64 Years | 0 (0.0%) | 48 (19.2%) |
| 65 to 74 Years | 0 (0.0%) | 0 (0.0%) |
| 75 Years and over | 0 (0.0%) | 8 (8.9%) |
Disability Class: Cognitive Difficulty
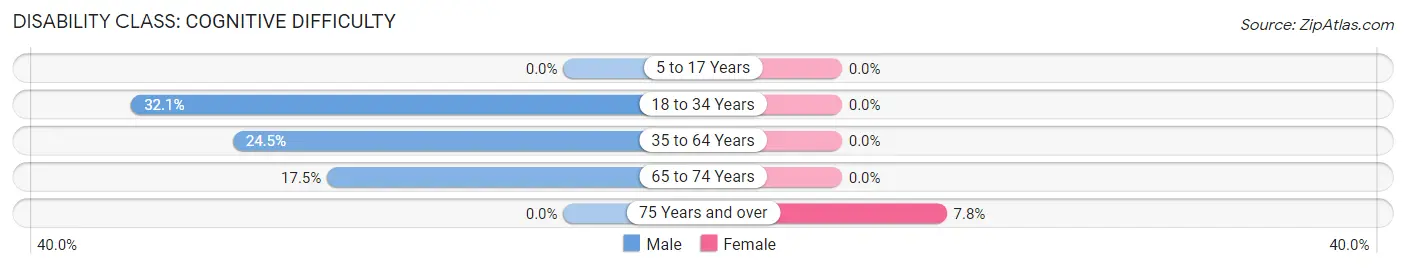
| Age Bracket | Male | Female |
| 5 to 17 Years | 0 (0.0%) | 0 (0.0%) |
| 18 to 34 Years | 17 (32.1%) | 0 (0.0%) |
| 35 to 64 Years | 67 (24.5%) | 0 (0.0%) |
| 65 to 74 Years | 10 (17.5%) | 0 (0.0%) |
| 75 Years and over | 0 (0.0%) | 7 (7.8%) |
Disability Class: Ambulatory Difficulty
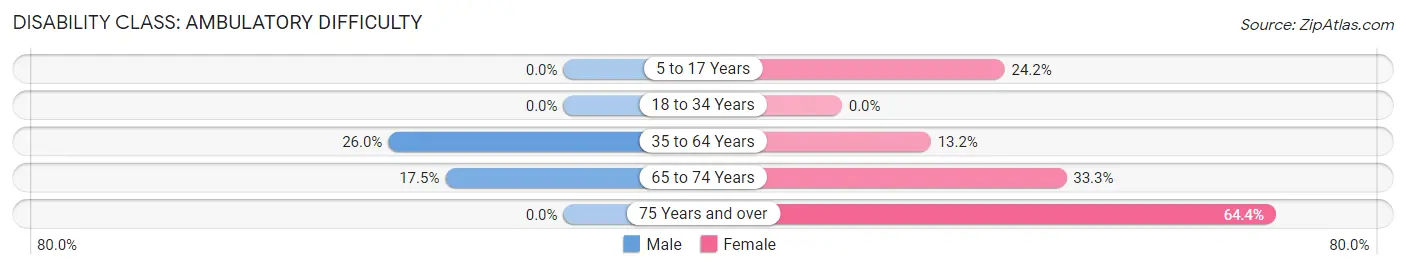
| Age Bracket | Male | Female |
| 5 to 17 Years | 0 (0.0%) | 29 (24.2%) |
| 18 to 34 Years | 0 (0.0%) | 0 (0.0%) |
| 35 to 64 Years | 71 (26.0%) | 33 (13.2%) |
| 65 to 74 Years | 10 (17.5%) | 7 (33.3%) |
| 75 Years and over | 0 (0.0%) | 58 (64.4%) |
Disability Class: Self-Care Difficulty
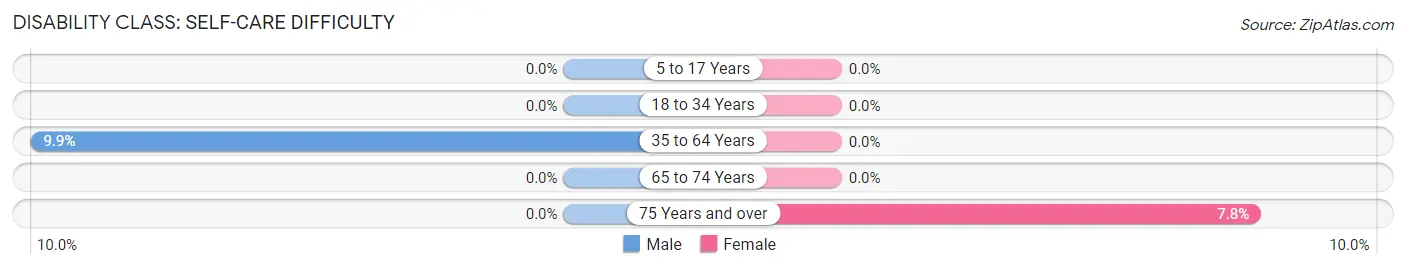
| Age Bracket | Male | Female |
| 5 to 17 Years | 0 (0.0%) | 0 (0.0%) |
| 18 to 34 Years | 0 (0.0%) | 0 (0.0%) |
| 35 to 64 Years | 27 (9.9%) | 0 (0.0%) |
| 65 to 74 Years | 0 (0.0%) | 0 (0.0%) |
| 75 Years and over | 0 (0.0%) | 7 (7.8%) |
Technology Access in Camanche North Shore
Computing Device Access in Camanche North Shore
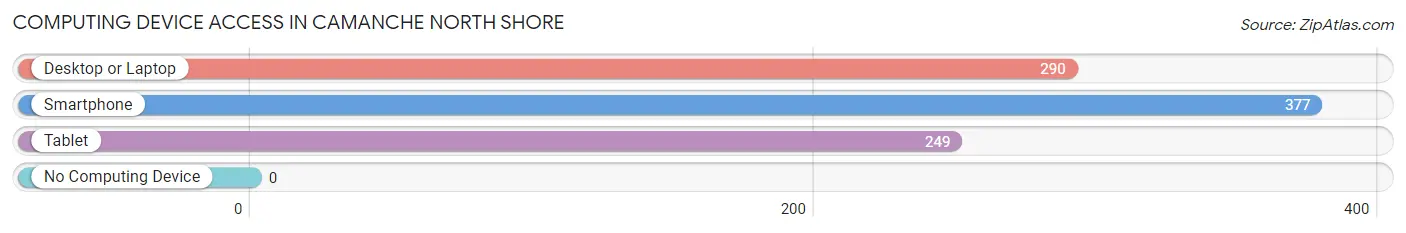
| Device Type | # Households | % Households |
| Desktop or Laptop | 290 | 72.1% |
| Smartphone | 377 | 93.8% |
| Tablet | 249 | 61.9% |
| No Computing Device | 0 | 0.0% |
| Total | 402 | 100.0% |
Internet Access in Camanche North Shore
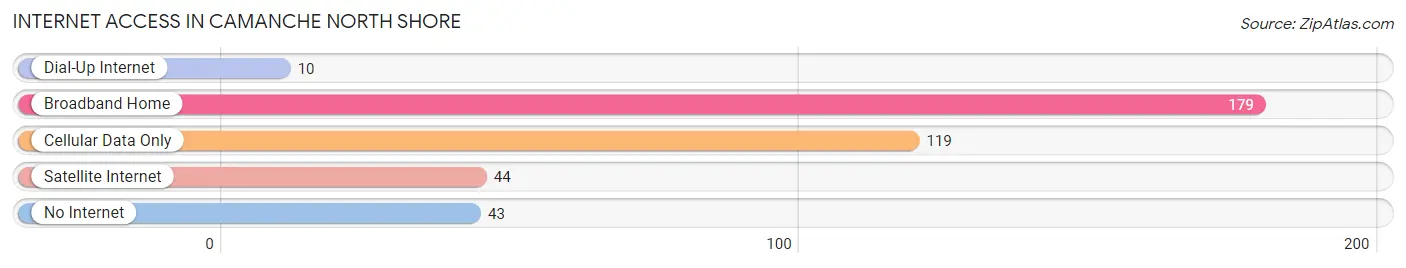
| Internet Type | # Households | % Households |
| Dial-Up Internet | 10 | 2.5% |
| Broadband Home | 179 | 44.5% |
| Cellular Data Only | 119 | 29.6% |
| Satellite Internet | 44 | 11.0% |
| No Internet | 43 | 10.7% |
| Total | 402 | 100.0% |
Camanche North Shore Summary
History
The area now known as Camanche North Shore, California was originally inhabited by the Miwok and Maidu Native American tribes. The Miwok were the first to settle in the area, and they lived in the area for thousands of years before the arrival of Europeans. The Miwok were hunter-gatherers who lived off the land, and they were known for their basket weaving and acorn grinding.
The first Europeans to arrive in the area were Spanish explorers in the late 1700s. They named the area “Camanche” after the Miwok word for “place of many trees.” The Spanish established a mission in the area in 1810, and the mission was eventually abandoned in 1834.
In the mid-1800s, the area was settled by American settlers who were drawn to the area by the gold rush. The area was known as “North Shore” because of its location on the north shore of the Mokelumne River. The area was also home to a number of Chinese immigrants who worked in the gold mines and on the railroads.
The area was officially incorporated as the City of Camanche North Shore in 1891. The city was named after the Miwok word for “place of many trees.” The city was a popular tourist destination in the early 1900s, and it was known for its beautiful scenery and outdoor activities.
Geography
Camanche North Shore is located in the Central Valley of California, about 50 miles east of Sacramento. The city is situated on the north shore of the Mokelumne River, and it is surrounded by rolling hills and oak-studded valleys. The city is located at an elevation of about 500 feet, and it has a mild climate with hot summers and cool winters.
The city covers an area of about 4.5 square miles, and it is home to a population of about 4,000 people. The city is divided into two distinct neighborhoods: the historic downtown area and the newer residential area. The downtown area is home to a number of historic buildings, including the old City Hall and the old post office.
Economy
The economy of Camanche North Shore is largely based on tourism and agriculture. The city is home to a number of wineries, and it is a popular destination for wine tasting and other outdoor activities. The city is also home to a number of small businesses, including restaurants, shops, and art galleries.
The city is also home to a number of manufacturing companies, including a furniture factory and a plastics factory. The city is also home to a number of agricultural businesses, including a dairy farm and a fruit orchard.
Demographics
As of the 2010 census, the population of Camanche North Shore was 4,000 people. The population is largely white (83.3%), with smaller percentages of Hispanic (7.3%), Asian (3.3%), and African American (2.3%) residents. The median household income in the city is $50,000, and the median home value is $250,000.
The city is served by the Camanche North Shore Unified School District, which includes two elementary schools, one middle school, and one high school. The city is also home to a number of private schools, including a Catholic school and a Montessori school.
Conclusion
Camanche North Shore, California is a small city located in the Central Valley of California. The city is known for its beautiful scenery and outdoor activities, and it is a popular destination for wine tasting and other outdoor activities. The city is home to a diverse population, and it has a strong economy based on tourism and agriculture.
Common Questions
What is Per Capita Income in Camanche North Shore?
Per Capita income in Camanche North Shore is $24,123.
What is the Median Family Income in Camanche North Shore?
Median Family Income in Camanche North Shore is $56,250.
What is the Median Household income in Camanche North Shore?
Median Household Income in Camanche North Shore is $48,974.
What is Income or Wage Gap in Camanche North Shore?
Income or Wage Gap in Camanche North Shore is 62.4%.
Women in Camanche North Shore earn 37.6 cents for every dollar earned by a man.
What is Inequality or Gini Index in Camanche North Shore?
Inequality or Gini Index in Camanche North Shore is 0.44.
What is the Total Population of Camanche North Shore?
Total Population of Camanche North Shore is 1,106.
What is the Total Male Population of Camanche North Shore?
Total Male Population of Camanche North Shore is 509.
What is the Total Female Population of Camanche North Shore?
Total Female Population of Camanche North Shore is 597.
What is the Ratio of Males per 100 Females in Camanche North Shore?
There are 85.26 Males per 100 Females in Camanche North Shore.
What is the Ratio of Females per 100 Males in Camanche North Shore?
There are 117.29 Females per 100 Males in Camanche North Shore.
What is the Median Population Age in Camanche North Shore?
Median Population Age in Camanche North Shore is 39.9 Years.
What is the Average Family Size in Camanche North Shore
Average Family Size in Camanche North Shore is 3.5 People.
What is the Average Household Size in Camanche North Shore
Average Household Size in Camanche North Shore is 2.8 People.
How Large is the Labor Force in Camanche North Shore?
There are 351 People in the Labor Forcein in Camanche North Shore.
What is the Percentage of People in the Labor Force in Camanche North Shore?
38.3% of People are in the Labor Force in Camanche North Shore.
What is the Unemployment Rate in Camanche North Shore?
Unemployment Rate in Camanche North Shore is 7.4%.