Zip Codes with the Highest Percentage of Population Employed in Installation, Maintenance & Repair in Inglewood, CA
RELATED REPORTS & OPTIONS
Installation, Maintenance & Repair
Inglewood
Compare Zip Codes
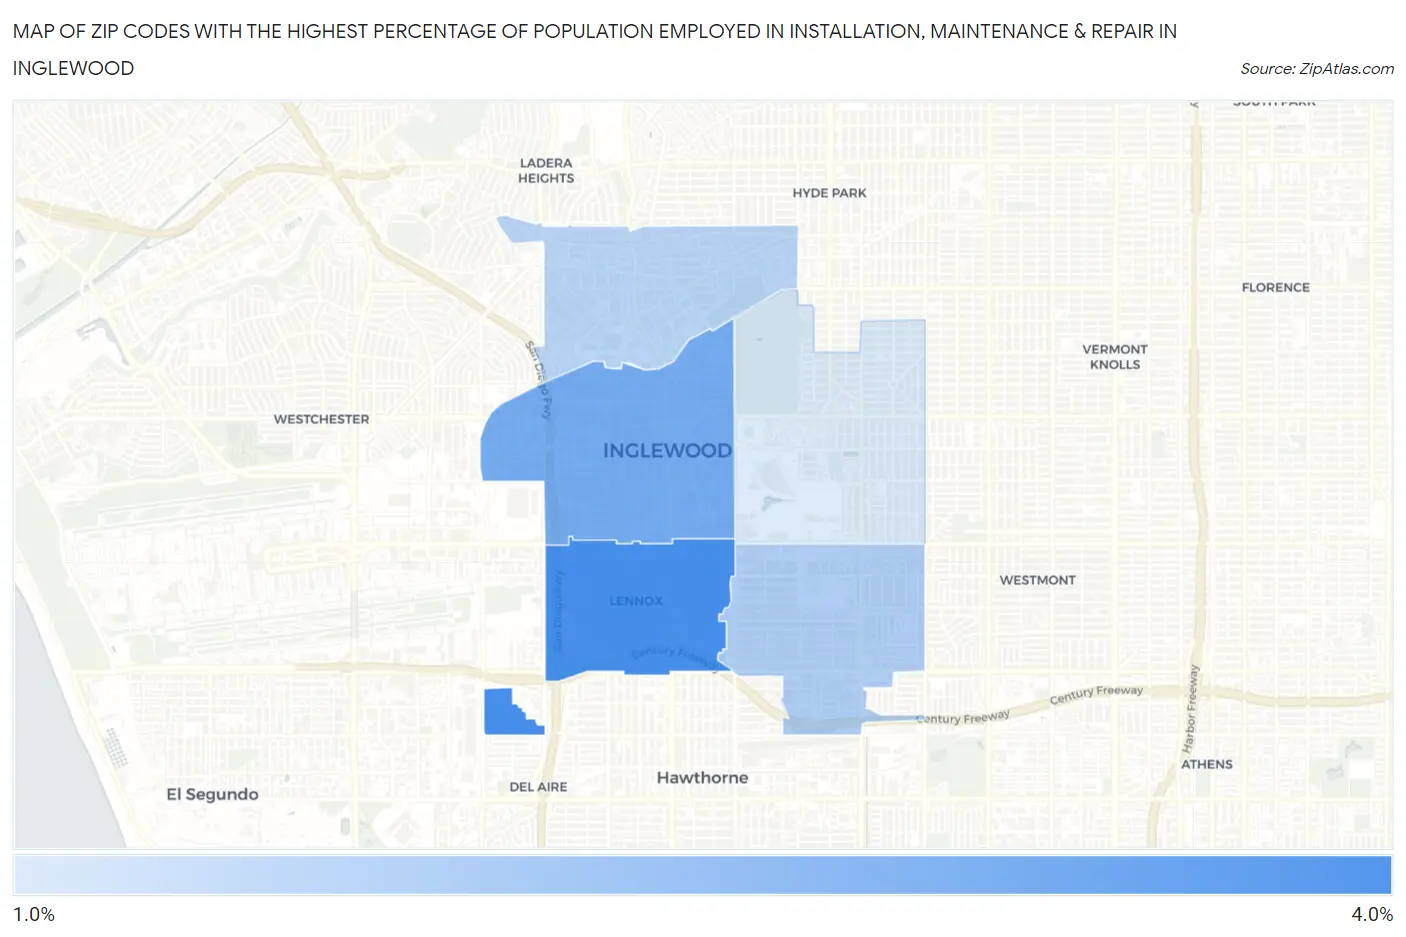
Map of Zip Codes with the Highest Percentage of Population Employed in Installation, Maintenance & Repair in Inglewood
1.4%
3.1%
Zip Codes with the Highest Percentage of Population Employed in Installation, Maintenance & Repair in Inglewood, CA
| Zip Code | % Employed | vs State | vs National | |
| 1. | 90304 | 3.1% | 2.6%(+0.547)#562 | 3.1%(+0.036)#16,508 |
| 2. | 90301 | 2.6% | 2.6%(+0.014)#760 | 3.1%(-0.497)#19,223 |
| 3. | 90303 | 1.9% | 2.6%(-0.623)#996 | 3.1%(-1.13)#22,322 |
| 4. | 90302 | 1.8% | 2.6%(-0.763)#1,032 | 3.1%(-1.27)#22,923 |
| 5. | 90305 | 1.4% | 2.6%(-1.15)#1,144 | 3.1%(-1.66)#24,529 |
1
Common Questions
What are the Top 3 Zip Codes with the Highest Percentage of Population Employed in Installation, Maintenance & Repair in Inglewood, CA?
Top 3 Zip Codes with the Highest Percentage of Population Employed in Installation, Maintenance & Repair in Inglewood, CA are:
What zip code has the Highest Percentage of Population Employed in Installation, Maintenance & Repair in Inglewood, CA?
90304 has the Highest Percentage of Population Employed in Installation, Maintenance & Repair in Inglewood, CA with 3.1%.
What is the Percentage of Population Employed in Installation, Maintenance & Repair in Inglewood, CA?
Percentage of Population Employed in Installation, Maintenance & Repair in Inglewood is 2.1%.
What is the Percentage of Population Employed in Installation, Maintenance & Repair in California?
Percentage of Population Employed in Installation, Maintenance & Repair in California is 2.6%.
What is the Percentage of Population Employed in Installation, Maintenance & Repair in the United States?
Percentage of Population Employed in Installation, Maintenance & Repair in the United States is 3.1%.