Cities with the Most Immigrants from Ecuador in California
RELATED REPORTS & OPTIONS
Ecuador
California
Compare Cities
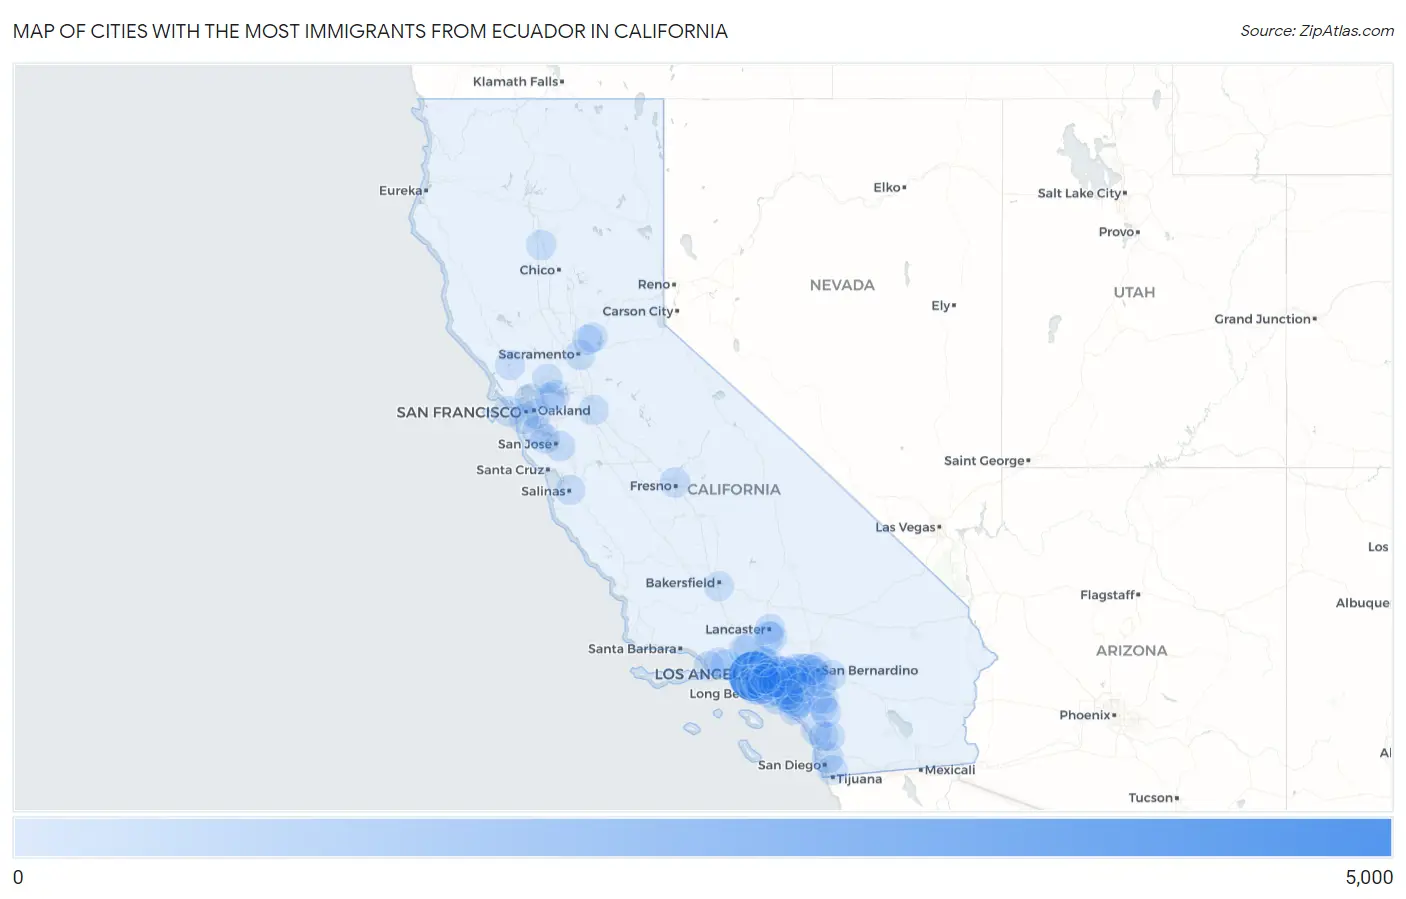
Map of Cities with the Most Immigrants from Ecuador in California
0
5,000
Cities with the Most Immigrants from Ecuador in California
| City | Ecuador | vs State | vs National | |
| 1. | Los Angeles | 4,496 | 21,276(21.13%)#1 | 480,873(0.93%)#6 |
| 2. | Fontana | 490 | 21,276(2.30%)#2 | 480,873(0.10%)#110 |
| 3. | San Diego | 397 | 21,276(1.87%)#3 | 480,873(0.08%)#136 |
| 4. | Torrance | 369 | 21,276(1.73%)#4 | 480,873(0.08%)#144 |
| 5. | Santa Ana | 328 | 21,276(1.54%)#5 | 480,873(0.07%)#163 |
| 6. | West Covina | 319 | 21,276(1.50%)#6 | 480,873(0.07%)#168 |
| 7. | Downey | 291 | 21,276(1.37%)#7 | 480,873(0.06%)#187 |
| 8. | Palmdale | 289 | 21,276(1.36%)#8 | 480,873(0.06%)#189 |
| 9. | Thousand Oaks | 263 | 21,276(1.24%)#9 | 480,873(0.05%)#204 |
| 10. | Huntington Beach | 262 | 21,276(1.23%)#10 | 480,873(0.05%)#205 |
| 11. | Pasadena | 244 | 21,276(1.15%)#11 | 480,873(0.05%)#220 |
| 12. | Anaheim | 233 | 21,276(1.10%)#12 | 480,873(0.05%)#236 |
| 13. | Fullerton | 233 | 21,276(1.10%)#13 | 480,873(0.05%)#237 |
| 14. | Santa Clarita | 208 | 21,276(0.98%)#14 | 480,873(0.04%)#268 |
| 15. | Glendale | 196 | 21,276(0.92%)#15 | 480,873(0.04%)#280 |
| 16. | Oceanside | 182 | 21,276(0.86%)#16 | 480,873(0.04%)#301 |
| 17. | Long Beach | 179 | 21,276(0.84%)#17 | 480,873(0.04%)#309 |
| 18. | Beverly Hills | 171 | 21,276(0.80%)#18 | 480,873(0.04%)#317 |
| 19. | South Gate | 159 | 21,276(0.75%)#19 | 480,873(0.03%)#339 |
| 20. | Lake Elsinore | 158 | 21,276(0.74%)#20 | 480,873(0.03%)#343 |
| 21. | San Francisco | 154 | 21,276(0.72%)#21 | 480,873(0.03%)#356 |
| 22. | La Habra | 147 | 21,276(0.69%)#22 | 480,873(0.03%)#372 |
| 23. | Whittier | 145 | 21,276(0.68%)#23 | 480,873(0.03%)#376 |
| 24. | Fresno | 139 | 21,276(0.65%)#24 | 480,873(0.03%)#394 |
| 25. | Gardena | 138 | 21,276(0.65%)#25 | 480,873(0.03%)#397 |
| 26. | Bell | 138 | 21,276(0.65%)#26 | 480,873(0.03%)#398 |
| 27. | Port Hueneme | 134 | 21,276(0.63%)#27 | 480,873(0.03%)#407 |
| 28. | Ontario | 133 | 21,276(0.63%)#28 | 480,873(0.03%)#410 |
| 29. | San Jose | 128 | 21,276(0.60%)#29 | 480,873(0.03%)#423 |
| 30. | Rowland Heights | 128 | 21,276(0.60%)#30 | 480,873(0.03%)#424 |
| 31. | Redwood City | 126 | 21,276(0.59%)#31 | 480,873(0.03%)#430 |
| 32. | Alhambra | 126 | 21,276(0.59%)#32 | 480,873(0.03%)#431 |
| 33. | Baldwin Park | 119 | 21,276(0.56%)#33 | 480,873(0.02%)#449 |
| 34. | Rancho Cucamonga | 118 | 21,276(0.55%)#34 | 480,873(0.02%)#451 |
| 35. | Sacramento | 113 | 21,276(0.53%)#35 | 480,873(0.02%)#465 |
| 36. | Hacienda Heights | 111 | 21,276(0.52%)#36 | 480,873(0.02%)#471 |
| 37. | Oakland | 108 | 21,276(0.51%)#37 | 480,873(0.02%)#479 |
| 38. | Camp Pendleton Mainside | 106 | 21,276(0.50%)#38 | 480,873(0.02%)#487 |
| 39. | Escondido | 105 | 21,276(0.49%)#39 | 480,873(0.02%)#488 |
| 40. | San Bernardino | 104 | 21,276(0.49%)#40 | 480,873(0.02%)#493 |
| 41. | Hawthorne | 103 | 21,276(0.48%)#41 | 480,873(0.02%)#499 |
| 42. | Inglewood | 98 | 21,276(0.46%)#42 | 480,873(0.02%)#513 |
| 43. | Eastvale | 98 | 21,276(0.46%)#43 | 480,873(0.02%)#514 |
| 44. | Montebello | 98 | 21,276(0.46%)#44 | 480,873(0.02%)#515 |
| 45. | Maywood | 98 | 21,276(0.46%)#45 | 480,873(0.02%)#516 |
| 46. | Stanton | 97 | 21,276(0.46%)#46 | 480,873(0.02%)#518 |
| 47. | Menifee | 96 | 21,276(0.45%)#47 | 480,873(0.02%)#522 |
| 48. | Mission Viejo | 96 | 21,276(0.45%)#48 | 480,873(0.02%)#523 |
| 49. | Chula Vista | 94 | 21,276(0.44%)#49 | 480,873(0.02%)#530 |
| 50. | Mountain View | 92 | 21,276(0.43%)#50 | 480,873(0.02%)#536 |
| 51. | West Carson | 92 | 21,276(0.43%)#51 | 480,873(0.02%)#540 |
| 52. | Desert View Highlands | 89 | 21,276(0.42%)#52 | 480,873(0.02%)#558 |
| 53. | Roseville | 88 | 21,276(0.41%)#53 | 480,873(0.02%)#559 |
| 54. | Lake Forest | 88 | 21,276(0.41%)#54 | 480,873(0.02%)#560 |
| 55. | Daly City | 87 | 21,276(0.41%)#55 | 480,873(0.02%)#563 |
| 56. | Upland | 87 | 21,276(0.41%)#56 | 480,873(0.02%)#564 |
| 57. | Rancho Santa Margarita | 86 | 21,276(0.40%)#57 | 480,873(0.02%)#567 |
| 58. | Colton | 85 | 21,276(0.40%)#58 | 480,873(0.02%)#573 |
| 59. | Murrieta | 83 | 21,276(0.39%)#59 | 480,873(0.02%)#585 |
| 60. | Riverside | 80 | 21,276(0.38%)#60 | 480,873(0.02%)#596 |
| 61. | Manteca | 80 | 21,276(0.38%)#61 | 480,873(0.02%)#597 |
| 62. | Yucaipa | 80 | 21,276(0.38%)#62 | 480,873(0.02%)#598 |
| 63. | Cerritos | 80 | 21,276(0.38%)#63 | 480,873(0.02%)#599 |
| 64. | Santa Rosa | 79 | 21,276(0.37%)#64 | 480,873(0.02%)#602 |
| 65. | Villa Park | 78 | 21,276(0.37%)#65 | 480,873(0.02%)#609 |
| 66. | Gerber | 77 | 21,276(0.36%)#66 | 480,873(0.02%)#618 |
| 67. | Salinas | 76 | 21,276(0.36%)#67 | 480,873(0.02%)#622 |
| 68. | Temecula | 76 | 21,276(0.36%)#68 | 480,873(0.02%)#623 |
| 69. | Carson | 75 | 21,276(0.35%)#69 | 480,873(0.02%)#628 |
| 70. | Valinda | 75 | 21,276(0.35%)#70 | 480,873(0.02%)#633 |
| 71. | San Marcos | 73 | 21,276(0.34%)#71 | 480,873(0.02%)#641 |
| 72. | Westmont | 73 | 21,276(0.34%)#72 | 480,873(0.02%)#643 |
| 73. | Irvine | 70 | 21,276(0.33%)#73 | 480,873(0.01%)#660 |
| 74. | Moreno Valley | 70 | 21,276(0.33%)#74 | 480,873(0.01%)#663 |
| 75. | Richmond | 70 | 21,276(0.33%)#75 | 480,873(0.01%)#664 |
| 76. | Norwalk | 68 | 21,276(0.32%)#76 | 480,873(0.01%)#683 |
| 77. | Camarillo | 68 | 21,276(0.32%)#77 | 480,873(0.01%)#684 |
| 78. | Montclair | 68 | 21,276(0.32%)#78 | 480,873(0.01%)#686 |
| 79. | Lancaster | 67 | 21,276(0.31%)#79 | 480,873(0.01%)#692 |
| 80. | Pittsburg | 66 | 21,276(0.31%)#80 | 480,873(0.01%)#705 |
| 81. | Monterey Park | 66 | 21,276(0.31%)#81 | 480,873(0.01%)#706 |
| 82. | Bakersfield | 65 | 21,276(0.31%)#82 | 480,873(0.01%)#712 |
| 83. | Laguna Niguel | 65 | 21,276(0.31%)#83 | 480,873(0.01%)#718 |
| 84. | Concord | 63 | 21,276(0.30%)#84 | 480,873(0.01%)#732 |
| 85. | Stevenson Ranch | 62 | 21,276(0.29%)#85 | 480,873(0.01%)#740 |
| 86. | East Los Angeles | 60 | 21,276(0.28%)#86 | 480,873(0.01%)#753 |
| 87. | Chino | 60 | 21,276(0.28%)#87 | 480,873(0.01%)#754 |
| 88. | Bellflower | 60 | 21,276(0.28%)#88 | 480,873(0.01%)#755 |
| 89. | El Segundo | 60 | 21,276(0.28%)#89 | 480,873(0.01%)#760 |
| 90. | Covina | 59 | 21,276(0.28%)#90 | 480,873(0.01%)#766 |
| 91. | Santa Fe Springs | 59 | 21,276(0.28%)#91 | 480,873(0.01%)#769 |
| 92. | Rialto | 57 | 21,276(0.27%)#92 | 480,873(0.01%)#780 |
| 93. | Chino Hills | 57 | 21,276(0.27%)#93 | 480,873(0.01%)#781 |
| 94. | East Whittier | 57 | 21,276(0.27%)#94 | 480,873(0.01%)#787 |
| 95. | Corona | 56 | 21,276(0.26%)#95 | 480,873(0.01%)#790 |
| 96. | Fairfield | 55 | 21,276(0.26%)#96 | 480,873(0.01%)#801 |
| 97. | Tustin | 55 | 21,276(0.26%)#97 | 480,873(0.01%)#803 |
| 98. | La Crescenta Montrose | 55 | 21,276(0.26%)#98 | 480,873(0.01%)#805 |
| 99. | Rocklin | 54 | 21,276(0.25%)#99 | 480,873(0.01%)#817 |
| 100. | Huntington Park | 54 | 21,276(0.25%)#100 | 480,873(0.01%)#818 |
Common Questions
What are the Top 10 Cities with the Most Immigrants from Ecuador in California?
Top 10 Cities with the Most Immigrants from Ecuador in California are:
#1
4,496
#2
490
#3
397
#4
369
#5
328
#6
319
#7
291
#8
289
#9
263
#10
262
What city has the Most Immigrants from Ecuador in California?
Los Angeles has the Most Immigrants from Ecuador in California with 4,496.
What is the Total Immigrants from Ecuador in the State of California?
Total Immigrants from Ecuador in California is 21,276.
What is the Total Immigrants from Ecuador in the United States?
Total Immigrants from Ecuador in the United States is 480,873.