Cities with the Highest Percentage of Immigrants from Honduras in California
RELATED REPORTS & OPTIONS
Honduras
California
Compare Cities
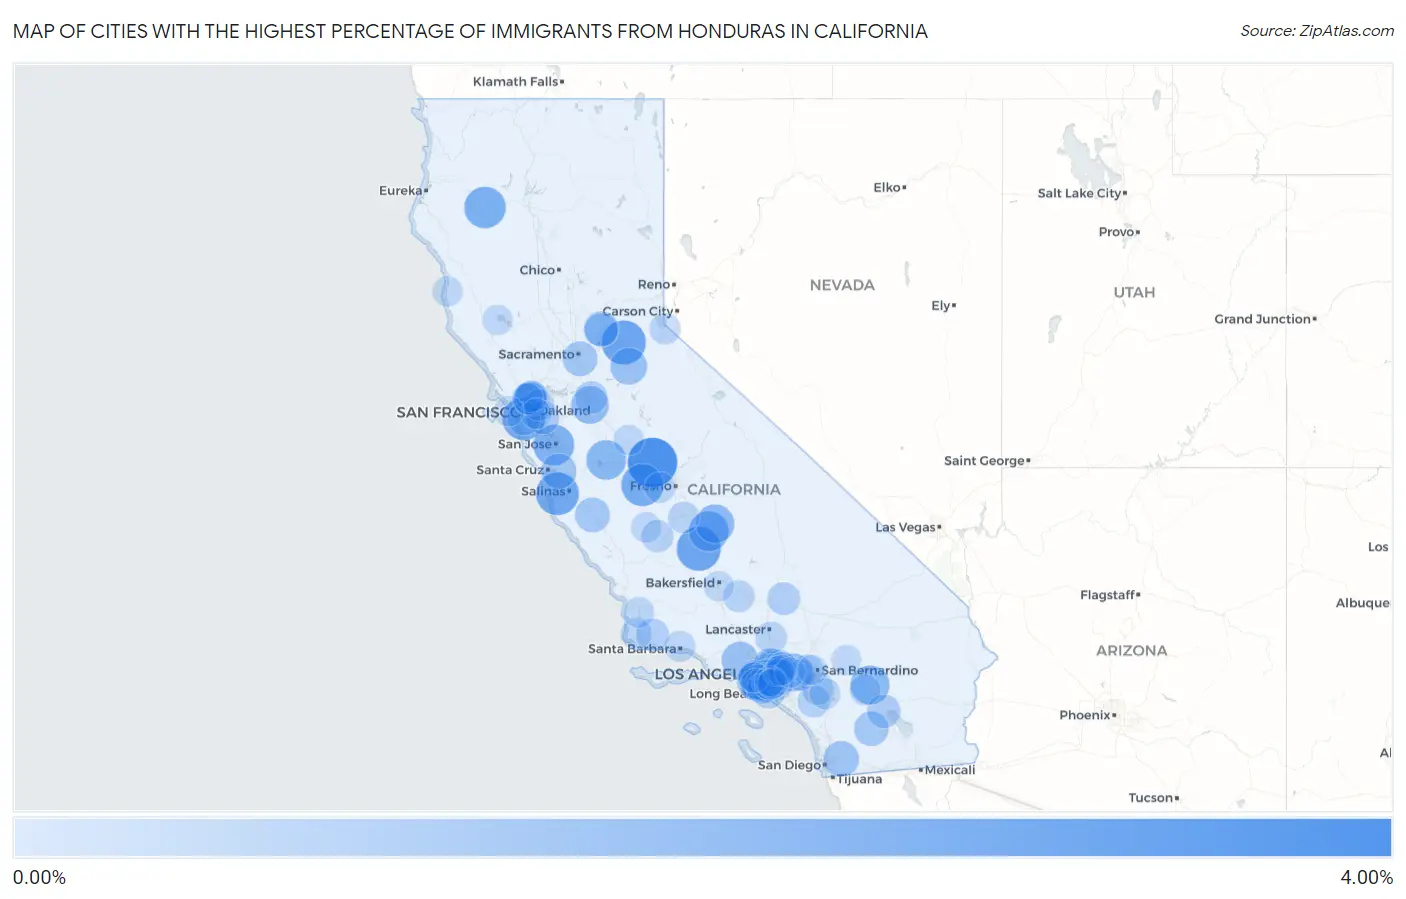
Map of Cities with the Highest Percentage of Immigrants from Honduras in California
0.00%
4.00%
Cities with the Highest Percentage of Immigrants from Honduras in California
| City | Honduras | vs State | vs National | |
| 1. | Fairmead | 3.25% | 0.17%(+3.08)#-1 | 0.22%(+3.03)#0 |
| 2. | Camino | 2.40% | 0.17%(+2.23)#0 | 0.22%(+2.18)#1 |
| 3. | Allensworth | 2.40% | 0.17%(+2.23)#1 | 0.22%(+2.18)#2 |
| 4. | Sand City | 2.19% | 0.17%(+2.03)#2 | 0.22%(+1.97)#3 |
| 5. | Colma | 2.18% | 0.17%(+2.01)#3 | 0.22%(+1.96)#4 |
| 6. | Mendota | 2.10% | 0.17%(+1.93)#4 | 0.22%(+1.88)#5 |
| 7. | Hayfork | 1.98% | 0.17%(+1.81)#5 | 0.22%(+1.76)#6 |
| 8. | Fruitdale | 1.89% | 0.17%(+1.72)#6 | 0.22%(+1.67)#7 |
| 9. | Westmont | 1.82% | 0.17%(+1.66)#7 | 0.22%(+1.61)#8 |
| 10. | Woodville | 1.75% | 0.17%(+1.58)#8 | 0.22%(+1.53)#9 |
| 11. | Santa Nella | 1.70% | 0.17%(+1.53)#9 | 0.22%(+1.48)#10 |
| 12. | Sky Valley | 1.60% | 0.17%(+1.43)#10 | 0.22%(+1.38)#11 |
| 13. | Lindsay | 1.53% | 0.17%(+1.36)#11 | 0.22%(+1.31)#12 |
| 14. | Lennox | 1.45% | 0.17%(+1.28)#12 | 0.22%(+1.23)#13 |
| 15. | Willowbrook | 1.43% | 0.17%(+1.26)#13 | 0.22%(+1.21)#14 |
| 16. | Montclair | 1.40% | 0.17%(+1.23)#14 | 0.22%(+1.18)#15 |
| 17. | French Camp | 1.40% | 0.17%(+1.23)#15 | 0.22%(+1.18)#16 |
| 18. | East Pasadena | 1.26% | 0.17%(+1.09)#16 | 0.22%(+1.04)#17 |
| 19. | Red Corral | 1.26% | 0.17%(+1.09)#17 | 0.22%(+1.04)#18 |
| 20. | Santa Susana | 1.24% | 0.17%(+1.07)#18 | 0.22%(+1.02)#19 |
| 21. | Huntington Park | 1.14% | 0.17%(+0.967)#19 | 0.22%(+0.917)#20 |
| 22. | Crest | 1.07% | 0.17%(+0.900)#20 | 0.22%(+0.850)#21 |
| 23. | Aptos Hills Larkin Valley | 1.03% | 0.17%(+0.862)#21 | 0.22%(+0.811)#22 |
| 24. | Lemon Hill | 0.97% | 0.17%(+0.802)#22 | 0.22%(+0.752)#23 |
| 25. | Greenfield | 0.96% | 0.17%(+0.794)#23 | 0.22%(+0.744)#24 |
| 26. | Lynwood | 0.95% | 0.17%(+0.785)#24 | 0.22%(+0.734)#25 |
| 27. | North Auburn | 0.95% | 0.17%(+0.782)#25 | 0.22%(+0.732)#26 |
| 28. | Rollingwood | 0.95% | 0.17%(+0.778)#26 | 0.22%(+0.728)#27 |
| 29. | South Gate | 0.94% | 0.17%(+0.770)#27 | 0.22%(+0.720)#28 |
| 30. | East Rancho Dominguez | 0.92% | 0.17%(+0.755)#28 | 0.22%(+0.705)#29 |
| 31. | Borrego Springs | 0.92% | 0.17%(+0.747)#29 | 0.22%(+0.697)#30 |
| 32. | Bell | 0.89% | 0.17%(+0.721)#30 | 0.22%(+0.670)#31 |
| 33. | Florence Graham | 0.87% | 0.17%(+0.702)#31 | 0.22%(+0.652)#32 |
| 34. | La Mirada | 0.78% | 0.17%(+0.612)#32 | 0.22%(+0.561)#33 |
| 35. | San Pablo | 0.76% | 0.17%(+0.586)#33 | 0.22%(+0.536)#181 |
| 36. | Auburn | 0.75% | 0.17%(+0.579)#34 | 0.22%(+0.528)#182 |
| 37. | Ashland | 0.74% | 0.17%(+0.573)#35 | 0.22%(+0.523)#183 |
| 38. | Oasis | 0.74% | 0.17%(+0.573)#36 | 0.22%(+0.522)#184 |
| 39. | Pasadena | 0.74% | 0.17%(+0.572)#37 | 0.22%(+0.522)#185 |
| 40. | Daly City | 0.71% | 0.17%(+0.539)#38 | 0.22%(+0.489)#186 |
| 41. | Compton | 0.67% | 0.17%(+0.506)#39 | 0.22%(+0.455)#187 |
| 42. | Buellton | 0.66% | 0.17%(+0.491)#40 | 0.22%(+0.440)#188 |
| 43. | California City | 0.65% | 0.17%(+0.484)#41 | 0.22%(+0.434)#189 |
| 44. | August | 0.63% | 0.17%(+0.458)#42 | 0.22%(+0.407)#190 |
| 45. | Montebello | 0.61% | 0.17%(+0.442)#43 | 0.22%(+0.391)#191 |
| 46. | Duarte | 0.59% | 0.17%(+0.421)#44 | 0.22%(+0.371)#192 |
| 47. | Lakeland Village | 0.59% | 0.17%(+0.418)#45 | 0.22%(+0.367)#193 |
| 48. | Mead Valley | 0.56% | 0.17%(+0.390)#46 | 0.22%(+0.339)#194 |
| 49. | Lawndale | 0.56% | 0.17%(+0.389)#47 | 0.22%(+0.338)#195 |
| 50. | Richmond | 0.55% | 0.17%(+0.382)#48 | 0.22%(+0.331)#196 |
| 51. | Long Beach | 0.55% | 0.17%(+0.381)#49 | 0.22%(+0.331)#253 |
| 52. | Avenal | 0.54% | 0.17%(+0.367)#50 | 0.22%(+0.317)#254 |
| 53. | San Pasqual | 0.52% | 0.17%(+0.348)#51 | 0.22%(+0.297)#255 |
| 54. | El Monte | 0.51% | 0.17%(+0.345)#52 | 0.22%(+0.295)#256 |
| 55. | Los Angeles | 0.51% | 0.17%(+0.336)#53 | 0.22%(+0.286)#281 |
| 56. | Bear Valley Springs | 0.50% | 0.17%(+0.331)#54 | 0.22%(+0.281)#282 |
| 57. | Palmdale | 0.49% | 0.17%(+0.317)#55 | 0.22%(+0.267)#283 |
| 58. | Bell Gardens | 0.48% | 0.17%(+0.310)#56 | 0.22%(+0.259)#284 |
| 59. | Home Garden | 0.46% | 0.17%(+0.294)#57 | 0.22%(+0.244)#285 |
| 60. | Orinda | 0.46% | 0.17%(+0.288)#58 | 0.22%(+0.237)#286 |
| 61. | Montalvin Manor | 0.46% | 0.17%(+0.286)#59 | 0.22%(+0.236)#287 |
| 62. | Ontario | 0.45% | 0.17%(+0.284)#60 | 0.22%(+0.233)#288 |
| 63. | East Los Angeles | 0.43% | 0.17%(+0.260)#61 | 0.22%(+0.209)#289 |
| 64. | South Lake Tahoe | 0.41% | 0.17%(+0.243)#62 | 0.22%(+0.193)#290 |
| 65. | Maywood | 0.40% | 0.17%(+0.231)#63 | 0.22%(+0.180)#291 |
| 66. | La Puente | 0.40% | 0.17%(+0.227)#64 | 0.22%(+0.177)#292 |
| 67. | Cathedral City | 0.38% | 0.17%(+0.214)#65 | 0.22%(+0.163)#293 |
| 68. | Inglewood | 0.38% | 0.17%(+0.208)#66 | 0.22%(+0.158)#294 |
| 69. | Fontana | 0.38% | 0.17%(+0.207)#67 | 0.22%(+0.156)#295 |
| 70. | North Richmond | 0.37% | 0.17%(+0.206)#68 | 0.22%(+0.155)#296 |
| 71. | Lompoc | 0.37% | 0.17%(+0.201)#69 | 0.22%(+0.150)#297 |
| 72. | Santa Maria | 0.37% | 0.17%(+0.201)#70 | 0.22%(+0.150)#298 |
| 73. | Kerman | 0.37% | 0.17%(+0.200)#71 | 0.22%(+0.150)#299 |
| 74. | Romoland | 0.37% | 0.17%(+0.196)#72 | 0.22%(+0.146)#300 |
| 75. | Mission Canyon | 0.36% | 0.17%(+0.191)#73 | 0.22%(+0.140)#301 |
| 76. | Gardena | 0.34% | 0.17%(+0.172)#74 | 0.22%(+0.122)#302 |
| 77. | La Habra Heights | 0.34% | 0.17%(+0.170)#75 | 0.22%(+0.120)#303 |
| 78. | Azusa | 0.33% | 0.17%(+0.165)#76 | 0.22%(+0.114)#304 |
| 79. | West Puente Valley | 0.33% | 0.17%(+0.162)#77 | 0.22%(+0.111)#305 |
| 80. | Del Aire | 0.33% | 0.17%(+0.156)#78 | 0.22%(+0.106)#306 |
| 81. | Carson | 0.32% | 0.17%(+0.152)#79 | 0.22%(+0.101)#307 |
| 82. | Winton | 0.32% | 0.17%(+0.148)#80 | 0.22%(+0.097)#308 |
| 83. | Coalinga | 0.31% | 0.17%(+0.145)#81 | 0.22%(+0.095)#309 |
| 84. | East Niles | 0.31% | 0.17%(+0.138)#82 | 0.22%(+0.087)#310 |
| 85. | Paramount | 0.31% | 0.17%(+0.137)#83 | 0.22%(+0.086)#311 |
| 86. | Oakland | 0.31% | 0.17%(+0.137)#84 | 0.22%(+0.086)#312 |
| 87. | Santa Fe Springs | 0.30% | 0.17%(+0.133)#85 | 0.22%(+0.083)#313 |
| 88. | Fort Bragg | 0.29% | 0.17%(+0.116)#86 | 0.22%(+0.066)#314 |
| 89. | Bellflower | 0.28% | 0.17%(+0.114)#87 | 0.22%(+0.064)#315 |
| 90. | Bakersfield | 0.28% | 0.17%(+0.112)#88 | 0.22%(+0.061)#316 |
| 91. | Culver City | 0.28% | 0.17%(+0.111)#89 | 0.22%(+0.060)#317 |
| 92. | Downey | 0.28% | 0.17%(+0.110)#90 | 0.22%(+0.060)#318 |
| 93. | Lakeport | 0.28% | 0.17%(+0.110)#91 | 0.22%(+0.060)#319 |
| 94. | Big Bear City | 0.27% | 0.17%(+0.105)#92 | 0.22%(+0.055)#320 |
| 95. | Baldwin Park | 0.27% | 0.17%(+0.103)#93 | 0.22%(+0.052)#321 |
| 96. | Vincent | 0.27% | 0.17%(+0.099)#94 | 0.22%(+0.049)#322 |
| 97. | Pomona | 0.27% | 0.17%(+0.099)#95 | 0.22%(+0.049)#323 |
| 98. | Rialto | 0.27% | 0.17%(+0.098)#96 | 0.22%(+0.048)#324 |
| 99. | San Francisco | 0.27% | 0.17%(+0.096)#97 | 0.22%(+0.046)#325 |
| 100. | Norwalk | 0.26% | 0.17%(+0.094)#98 | 0.22%(+0.043)#326 |
Common Questions
What are the Top 10 Cities with the Highest Percentage of Immigrants from Honduras in California?
Top 10 Cities with the Highest Percentage of Immigrants from Honduras in California are:
What city has the Highest Percentage of Immigrants from Honduras in California?
Fairmead has the Highest Percentage of Immigrants from Honduras in California with 3.25%.
What is the Percentage of Immigrants from Honduras in the State of California?
Percentage of Immigrants from Honduras in California is 0.17%.
What is the Percentage of Immigrants from Honduras in the United States?
Percentage of Immigrants from Honduras in the United States is 0.22%.