Cities with the Highest Percentage of Population Employed in Information in California
RELATED REPORTS & OPTIONS
Information & Technology
California
Compare Cities
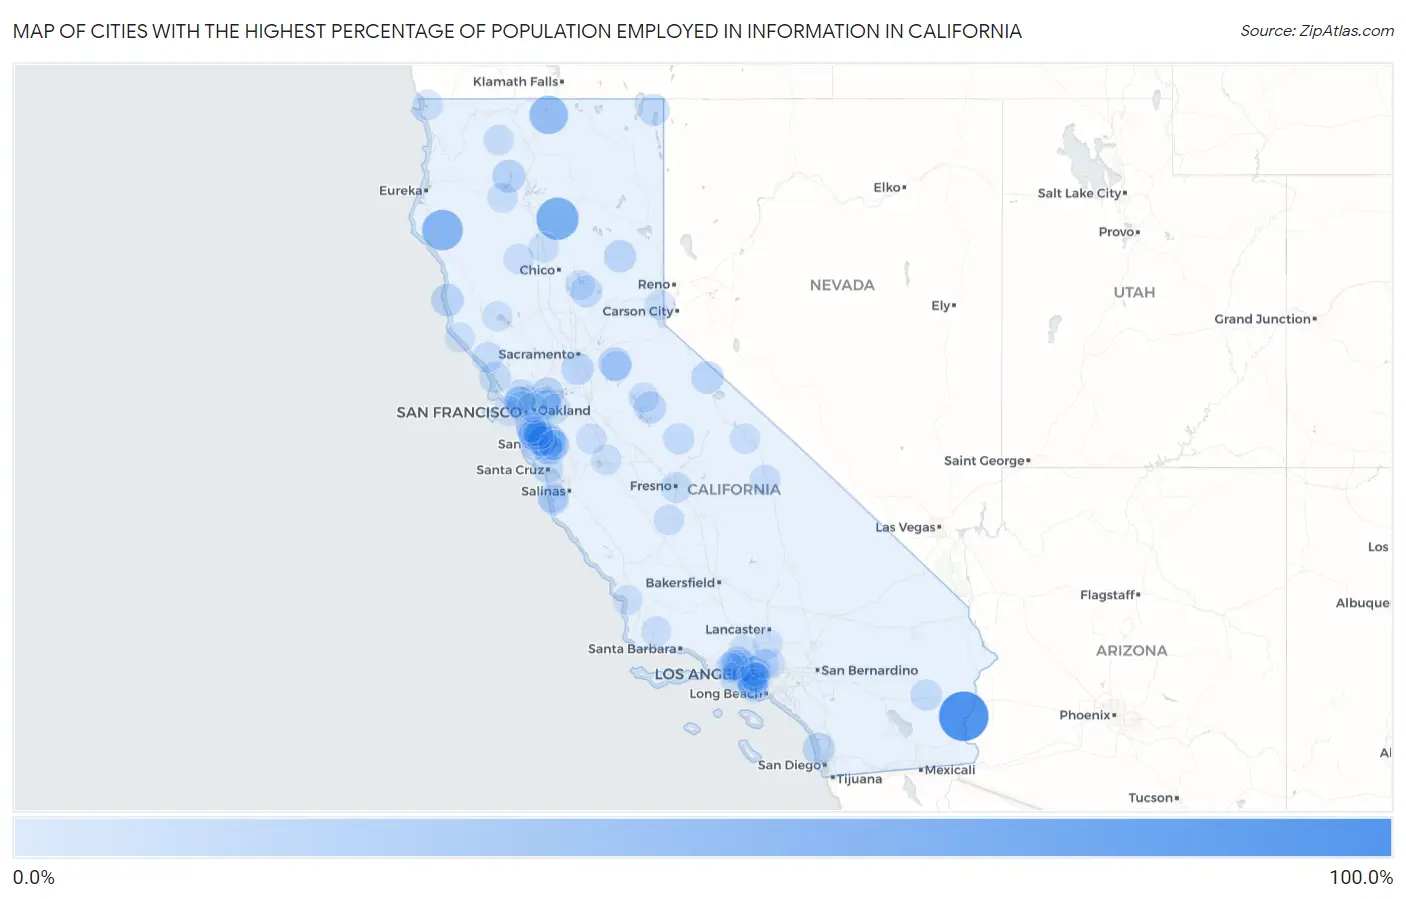
Map of Cities with the Highest Percentage of Population Employed in Information in California
0.0%
100.0%
Cities with the Highest Percentage of Population Employed in Information in California
| City | % Employed | vs State | vs National | |
| 1. | Palo Verde | 100.0% | 2.9%(+97.1)#1 | 1.9%(+98.1)#1 |
| 2. | Manton | 63.6% | 2.9%(+60.7)#2 | 1.9%(+61.7)#11 |
| 3. | Myers Flat | 56.0% | 2.9%(+53.0)#3 | 1.9%(+54.1)#15 |
| 4. | Mount Hebron | 45.7% | 2.9%(+42.7)#4 | 1.9%(+43.8)#26 |
| 5. | Williams Canyon | 27.8% | 2.9%(+24.9)#5 | 1.9%(+25.9)#63 |
| 6. | Drytown | 20.0% | 2.9%(+17.1)#6 | 1.9%(+18.1)#110 |
| 7. | Trinity Center | 19.5% | 2.9%(+16.6)#7 | 1.9%(+17.6)#117 |
| 8. | Hidden Hills | 18.6% | 2.9%(+15.7)#8 | 1.9%(+16.7)#124 |
| 9. | Mendocino | 17.5% | 2.9%(+14.6)#9 | 1.9%(+15.6)#143 |
| 10. | Greenhorn | 17.0% | 2.9%(+14.1)#10 | 1.9%(+15.1)#153 |
| 11. | Bridgeport | 17.0% | 2.9%(+14.1)#11 | 1.9%(+15.1)#154 |
| 12. | Hood | 16.8% | 2.9%(+13.9)#12 | 1.9%(+14.9)#156 |
| 13. | Clyde | 16.4% | 2.9%(+13.5)#13 | 1.9%(+14.5)#164 |
| 14. | Ridgecrest Heights | 15.9% | 2.9%(+13.0)#14 | 1.9%(+14.0)#173 |
| 15. | Del Mar | 15.2% | 2.9%(+12.3)#15 | 1.9%(+13.3)#185 |
| 16. | Groveland | 15.2% | 2.9%(+12.2)#16 | 1.9%(+13.3)#187 |
| 17. | Mountain View | 14.7% | 2.9%(+11.8)#17 | 1.9%(+12.8)#199 |
| 18. | Bell Canyon | 14.4% | 2.9%(+11.5)#18 | 1.9%(+12.5)#207 |
| 19. | Baywood Park | 13.9% | 2.9%(+11.0)#19 | 1.9%(+12.0)#222 |
| 20. | Fort Bidwell | 13.9% | 2.9%(+11.0)#20 | 1.9%(+12.0)#223 |
| 21. | Rackerby | 13.8% | 2.9%(+10.9)#21 | 1.9%(+11.9)#224 |
| 22. | Santa Venetia | 12.8% | 2.9%(+9.93)#22 | 1.9%(+10.9)#256 |
| 23. | Alto | 12.3% | 2.9%(+9.41)#23 | 1.9%(+10.4)#283 |
| 24. | West Hollywood | 12.2% | 2.9%(+9.27)#24 | 1.9%(+10.3)#285 |
| 25. | Dillon Beach | 12.1% | 2.9%(+9.21)#25 | 1.9%(+10.2)#286 |
| 26. | Portola Valley | 12.0% | 2.9%(+9.07)#26 | 1.9%(+10.1)#291 |
| 27. | Sunnyvale | 11.7% | 2.9%(+8.81)#27 | 1.9%(+9.82)#304 |
| 28. | Desert Center | 11.4% | 2.9%(+8.52)#28 | 1.9%(+9.53)#317 |
| 29. | Pasatiempo | 11.1% | 2.9%(+8.18)#29 | 1.9%(+9.19)#327 |
| 30. | Nipinnawasee | 11.0% | 2.9%(+8.13)#30 | 1.9%(+9.14)#331 |
| 31. | Fruitdale | 11.0% | 2.9%(+8.12)#31 | 1.9%(+9.13)#332 |
| 32. | Santa Monica | 10.7% | 2.9%(+7.75)#32 | 1.9%(+8.76)#353 |
| 33. | Woody | 10.5% | 2.9%(+7.62)#33 | 1.9%(+8.63)#360 |
| 34. | Los Altos | 10.2% | 2.9%(+7.28)#34 | 1.9%(+8.29)#377 |
| 35. | Acalanes Ridge | 10.0% | 2.9%(+7.09)#35 | 1.9%(+8.10)#388 |
| 36. | Monte Sereno | 9.9% | 2.9%(+6.98)#36 | 1.9%(+7.99)#404 |
| 37. | Culver City | 9.6% | 2.9%(+6.73)#37 | 1.9%(+7.74)#428 |
| 38. | Calwa | 9.5% | 2.9%(+6.62)#38 | 1.9%(+7.63)#436 |
| 39. | Foster City | 9.5% | 2.9%(+6.57)#39 | 1.9%(+7.58)#441 |
| 40. | Topanga | 9.5% | 2.9%(+6.55)#40 | 1.9%(+7.56)#442 |
| 41. | Amador City | 9.2% | 2.9%(+6.32)#41 | 1.9%(+7.33)#460 |
| 42. | Palo Alto | 8.9% | 2.9%(+6.03)#42 | 1.9%(+7.04)#485 |
| 43. | Corte Madera | 8.8% | 2.9%(+5.91)#43 | 1.9%(+6.92)#500 |
| 44. | Cazadero | 8.8% | 2.9%(+5.89)#44 | 1.9%(+6.90)#501 |
| 45. | Hermosa Beach | 8.8% | 2.9%(+5.87)#45 | 1.9%(+6.88)#503 |
| 46. | Cupertino | 8.8% | 2.9%(+5.87)#46 | 1.9%(+6.88)#504 |
| 47. | San Carlos | 8.6% | 2.9%(+5.65)#47 | 1.9%(+6.66)#519 |
| 48. | Malibu | 8.5% | 2.9%(+5.64)#48 | 1.9%(+6.65)#520 |
| 49. | Etna | 8.5% | 2.9%(+5.59)#49 | 1.9%(+6.60)#524 |
| 50. | Ladera | 8.5% | 2.9%(+5.55)#50 | 1.9%(+6.56)#527 |
| 51. | Santa Clara | 8.4% | 2.9%(+5.48)#51 | 1.9%(+6.49)#530 |
| 52. | Manhattan Beach | 8.4% | 2.9%(+5.47)#52 | 1.9%(+6.48)#533 |
| 53. | Independence | 8.3% | 2.9%(+5.42)#53 | 1.9%(+6.43)#535 |
| 54. | West Menlo Park | 8.1% | 2.9%(+5.17)#54 | 1.9%(+6.18)#571 |
| 55. | Harmony Grove | 8.1% | 2.9%(+5.17)#55 | 1.9%(+6.18)#572 |
| 56. | Marina Del Rey | 8.0% | 2.9%(+5.10)#56 | 1.9%(+6.11)#581 |
| 57. | Saratoga | 7.9% | 2.9%(+5.00)#57 | 1.9%(+6.01)#593 |
| 58. | Lewiston | 7.6% | 2.9%(+4.70)#58 | 1.9%(+5.71)#635 |
| 59. | Smith River | 7.6% | 2.9%(+4.69)#59 | 1.9%(+5.70)#638 |
| 60. | Del Monte Forest | 7.5% | 2.9%(+4.59)#60 | 1.9%(+5.60)#656 |
| 61. | Los Molinos | 7.5% | 2.9%(+4.54)#61 | 1.9%(+5.55)#666 |
| 62. | La Honda | 7.4% | 2.9%(+4.51)#62 | 1.9%(+5.52)#675 |
| 63. | Los Olivos | 7.3% | 2.9%(+4.37)#63 | 1.9%(+5.38)#704 |
| 64. | Lemoore Station | 7.2% | 2.9%(+4.33)#64 | 1.9%(+5.34)#712 |
| 65. | Carmel By The Sea | 7.2% | 2.9%(+4.32)#65 | 1.9%(+5.33)#713 |
| 66. | Santa Nella | 7.2% | 2.9%(+4.32)#66 | 1.9%(+5.33)#715 |
| 67. | Diablo Grande | 7.1% | 2.9%(+4.23)#67 | 1.9%(+5.24)#730 |
| 68. | Paskenta | 7.1% | 2.9%(+4.23)#68 | 1.9%(+5.24)#737 |
| 69. | Menlo Park | 7.1% | 2.9%(+4.21)#69 | 1.9%(+5.22)#743 |
| 70. | Altadena | 7.0% | 2.9%(+4.13)#70 | 1.9%(+5.14)#760 |
| 71. | Sausalito | 7.0% | 2.9%(+4.13)#71 | 1.9%(+5.14)#762 |
| 72. | Belmont | 7.0% | 2.9%(+4.11)#72 | 1.9%(+5.12)#766 |
| 73. | Castle Hill | 7.0% | 2.9%(+4.09)#73 | 1.9%(+5.10)#775 |
| 74. | Emerald Lake Hills | 7.0% | 2.9%(+4.08)#74 | 1.9%(+5.09)#776 |
| 75. | Round Valley | 6.9% | 2.9%(+3.97)#75 | 1.9%(+4.98)#800 |
| 76. | East Sonora | 6.9% | 2.9%(+3.96)#76 | 1.9%(+4.97)#801 |
| 77. | Calabasas | 6.8% | 2.9%(+3.87)#77 | 1.9%(+4.88)#820 |
| 78. | Beverly Hills | 6.7% | 2.9%(+3.78)#78 | 1.9%(+4.79)#829 |
| 79. | Tahoe Vista | 6.7% | 2.9%(+3.77)#79 | 1.9%(+4.78)#832 |
| 80. | Highlands | 6.7% | 2.9%(+3.75)#80 | 1.9%(+4.76)#841 |
| 81. | Los Altos Hills | 6.7% | 2.9%(+3.75)#81 | 1.9%(+4.76)#842 |
| 82. | Redwood City | 6.7% | 2.9%(+3.75)#82 | 1.9%(+4.76)#844 |
| 83. | Blackhawk | 6.6% | 2.9%(+3.68)#83 | 1.9%(+4.69)#863 |
| 84. | Stevenson Ranch | 6.6% | 2.9%(+3.66)#84 | 1.9%(+4.67)#869 |
| 85. | El Segundo | 6.5% | 2.9%(+3.61)#85 | 1.9%(+4.62)#878 |
| 86. | Acton | 6.4% | 2.9%(+3.50)#86 | 1.9%(+4.51)#902 |
| 87. | Glendale | 6.4% | 2.9%(+3.46)#87 | 1.9%(+4.47)#910 |
| 88. | Los Angeles | 6.4% | 2.9%(+3.44)#88 | 1.9%(+4.45)#916 |
| 89. | Anchor Bay | 6.3% | 2.9%(+3.42)#89 | 1.9%(+4.43)#925 |
| 90. | Atherton | 6.3% | 2.9%(+3.41)#90 | 1.9%(+4.42)#929 |
| 91. | Oak Park | 6.3% | 2.9%(+3.39)#91 | 1.9%(+4.40)#936 |
| 92. | San Francisco | 6.2% | 2.9%(+3.34)#92 | 1.9%(+4.35)#954 |
| 93. | Westlake Village | 6.2% | 2.9%(+3.24)#93 | 1.9%(+4.26)#979 |
| 94. | North Lakeport | 6.1% | 2.9%(+3.22)#94 | 1.9%(+4.23)#982 |
| 95. | Grover Beach | 6.1% | 2.9%(+3.18)#95 | 1.9%(+4.19)#996 |
| 96. | San Mateo | 6.1% | 2.9%(+3.18)#96 | 1.9%(+4.19)#997 |
| 97. | Ladera Heights | 6.0% | 2.9%(+3.07)#97 | 1.9%(+4.08)#1,041 |
| 98. | Burbank | 5.9% | 2.9%(+3.03)#98 | 1.9%(+4.04)#1,056 |
| 99. | Kelly Ridge | 5.9% | 2.9%(+2.96)#99 | 1.9%(+3.97)#1,075 |
| 100. | Emeryville | 5.8% | 2.9%(+2.89)#100 | 1.9%(+3.90)#1,099 |
Common Questions
What are the Top 10 Cities with the Highest Percentage of Population Employed in Information in California?
Top 10 Cities with the Highest Percentage of Population Employed in Information in California are:
#1
100.0%
#2
63.6%
#3
56.0%
#4
45.7%
#5
20.0%
#6
19.5%
#7
18.6%
#8
17.5%
#9
17.0%
#10
17.0%
What city has the Highest Percentage of Population Employed in Information in California?
Palo Verde has the Highest Percentage of Population Employed in Information in California with 100.0%.
What is the Percentage of Population Employed in Information in the State of California?
Percentage of Population Employed in Information in California is 2.9%.
What is the Percentage of Population Employed in Information in the United States?
Percentage of Population Employed in Information in the United States is 1.9%.