Cities with the Highest Percentage of Immigrants from Middle Africa in California
RELATED REPORTS & OPTIONS
Middle Africa
California
Compare Cities
Map of Cities with the Highest Percentage of Immigrants from Middle Africa in California
0.00%
6.00%
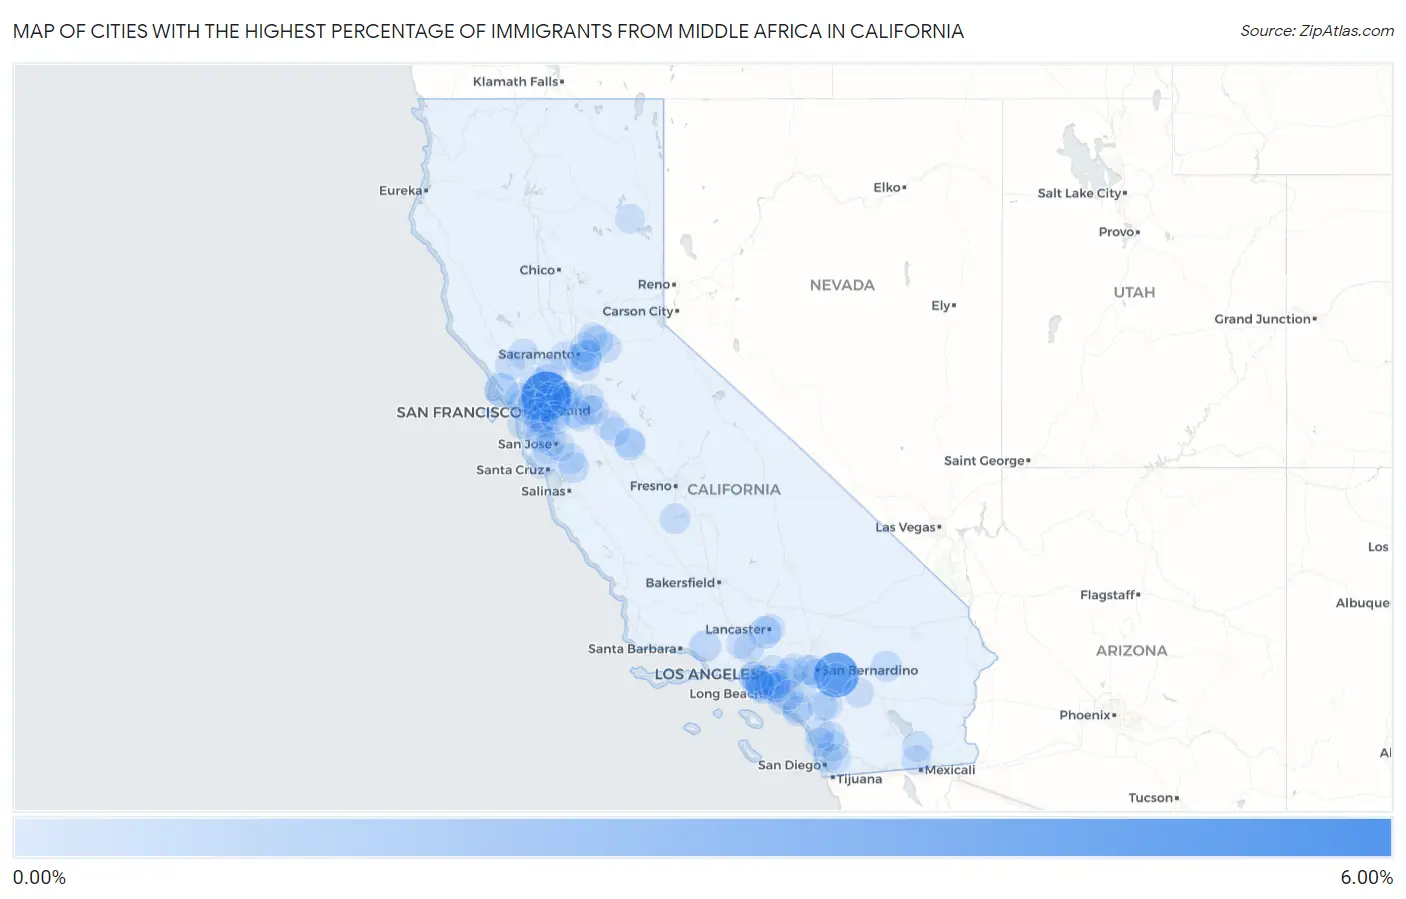
Cities with the Highest Percentage of Immigrants from Middle Africa in California
| City | Middle Africa | vs State | vs National | |
| 1. | Pacheco | 5.73% | 0.019%(+5.71)#-1 | 0.059%(+5.67)#0 |
| 2. | Oak Glen | 4.34% | 0.019%(+4.32)#0 | 0.059%(+4.28)#1 |
| 3. | Inverness | 1.02% | 0.019%(+1.00)#1 | 0.059%(+0.963)#2 |
| 4. | Pleasant Hill | 0.83% | 0.019%(+0.810)#2 | 0.059%(+0.770)#3 |
| 5. | Franklin Cdp Merced County | 0.65% | 0.019%(+0.628)#3 | 0.059%(+0.588)#4 |
| 6. | Quartz Hill | 0.64% | 0.019%(+0.626)#4 | 0.059%(+0.586)#5 |
| 7. | Meiners Oaks | 0.51% | 0.019%(+0.492)#5 | 0.059%(+0.452)#6 |
| 8. | Cherry Valley | 0.39% | 0.019%(+0.374)#6 | 0.059%(+0.334)#7 |
| 9. | Granite Bay | 0.36% | 0.019%(+0.342)#7 | 0.059%(+0.302)#8 |
| 10. | Rosemont | 0.30% | 0.019%(+0.279)#8 | 0.059%(+0.239)#9 |
| 11. | Spring Valley Cdp San Diego County | 0.28% | 0.019%(+0.265)#9 | 0.059%(+0.225)#250 |
| 12. | Twentynine Palms | 0.26% | 0.019%(+0.246)#10 | 0.059%(+0.206)#251 |
| 13. | Belvedere | 0.26% | 0.019%(+0.239)#11 | 0.059%(+0.199)#252 |
| 14. | Mcswain | 0.26% | 0.019%(+0.239)#12 | 0.059%(+0.199)#253 |
| 15. | La Riviera | 0.26% | 0.019%(+0.239)#13 | 0.059%(+0.199)#254 |
| 16. | Cerritos | 0.25% | 0.019%(+0.234)#14 | 0.059%(+0.194)#255 |
| 17. | Morgan Hill | 0.23% | 0.019%(+0.209)#15 | 0.059%(+0.169)#256 |
| 18. | Gilroy | 0.21% | 0.019%(+0.193)#16 | 0.059%(+0.153)#257 |
| 19. | Culver City | 0.20% | 0.019%(+0.185)#17 | 0.059%(+0.145)#258 |
| 20. | Moraga | 0.20% | 0.019%(+0.177)#18 | 0.059%(+0.137)#259 |
| 21. | Pittsburg | 0.19% | 0.019%(+0.172)#19 | 0.059%(+0.132)#260 |
| 22. | Brawley | 0.18% | 0.019%(+0.166)#20 | 0.059%(+0.126)#261 |
| 23. | Lathrop | 0.18% | 0.019%(+0.157)#21 | 0.059%(+0.117)#262 |
| 24. | Lemoore | 0.17% | 0.019%(+0.156)#22 | 0.059%(+0.116)#263 |
| 25. | Hawthorne | 0.17% | 0.019%(+0.155)#23 | 0.059%(+0.115)#264 |
| 26. | Antioch | 0.15% | 0.019%(+0.134)#24 | 0.059%(+0.094)#265 |
| 27. | Ladera Ranch | 0.15% | 0.019%(+0.134)#25 | 0.059%(+0.094)#266 |
| 28. | Poway | 0.15% | 0.019%(+0.127)#26 | 0.059%(+0.087)#267 |
| 29. | Westmont | 0.14% | 0.019%(+0.123)#27 | 0.059%(+0.083)#268 |
| 30. | Mountain House | 0.14% | 0.019%(+0.117)#28 | 0.059%(+0.077)#269 |
| 31. | French Valley | 0.13% | 0.019%(+0.115)#29 | 0.059%(+0.075)#270 |
| 32. | Carson | 0.13% | 0.019%(+0.114)#30 | 0.059%(+0.074)#391 |
| 33. | East San Gabriel | 0.12% | 0.019%(+0.101)#31 | 0.059%(+0.061)#392 |
| 34. | Angwin | 0.11% | 0.019%(+0.091)#32 | 0.059%(+0.051)#393 |
| 35. | Lemon Hill | 0.10% | 0.019%(+0.083)#33 | 0.059%(+0.043)#394 |
| 36. | San Leandro | 0.10% | 0.019%(+0.082)#34 | 0.059%(+0.042)#395 |
| 37. | Santa Clarita | 0.096% | 0.019%(+0.078)#35 | 0.059%(+0.038)#396 |
| 38. | Escondido | 0.094% | 0.019%(+0.075)#36 | 0.059%(+0.035)#397 |
| 39. | Hawaiian Gardens | 0.093% | 0.019%(+0.074)#37 | 0.059%(+0.034)#398 |
| 40. | Cudahy | 0.088% | 0.019%(+0.070)#38 | 0.059%(+0.030)#399 |
| 41. | Ashland | 0.086% | 0.019%(+0.068)#39 | 0.059%(+0.028)#400 |
| 42. | Rowland Heights | 0.085% | 0.019%(+0.066)#40 | 0.059%(+0.026)#401 |
| 43. | Cameron Park | 0.083% | 0.019%(+0.065)#41 | 0.059%(+0.025)#402 |
| 44. | Bellflower | 0.083% | 0.019%(+0.064)#42 | 0.059%(+0.024)#403 |
| 45. | Inglewood | 0.081% | 0.019%(+0.063)#43 | 0.059%(+0.023)#404 |
| 46. | Tracy | 0.078% | 0.019%(+0.059)#44 | 0.059%(+0.019)#405 |
| 47. | Walnut Creek | 0.074% | 0.019%(+0.056)#45 | 0.059%(+0.016)#406 |
| 48. | American Canyon | 0.069% | 0.019%(+0.051)#46 | 0.059%(+0.011)#407 |
| 49. | Rialto | 0.066% | 0.019%(+0.048)#47 | 0.059%(+0.008)#408 |
| 50. | Santa Rosa | 0.061% | 0.019%(+0.043)#48 | 0.059%(+0.003)#409 |
| 51. | Pacifica | 0.060% | 0.019%(+0.042)#49 | 0.059%(+0.002)#410 |
| 52. | Palm Springs | 0.058% | 0.019%(+0.039)#50 | 0.059%(-0.001)#411 |
| 53. | La Canada Flintridge | 0.054% | 0.019%(+0.035)#51 | 0.059%(-0.005)#412 |
| 54. | Foster City | 0.051% | 0.019%(+0.033)#52 | 0.059%(-0.007)#413 |
| 55. | Vista | 0.051% | 0.019%(+0.032)#53 | 0.059%(-0.008)#414 |
| 56. | Oakland | 0.049% | 0.019%(+0.030)#54 | 0.059%(-0.010)#430 |
| 57. | Costa Mesa | 0.048% | 0.019%(+0.030)#55 | 0.059%(-0.010)#431 |
| 58. | San Juan Capistrano | 0.048% | 0.019%(+0.030)#56 | 0.059%(-0.010)#432 |
| 59. | San Diego | 0.047% | 0.019%(+0.028)#57 | 0.059%(-0.012)#433 |
| 60. | San Rafael | 0.046% | 0.019%(+0.027)#58 | 0.059%(-0.013)#434 |
| 61. | Berkeley | 0.045% | 0.019%(+0.027)#59 | 0.059%(-0.013)#435 |
| 62. | Brentwood | 0.043% | 0.019%(+0.025)#60 | 0.059%(-0.015)#436 |
| 63. | Castaic | 0.043% | 0.019%(+0.024)#61 | 0.059%(-0.016)#437 |
| 64. | Saratoga | 0.042% | 0.019%(+0.024)#62 | 0.059%(-0.016)#438 |
| 65. | Hayward | 0.042% | 0.019%(+0.023)#63 | 0.059%(-0.017)#439 |
| 66. | Oakley | 0.041% | 0.019%(+0.023)#64 | 0.059%(-0.017)#440 |
| 67. | Claremont | 0.041% | 0.019%(+0.022)#65 | 0.059%(-0.018)#441 |
| 68. | Pomona | 0.037% | 0.019%(+0.018)#66 | 0.059%(-0.022)#442 |
| 69. | El Cajon | 0.036% | 0.019%(+0.017)#67 | 0.059%(-0.023)#443 |
| 70. | Corona | 0.035% | 0.019%(+0.017)#68 | 0.059%(-0.023)#444 |
| 71. | Bonny Doon | 0.035% | 0.019%(+0.016)#69 | 0.059%(-0.024)#445 |
| 72. | Davis | 0.033% | 0.019%(+0.014)#70 | 0.059%(-0.026)#446 |
| 73. | Ceres | 0.033% | 0.019%(+0.014)#71 | 0.059%(-0.026)#447 |
| 74. | Fontana | 0.032% | 0.019%(+0.014)#72 | 0.059%(-0.026)#448 |
| 75. | Vacaville | 0.032% | 0.019%(+0.014)#73 | 0.059%(-0.026)#449 |
| 76. | Concord | 0.030% | 0.019%(+0.012)#74 | 0.059%(-0.028)#450 |
| 77. | Murrieta | 0.029% | 0.019%(+0.010)#75 | 0.059%(-0.030)#451 |
| 78. | Fairfield | 0.028% | 0.019%(+0.010)#76 | 0.059%(-0.030)#452 |
| 79. | Lancaster | 0.027% | 0.019%(+0.009)#77 | 0.059%(-0.031)#453 |
| 80. | North Highlands | 0.027% | 0.019%(+0.008)#78 | 0.059%(-0.032)#454 |
| 81. | San Jose | 0.027% | 0.019%(+0.008)#79 | 0.059%(-0.032)#455 |
| 82. | Buena Park | 0.026% | 0.019%(+0.008)#80 | 0.059%(-0.032)#456 |
| 83. | Elk Grove | 0.026% | 0.019%(+0.007)#81 | 0.059%(-0.033)#457 |
| 84. | Susanville | 0.025% | 0.019%(+0.007)#82 | 0.059%(-0.033)#458 |
| 85. | Pleasanton | 0.024% | 0.019%(+0.006)#83 | 0.059%(-0.034)#459 |
| 86. | Encinitas | 0.023% | 0.019%(+0.004)#84 | 0.059%(-0.036)#460 |
| 87. | Turlock | 0.022% | 0.019%(+0.004)#85 | 0.059%(-0.036)#461 |
| 88. | Stockton | 0.021% | 0.019%(+0.003)#86 | 0.059%(-0.037)#462 |
| 89. | La Mirada | 0.021% | 0.019%(+0.002)#87 | 0.059%(-0.038)#463 |
| 90. | Los Angeles | 0.020% | 0.019%(+0.002)#88 | 0.059%(-0.038)#464 |
| 91. | El Centro | 0.020% | 0.019%(+0.002)#89 | 0.059%(-0.038)#465 |
| 92. | Santa Clara | 0.020% | 0.019%(+0.002)#90 | 0.059%(-0.038)#466 |
| 93. | Gardena | 0.020% | 0.019%(+0.001)#91 | 0.059%(-0.039)#467 |
| 94. | Dublin | 0.020% | 0.019%(+0.001)#92 | 0.059%(-0.039)#468 |
| 95. | Tustin | 0.019% | 0.019%(+0.000)#93 | 0.059%(-0.040)#469 |
| 96. | Atwater | 0.019% | 0.019%(+0.000)#94 | 0.059%(-0.040)#470 |
| 97. | Colton | 0.019% | 0.019%(-0.000)#95 | 0.059%(-0.040)#471 |
| 98. | Stanford | 0.017% | 0.019%(-0.001)#96 | 0.059%(-0.041)#472 |
| 99. | Rocklin | 0.017% | 0.019%(-0.002)#97 | 0.059%(-0.042)#473 |
| 100. | Manteca | 0.015% | 0.019%(-0.003)#98 | 0.059%(-0.043)#474 |
Common Questions
What are the Top 10 Cities with the Highest Percentage of Immigrants from Middle Africa in California?
Top 10 Cities with the Highest Percentage of Immigrants from Middle Africa in California are:
#1
5.73%
#2
4.34%
#3
1.02%
#4
0.83%
#5
0.64%
#6
0.51%
#7
0.39%
#8
0.36%
#9
0.30%
#10
0.26%
What city has the Highest Percentage of Immigrants from Middle Africa in California?
Pacheco has the Highest Percentage of Immigrants from Middle Africa in California with 5.73%.
What is the Percentage of Immigrants from Middle Africa in the State of California?
Percentage of Immigrants from Middle Africa in California is 0.019%.
What is the Percentage of Immigrants from Middle Africa in the United States?
Percentage of Immigrants from Middle Africa in the United States is 0.059%.