Cities with the Highest Percentage of Population Taking Public Transit to Work in California
RELATED REPORTS & OPTIONS
Public Transit
California
Compare Cities
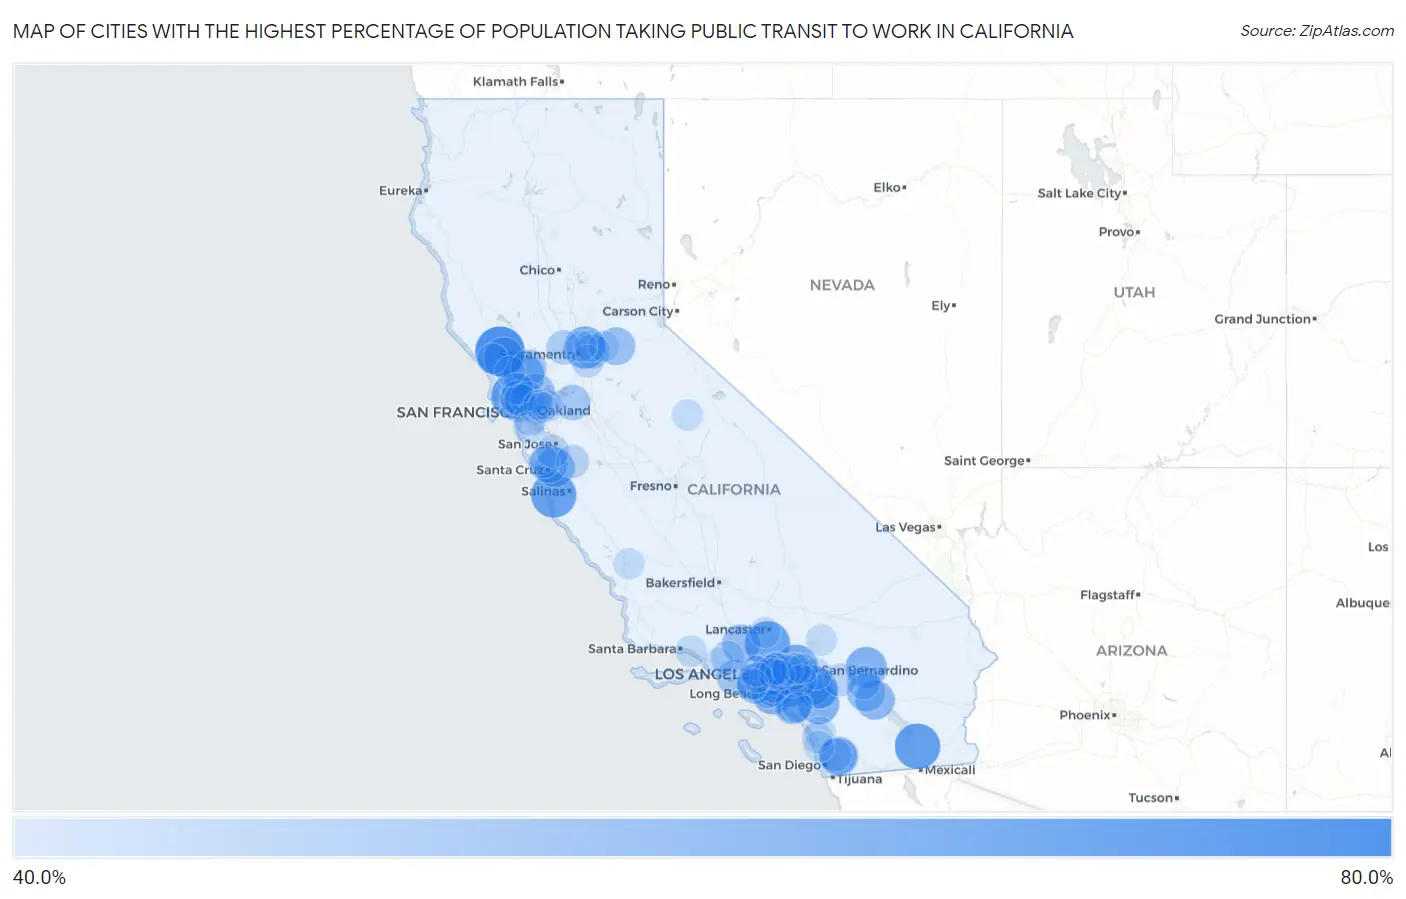
Map of Cities with the Highest Percentage of Population Taking Public Transit to Work in California
0.0%
80.0%
Cities with the Highest Percentage of Population Taking Public Transit to Work in California
| City | % Public Transit | vs State | vs National | |
| 1. | Healdsburg | 69.1% | 38.0%(+31.1)#1 | 38.5%(+30.6)#17 |
| 2. | Brawley | 64.9% | 38.0%(+26.9)#2 | 38.5%(+26.4)#55 |
| 3. | Woodacre | 64.6% | 38.0%(+26.6)#3 | 38.5%(+26.1)#59 |
| 4. | Pacific Grove | 64.5% | 38.0%(+26.5)#4 | 38.5%(+26.0)#61 |
| 5. | Acton | 64.5% | 38.0%(+26.5)#5 | 38.5%(+26.0)#62 |
| 6. | Yorba Linda | 62.5% | 38.0%(+24.5)#6 | 38.5%(+24.0)#91 |
| 7. | San Antonio Heights | 62.5% | 38.0%(+24.5)#7 | 38.5%(+24.0)#93 |
| 8. | North Highlands | 61.4% | 38.0%(+23.4)#8 | 38.5%(+22.9)#120 |
| 9. | Sonoma | 60.5% | 38.0%(+22.5)#9 | 38.5%(+22.0)#149 |
| 10. | Seal Beach | 60.3% | 38.0%(+22.3)#10 | 38.5%(+21.8)#155 |
| 11. | Wildomar | 60.2% | 38.0%(+22.2)#11 | 38.5%(+21.7)#159 |
| 12. | Yucca Valley | 60.2% | 38.0%(+22.2)#12 | 38.5%(+21.7)#160 |
| 13. | Windsor | 59.4% | 38.0%(+21.4)#13 | 38.5%(+20.9)#186 |
| 14. | Mead Valley | 59.1% | 38.0%(+21.1)#14 | 38.5%(+20.6)#196 |
| 15. | Del Aire | 59.1% | 38.0%(+21.1)#15 | 38.5%(+20.6)#198 |
| 16. | Woodcrest | 59.0% | 38.0%(+21.0)#16 | 38.5%(+20.5)#207 |
| 17. | La Quinta | 58.2% | 38.0%(+20.2)#17 | 38.5%(+19.7)#240 |
| 18. | Winter Gardens | 58.2% | 38.0%(+20.2)#18 | 38.5%(+19.7)#242 |
| 19. | La Palma | 58.1% | 38.0%(+20.1)#19 | 38.5%(+19.6)#251 |
| 20. | Aptos | 58.1% | 38.0%(+20.1)#20 | 38.5%(+19.6)#254 |
| 21. | Hacienda Heights | 57.4% | 38.0%(+19.4)#21 | 38.5%(+18.9)#286 |
| 22. | Scotts Valley | 57.4% | 38.0%(+19.4)#22 | 38.5%(+18.9)#289 |
| 23. | Rancho Mirage | 57.3% | 38.0%(+19.3)#23 | 38.5%(+18.8)#294 |
| 24. | Castaic | 57.2% | 38.0%(+19.2)#24 | 38.5%(+18.7)#302 |
| 25. | Diamond Springs | 56.8% | 38.0%(+18.8)#25 | 38.5%(+18.3)#320 |
| 26. | Crockett | 56.5% | 38.0%(+18.5)#26 | 38.5%(+18.0)#339 |
| 27. | Walnut | 55.5% | 38.0%(+17.5)#27 | 38.5%(+17.0)#405 |
| 28. | Aliso Viejo | 55.4% | 38.0%(+17.4)#28 | 38.5%(+16.9)#416 |
| 29. | Laguna Hills | 55.4% | 38.0%(+17.4)#29 | 38.5%(+16.9)#419 |
| 30. | Lakeside | 55.1% | 38.0%(+17.1)#30 | 38.5%(+16.6)#440 |
| 31. | Malibu | 55.1% | 38.0%(+17.1)#31 | 38.5%(+16.6)#441 |
| 32. | Commerce | 55.0% | 38.0%(+17.0)#32 | 38.5%(+16.5)#450 |
| 33. | Yountville | 54.6% | 38.0%(+16.6)#33 | 38.5%(+16.1)#472 |
| 34. | Discovery Bay | 54.4% | 38.0%(+16.4)#34 | 38.5%(+15.9)#486 |
| 35. | Diamond Bar | 53.6% | 38.0%(+15.6)#35 | 38.5%(+15.1)#547 |
| 36. | Tamalpais Homestead Valley | 53.6% | 38.0%(+15.6)#36 | 38.5%(+15.1)#550 |
| 37. | Ross | 53.6% | 38.0%(+15.6)#37 | 38.5%(+15.1)#552 |
| 38. | Gold River | 53.4% | 38.0%(+15.4)#38 | 38.5%(+14.9)#572 |
| 39. | Woodland | 53.3% | 38.0%(+15.3)#39 | 38.5%(+14.8)#576 |
| 40. | San Anselmo | 53.2% | 38.0%(+15.2)#40 | 38.5%(+14.7)#593 |
| 41. | Alhambra | 53.1% | 38.0%(+15.1)#41 | 38.5%(+14.6)#598 |
| 42. | Perris | 53.1% | 38.0%(+15.1)#42 | 38.5%(+14.6)#599 |
| 43. | North Richmond | 53.1% | 38.0%(+15.1)#43 | 38.5%(+14.6)#607 |
| 44. | Montclair | 52.8% | 38.0%(+14.8)#44 | 38.5%(+14.3)#619 |
| 45. | Moorpark | 52.7% | 38.0%(+14.7)#45 | 38.5%(+14.2)#624 |
| 46. | Signal Hill | 52.6% | 38.0%(+14.6)#46 | 38.5%(+14.1)#637 |
| 47. | South Monrovia Island | 52.6% | 38.0%(+14.6)#47 | 38.5%(+14.1)#638 |
| 48. | Garnet | 52.5% | 38.0%(+14.5)#48 | 38.5%(+14.0)#651 |
| 49. | Santee | 51.8% | 38.0%(+13.8)#49 | 38.5%(+13.3)#699 |
| 50. | Los Gatos | 51.8% | 38.0%(+13.8)#50 | 38.5%(+13.3)#700 |
| 51. | San Martin | 51.8% | 38.0%(+13.8)#51 | 38.5%(+13.3)#702 |
| 52. | Brisbane | 51.7% | 38.0%(+13.7)#52 | 38.5%(+13.2)#704 |
| 53. | Banning | 51.6% | 38.0%(+13.6)#53 | 38.5%(+13.1)#706 |
| 54. | Cerritos | 51.5% | 38.0%(+13.5)#54 | 38.5%(+13.0)#713 |
| 55. | Vineyard | 51.3% | 38.0%(+13.3)#55 | 38.5%(+12.8)#740 |
| 56. | Beverly Hills | 51.3% | 38.0%(+13.3)#56 | 38.5%(+12.8)#741 |
| 57. | Vincent | 51.2% | 38.0%(+13.2)#57 | 38.5%(+12.7)#756 |
| 58. | Baywood Park | 50.9% | 38.0%(+12.9)#58 | 38.5%(+12.4)#788 |
| 59. | Chino Hills | 50.7% | 38.0%(+12.7)#59 | 38.5%(+12.2)#795 |
| 60. | Piedmont | 50.7% | 38.0%(+12.7)#60 | 38.5%(+12.2)#803 |
| 61. | Novato | 50.6% | 38.0%(+12.6)#61 | 38.5%(+12.1)#810 |
| 62. | Larkspur | 50.6% | 38.0%(+12.6)#62 | 38.5%(+12.1)#813 |
| 63. | Monterey Park | 50.5% | 38.0%(+12.5)#63 | 38.5%(+12.0)#820 |
| 64. | Claremont | 50.5% | 38.0%(+12.5)#64 | 38.5%(+12.0)#822 |
| 65. | Carpinteria | 50.5% | 38.0%(+12.5)#65 | 38.5%(+12.0)#827 |
| 66. | Mayflower Village | 50.5% | 38.0%(+12.5)#66 | 38.5%(+12.0)#829 |
| 67. | Arcadia | 50.4% | 38.0%(+12.4)#67 | 38.5%(+11.9)#833 |
| 68. | Apple Valley | 50.3% | 38.0%(+12.3)#68 | 38.5%(+11.8)#841 |
| 69. | Colton | 50.3% | 38.0%(+12.3)#69 | 38.5%(+11.8)#843 |
| 70. | San Gabriel | 50.3% | 38.0%(+12.3)#70 | 38.5%(+11.8)#844 |
| 71. | Vista | 50.2% | 38.0%(+12.2)#71 | 38.5%(+11.7)#859 |
| 72. | Citrus Heights | 50.2% | 38.0%(+12.2)#72 | 38.5%(+11.7)#861 |
| 73. | El Segundo | 50.2% | 38.0%(+12.2)#73 | 38.5%(+11.7)#866 |
| 74. | El Dorado Hills | 50.1% | 38.0%(+12.1)#74 | 38.5%(+11.6)#879 |
| 75. | Hillsborough | 50.1% | 38.0%(+12.1)#75 | 38.5%(+11.6)#883 |
| 76. | Saranap | 50.1% | 38.0%(+12.1)#76 | 38.5%(+11.6)#887 |
| 77. | Carlsbad | 50.0% | 38.0%(+12.0)#77 | 38.5%(+11.5)#891 |
| 78. | Upland | 50.0% | 38.0%(+12.0)#78 | 38.5%(+11.5)#892 |
| 79. | El Paso De Robles Paso Robles | 50.0% | 38.0%(+12.0)#79 | 38.5%(+11.5)#894 |
| 80. | Ben Lomond | 50.0% | 38.0%(+12.0)#80 | 38.5%(+11.5)#896 |
| 81. | Yosemite Valley | 50.0% | 38.0%(+12.0)#81 | 38.5%(+11.5)#897 |
| 82. | Solana Beach | 49.9% | 38.0%(+11.9)#82 | 38.5%(+11.4)#902 |
| 83. | Manhattan Beach | 49.7% | 38.0%(+11.7)#83 | 38.5%(+11.2)#914 |
| 84. | Quartz Hill | 49.7% | 38.0%(+11.7)#84 | 38.5%(+11.2)#917 |
| 85. | Eastvale | 49.6% | 38.0%(+11.6)#85 | 38.5%(+11.1)#925 |
| 86. | Rio Linda | 49.6% | 38.0%(+11.6)#86 | 38.5%(+11.1)#933 |
| 87. | San Dimas | 49.5% | 38.0%(+11.5)#87 | 38.5%(+11.0)#950 |
| 88. | Strawberry Cdp Marin County | 49.5% | 38.0%(+11.5)#88 | 38.5%(+11.0)#964 |
| 89. | Alamo | 49.4% | 38.0%(+11.4)#89 | 38.5%(+10.9)#972 |
| 90. | Guerneville | 49.4% | 38.0%(+11.4)#90 | 38.5%(+10.9)#983 |
| 91. | West Hollywood | 49.2% | 38.0%(+11.2)#91 | 38.5%(+10.7)#1,008 |
| 92. | Rancho Cucamonga | 49.1% | 38.0%(+11.1)#92 | 38.5%(+10.6)#1,020 |
| 93. | South El Monte | 49.1% | 38.0%(+11.1)#93 | 38.5%(+10.6)#1,024 |
| 94. | Orinda | 49.1% | 38.0%(+11.1)#94 | 38.5%(+10.6)#1,025 |
| 95. | Moraga | 49.1% | 38.0%(+11.1)#95 | 38.5%(+10.6)#1,028 |
| 96. | Rohnert Park | 49.0% | 38.0%(+11.0)#96 | 38.5%(+10.5)#1,037 |
| 97. | La Puente | 49.0% | 38.0%(+11.0)#97 | 38.5%(+10.5)#1,038 |
| 98. | View Park Windsor Hills | 49.0% | 38.0%(+11.0)#98 | 38.5%(+10.5)#1,044 |
| 99. | Ladera Ranch | 48.9% | 38.0%(+10.9)#99 | 38.5%(+10.4)#1,056 |
| 100. | Camarillo | 48.8% | 38.0%(+10.8)#100 | 38.5%(+10.3)#1,060 |
Common Questions
What are the Top 10 Cities with the Highest Percentage of Population Taking Public Transit to Work in California?
Top 10 Cities with the Highest Percentage of Population Taking Public Transit to Work in California are:
#1
69.1%
#2
64.9%
#3
64.6%
#4
64.5%
#5
64.5%
#6
62.5%
#7
62.5%
#8
61.4%
#9
60.5%
#10
60.3%
What city has the Highest Percentage of Population Taking Public Transit to Work in California?
Healdsburg has the Highest Percentage of Population Taking Public Transit to Work in California with 69.1%.
What is the Percentage of Population Taking Public Transit to Work in the State of California?
Percentage of Population Taking Public Transit to Work in California is 38.0%.
What is the Percentage of Population Taking Public Transit to Work in the United States?
Percentage of Population Taking Public Transit to Work in the United States is 38.5%.