Cities with the Highest Percentage of Population Employed in Installation, Maintenance & Repair in New York
RELATED REPORTS & OPTIONS
Installation, Maintenance & Repair
New York
Compare Cities
Map of Cities with the Highest Percentage of Population Employed in Installation, Maintenance & Repair in New York
0.0%
60.0%
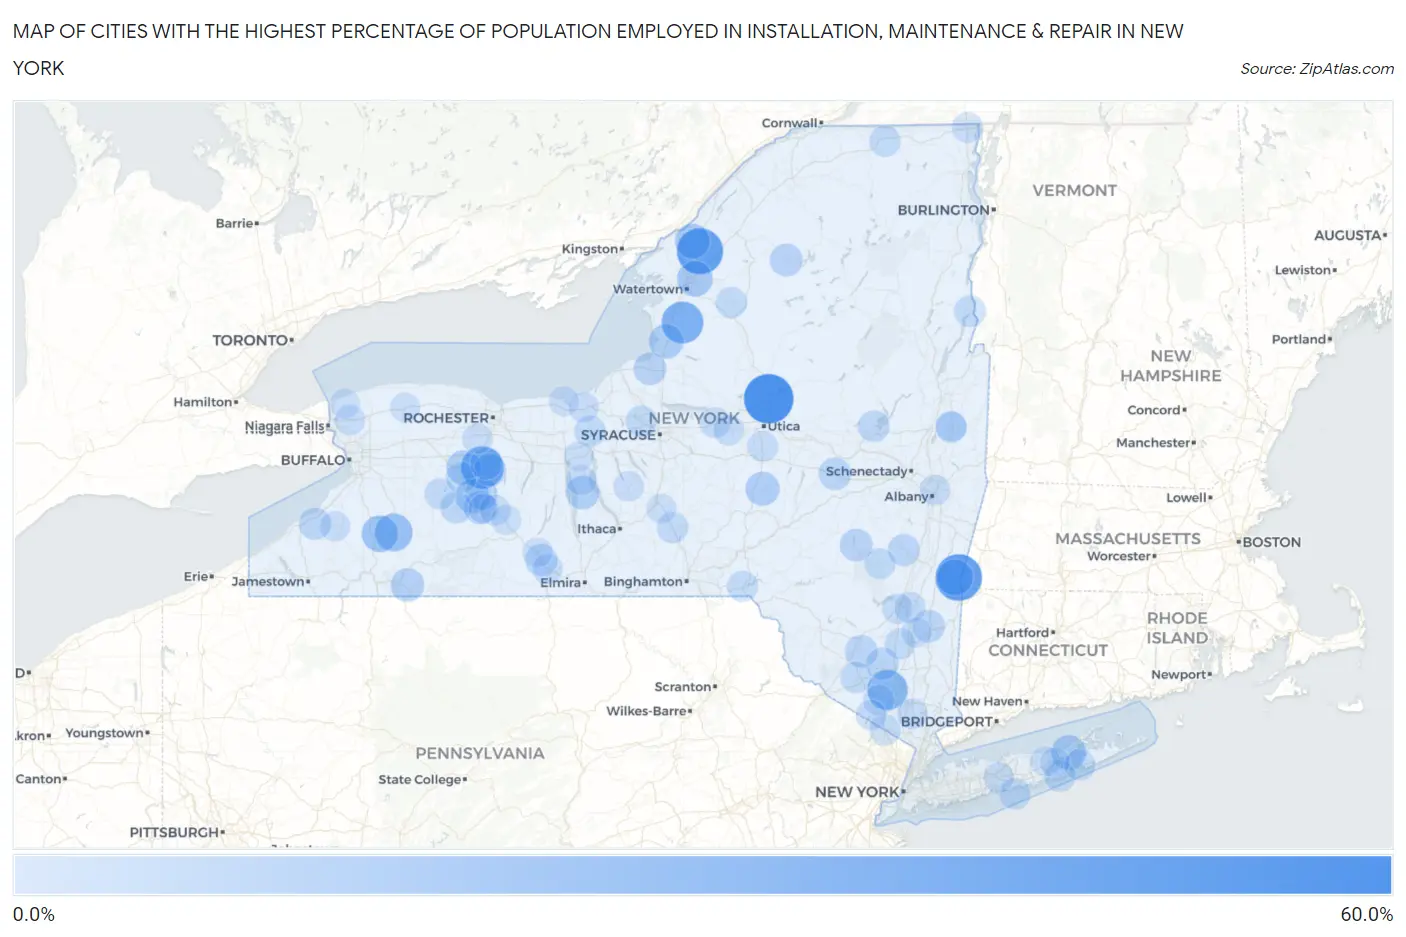
Cities with the Highest Percentage of Population Employed in Installation, Maintenance & Repair in New York
| City | % Employed | vs State | vs National | |
| 1. | Barneveld | 50.8% | 2.3% (+48.5)#1 | 3.1% (+47.8)#70 |
| 2. | Copake Falls | 44.2% | 2.3% (+41.9)#2 | 3.1% (+41.1)#111 |
| 3. | Theresa | 43.1% | 2.3% (+40.8)#3 | 3.1% (+40.1)#117 |
| 4. | Lakeville | 35.2% | 2.3% (+32.9)#4 | 3.1% (+32.2)#196 |
| 5. | Garrattsville | 35.2% | 2.3% (+32.9)#5 | 3.1% (+32.1)#197 |
| 6. | Lorraine | 33.3% | 2.3% (+31.0)#6 | 3.1% (+30.3)#222 |
| 7. | Otter Lake | 33.3% | 2.3% (+31.0)#7 | 3.1% (+30.3)#223 |
| 8. | Haines Falls | 30.0% | 2.3% (+27.7)#8 | 3.1% (+26.9)#281 |
| 9. | Mountain Lodge Park | 29.7% | 2.3% (+27.4)#9 | 3.1% (+26.6)#288 |
| 10. | Conesus | 25.4% | 2.3% (+23.1)#10 | 3.1% (+22.4)#393 |
| 11. | Machias | 23.9% | 2.3% (+21.6)#11 | 3.1% (+20.9)#461 |
| 12. | West Valley | 21.8% | 2.3% (+19.5)#12 | 3.1% (+18.7)#551 |
| 13. | Taconic Shores | 21.0% | 2.3% (+18.7)#13 | 3.1% (+17.9)#604 |
| 14. | Calcium | 19.4% | 2.3% (+17.1)#14 | 3.1% (+16.3)#707 |
| 15. | Plessis | 18.1% | 2.3% (+15.8)#15 | 3.1% (+15.1)#808 |
| 16. | Laurel | 18.0% | 2.3% (+15.7)#16 | 3.1% (+15.0)#818 |
| 17. | Sandy Creek | 17.3% | 2.3% (+15.0)#17 | 3.1% (+14.2)#876 |
| 18. | Retsof | 17.3% | 2.3% (+15.0)#18 | 3.1% (+14.2)#877 |
| 19. | Stittville | 17.2% | 2.3% (+14.9)#19 | 3.1% (+14.1)#883 |
| 20. | Kysorville | 16.7% | 2.3% (+14.4)#20 | 3.1% (+13.6)#948 |
| 21. | Edmeston | 16.0% | 2.3% (+13.7)#21 | 3.1% (+12.9)#1,020 |
| 22. | Ovid | 15.6% | 2.3% (+13.3)#22 | 3.1% (+12.5)#1,063 |
| 23. | Weston Mills | 14.8% | 2.3% (+12.5)#23 | 3.1% (+11.8)#1,182 |
| 24. | Barrytown | 14.6% | 2.3% (+12.3)#24 | 3.1% (+11.6)#1,211 |
| 25. | East Durham | 14.5% | 2.3% (+12.2)#25 | 3.1% (+11.5)#1,229 |
| 26. | Wurtsboro Hills | 14.1% | 2.3% (+11.8)#26 | 3.1% (+11.0)#1,318 |
| 27. | Woodsville | 13.8% | 2.3% (+11.5)#27 | 3.1% (+10.7)#1,379 |
| 28. | Fort Covington | 13.8% | 2.3% (+11.4)#28 | 3.1% (+10.7)#1,387 |
| 29. | Westford | 13.6% | 2.3% (+11.3)#29 | 3.1% (+10.6)#1,407 |
| 30. | Star Lake | 13.6% | 2.3% (+11.3)#30 | 3.1% (+10.5)#1,412 |
| 31. | Swan Lake | 13.4% | 2.3% (+11.1)#31 | 3.1% (+10.3)#1,465 |
| 32. | Mexico | 13.3% | 2.3% (+11.0)#32 | 3.1% (+10.3)#1,477 |
| 33. | Prattsville | 13.3% | 2.3% (+11.0)#33 | 3.1% (+10.3)#1,485 |
| 34. | Scottsburg | 13.0% | 2.3% (+10.7)#34 | 3.1% (+9.98)#1,560 |
| 35. | Sharon Springs | 13.0% | 2.3% (+10.7)#35 | 3.1% (+9.96)#1,567 |
| 36. | Salt Point | 12.9% | 2.3% (+10.6)#36 | 3.1% (+9.87)#1,588 |
| 37. | Walker Valley | 12.9% | 2.3% (+10.6)#37 | 3.1% (+9.83)#1,601 |
| 38. | Walden | 12.7% | 2.3% (+10.3)#38 | 3.1% (+9.59)#1,654 |
| 39. | Livonia Center | 12.5% | 2.3% (+10.2)#39 | 3.1% (+9.43)#1,690 |
| 40. | Campbell | 12.3% | 2.3% (+9.95)#40 | 3.1% (+9.19)#1,763 |
| 41. | Springfield Center | 12.2% | 2.3% (+9.88)#41 | 3.1% (+9.13)#1,781 |
| 42. | Bridgeville | 11.8% | 2.3% (+9.45)#42 | 3.1% (+8.70)#1,896 |
| 43. | Forestville | 11.7% | 2.3% (+9.42)#43 | 3.1% (+8.67)#1,911 |
| 44. | Cairo | 11.7% | 2.3% (+9.41)#44 | 3.1% (+8.66)#1,915 |
| 45. | South Lima | 11.6% | 2.3% (+9.32)#45 | 3.1% (+8.56)#1,936 |
| 46. | Nunda | 11.5% | 2.3% (+9.19)#46 | 3.1% (+8.43)#1,981 |
| 47. | Westernville | 11.5% | 2.3% (+9.16)#47 | 3.1% (+8.41)#1,995 |
| 48. | Mayfield | 11.5% | 2.3% (+9.15)#48 | 3.1% (+8.39)#1,999 |
| 49. | Grahamsville | 11.2% | 2.3% (+8.85)#49 | 3.1% (+8.09)#2,085 |
| 50. | Ticonderoga | 10.9% | 2.3% (+8.60)#50 | 3.1% (+7.85)#2,167 |
| 51. | Ruby | 10.9% | 2.3% (+8.57)#51 | 3.1% (+7.81)#2,185 |
| 52. | Washington Heights | 10.7% | 2.3% (+8.37)#52 | 3.1% (+7.61)#2,257 |
| 53. | East Herkimer | 10.6% | 2.3% (+8.30)#53 | 3.1% (+7.54)#2,280 |
| 54. | Castorland | 10.5% | 2.3% (+8.18)#54 | 3.1% (+7.43)#2,338 |
| 55. | Marathon | 10.4% | 2.3% (+8.13)#55 | 3.1% (+7.37)#2,356 |
| 56. | Fire Island | 10.4% | 2.3% (+8.12)#56 | 3.1% (+7.36)#2,359 |
| 57. | Burke | 10.4% | 2.3% (+8.08)#57 | 3.1% (+7.32)#2,373 |
| 58. | Savannah | 10.4% | 2.3% (+8.06)#58 | 3.1% (+7.30)#2,381 |
| 59. | Village Green | 10.3% | 2.3% (+7.97)#59 | 3.1% (+7.22)#2,429 |
| 60. | Quiogue | 10.1% | 2.3% (+7.80)#60 | 3.1% (+7.05)#2,503 |
| 61. | Clintondale | 10.0% | 2.3% (+7.67)#61 | 3.1% (+6.92)#2,574 |
| 62. | Victory | 9.8% | 2.3% (+7.50)#62 | 3.1% (+6.75)#2,662 |
| 63. | Shinnecock Hills | 9.7% | 2.3% (+7.42)#63 | 3.1% (+6.66)#2,716 |
| 64. | Rhinecliff | 9.7% | 2.3% (+7.36)#64 | 3.1% (+6.61)#2,743 |
| 65. | Hillburn | 9.7% | 2.3% (+7.36)#65 | 3.1% (+6.60)#2,757 |
| 66. | Silver Springs | 9.7% | 2.3% (+7.35)#66 | 3.1% (+6.60)#2,761 |
| 67. | Leicester | 9.6% | 2.3% (+7.29)#67 | 3.1% (+6.53)#2,792 |
| 68. | Hunter | 9.6% | 2.3% (+7.28)#68 | 3.1% (+6.52)#2,799 |
| 69. | Deposit | 9.5% | 2.3% (+7.20)#69 | 3.1% (+6.45)#2,835 |
| 70. | Champlain | 9.4% | 2.3% (+7.12)#70 | 3.1% (+6.37)#2,872 |
| 71. | Clayville | 9.4% | 2.3% (+7.10)#71 | 3.1% (+6.34)#2,888 |
| 72. | Walton Park | 9.3% | 2.3% (+7.02)#72 | 3.1% (+6.27)#2,929 |
| 73. | Hurley | 9.3% | 2.3% (+6.97)#73 | 3.1% (+6.22)#2,956 |
| 74. | Durhamville | 9.2% | 2.3% (+6.90)#74 | 3.1% (+6.14)#2,998 |
| 75. | Wayland | 9.2% | 2.3% (+6.88)#75 | 3.1% (+6.12)#3,007 |
| 76. | Crugers | 9.2% | 2.3% (+6.84)#76 | 3.1% (+6.09)#3,029 |
| 77. | Vernon | 9.0% | 2.3% (+6.72)#77 | 3.1% (+5.96)#3,104 |
| 78. | Islandia | 9.0% | 2.3% (+6.68)#78 | 3.1% (+5.93)#3,124 |
| 79. | Menands | 9.0% | 2.3% (+6.67)#79 | 3.1% (+5.92)#3,130 |
| 80. | Schuylerville | 9.0% | 2.3% (+6.65)#80 | 3.1% (+5.90)#3,141 |
| 81. | Greenwood Lake | 8.9% | 2.3% (+6.63)#81 | 3.1% (+5.88)#3,154 |
| 82. | Scottsville | 8.6% | 2.3% (+6.31)#82 | 3.1% (+5.56)#3,397 |
| 83. | Romulus | 8.5% | 2.3% (+6.18)#83 | 3.1% (+5.43)#3,507 |
| 84. | Coopers Plains | 8.4% | 2.3% (+6.09)#84 | 3.1% (+5.33)#3,585 |
| 85. | Wolcott | 8.4% | 2.3% (+6.06)#85 | 3.1% (+5.31)#3,603 |
| 86. | Moravia | 8.4% | 2.3% (+6.05)#86 | 3.1% (+5.29)#3,607 |
| 87. | Dansville | 8.2% | 2.3% (+5.90)#87 | 3.1% (+5.15)#3,752 |
| 88. | Perrysburg | 8.1% | 2.3% (+5.83)#88 | 3.1% (+5.07)#3,814 |
| 89. | Sanborn | 8.1% | 2.3% (+5.80)#89 | 3.1% (+5.05)#3,833 |
| 90. | New Baltimore | 8.0% | 2.3% (+5.71)#90 | 3.1% (+4.95)#3,919 |
| 91. | Blodgett Mills | 7.9% | 2.3% (+5.60)#91 | 3.1% (+4.85)#4,008 |
| 92. | Waterloo | 7.9% | 2.3% (+5.57)#92 | 3.1% (+4.81)#4,036 |
| 93. | Sodus Point | 7.9% | 2.3% (+5.55)#93 | 3.1% (+4.80)#4,045 |
| 94. | Cohocton | 7.9% | 2.3% (+5.54)#94 | 3.1% (+4.79)#4,058 |
| 95. | Ransomville | 7.8% | 2.3% (+5.51)#95 | 3.1% (+4.76)#4,081 |
| 96. | Medina | 7.8% | 2.3% (+5.46)#96 | 3.1% (+4.70)#4,133 |
| 97. | Calverton | 7.8% | 2.3% (+5.45)#97 | 3.1% (+4.70)#4,137 |
| 98. | Riverside | 7.7% | 2.3% (+5.41)#98 | 3.1% (+4.65)#4,173 |
| 99. | Savona | 7.7% | 2.3% (+5.41)#99 | 3.1% (+4.65)#4,175 |
| 100. | Haviland | 7.7% | 2.3% (+5.36)#100 | 3.1% (+4.61)#4,236 |
Common Questions
What are the Top 10 Cities with the Highest Percentage of Population Employed in Installation, Maintenance & Repair in New York?
Top 10 Cities with the Highest Percentage of Population Employed in Installation, Maintenance & Repair in New York are:
#1
50.8%
#2
44.2%
#3
43.1%
#4
35.2%
#5
33.3%
#6
29.7%
#7
23.9%
#8
21.8%
#9
21.0%
#10
19.4%
What city has the Highest Percentage of Population Employed in Installation, Maintenance & Repair in New York?
Barneveld has the Highest Percentage of Population Employed in Installation, Maintenance & Repair in New York with 50.8%.
What is the Percentage of Population Employed in Installation, Maintenance & Repair in the State of New York?
Percentage of Population Employed in Installation, Maintenance & Repair in New York is 2.3%.
What is the Percentage of Population Employed in Installation, Maintenance & Repair in the United States?
Percentage of Population Employed in Installation, Maintenance & Repair in the United States is 3.1%.