Cities with the Highest Percentage of Chippewa Population in California
RELATED REPORTS & OPTIONS
Chippewa
California
Compare Cities
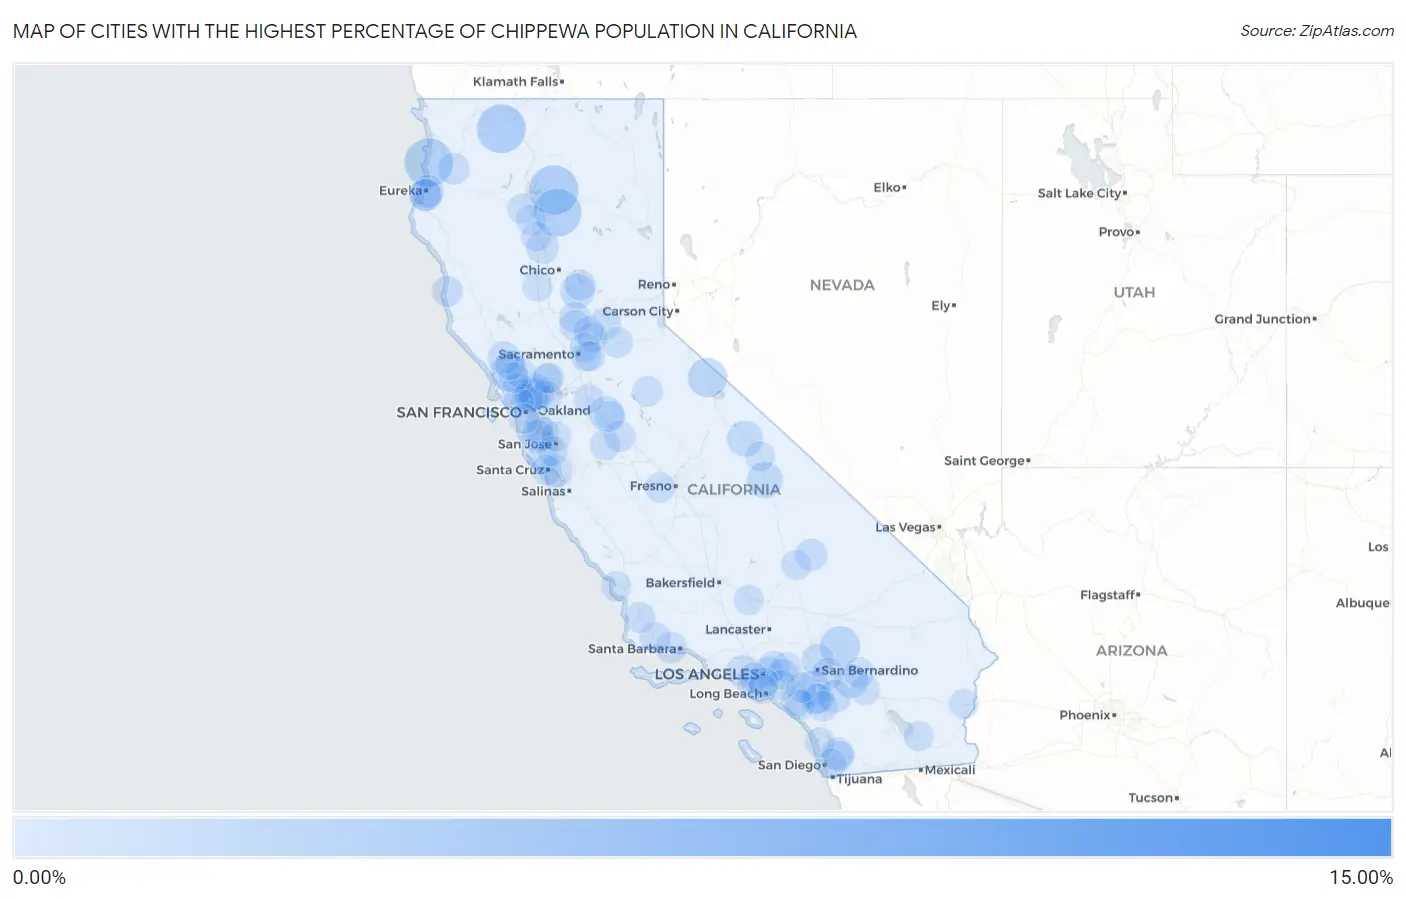
Map of Cities with the Highest Percentage of Chippewa Population in California
0.00%
15.00%
Cities with the Highest Percentage of Chippewa Population in California
| City | Chippewa | vs State | vs National | |
| 1. | Ono | 14.81% | 0.024%(+14.8)#1 | 0.058%(+14.8)#73 |
| 2. | Round Mountain | 3.00% | 0.024%(+2.98)#2 | 0.058%(+2.94)#268 |
| 3. | Fort Jones | 2.91% | 0.024%(+2.89)#3 | 0.058%(+2.85)#273 |
| 4. | Big Lagoon | 2.88% | 0.024%(+2.86)#4 | 0.058%(+2.83)#277 |
| 5. | Shingletown | 2.76% | 0.024%(+2.73)#5 | 0.058%(+2.70)#289 |
| 6. | Lucerne Valley | 1.61% | 0.024%(+1.59)#6 | 0.058%(+1.55)#445 |
| 7. | Bridgeport | 1.47% | 0.024%(+1.45)#7 | 0.058%(+1.41)#479 |
| 8. | Cotati | 1.23% | 0.024%(+1.21)#8 | 0.058%(+1.17)#563 |
| 9. | Lake Mathews | 0.95% | 0.024%(+0.931)#9 | 0.058%(+0.897)#669 |
| 10. | Round Valley | 0.95% | 0.024%(+0.923)#10 | 0.058%(+0.889)#675 |
| 11. | Independence | 0.94% | 0.024%(+0.917)#11 | 0.058%(+0.883)#678 |
| 12. | Crockett | 0.92% | 0.024%(+0.899)#12 | 0.058%(+0.866)#684 |
| 13. | Del Rio | 0.87% | 0.024%(+0.849)#13 | 0.058%(+0.815)#705 |
| 14. | Palermo | 0.74% | 0.024%(+0.719)#14 | 0.058%(+0.686)#784 |
| 15. | Whitewater | 0.59% | 0.024%(+0.562)#15 | 0.058%(+0.528)#939 |
| 16. | Pinole | 0.58% | 0.024%(+0.557)#16 | 0.058%(+0.523)#949 |
| 17. | Hemet | 0.49% | 0.024%(+0.470)#17 | 0.058%(+0.436)#1,024 |
| 18. | Tehama | 0.48% | 0.024%(+0.451)#18 | 0.058%(+0.417)#1,051 |
| 19. | East Palo Alto | 0.46% | 0.024%(+0.440)#19 | 0.058%(+0.406)#1,066 |
| 20. | Eureka | 0.45% | 0.024%(+0.429)#20 | 0.058%(+0.395)#1,082 |
| 21. | Crestline | 0.44% | 0.024%(+0.415)#21 | 0.058%(+0.381)#1,101 |
| 22. | Windsor | 0.43% | 0.024%(+0.409)#22 | 0.058%(+0.375)#1,107 |
| 23. | Pine Hills | 0.43% | 0.024%(+0.404)#23 | 0.058%(+0.370)#1,119 |
| 24. | Meadow Vista | 0.42% | 0.024%(+0.394)#24 | 0.058%(+0.360)#1,127 |
| 25. | West Menlo Park | 0.41% | 0.024%(+0.388)#25 | 0.058%(+0.354)#1,144 |
| 26. | Searles Valley | 0.41% | 0.024%(+0.384)#26 | 0.058%(+0.350)#1,147 |
| 27. | Topanga | 0.40% | 0.024%(+0.378)#27 | 0.058%(+0.345)#1,157 |
| 28. | Rio Del Mar | 0.40% | 0.024%(+0.376)#28 | 0.058%(+0.342)#1,160 |
| 29. | Eucalyptus Hills | 0.39% | 0.024%(+0.361)#29 | 0.058%(+0.327)#1,192 |
| 30. | Pacheco | 0.38% | 0.024%(+0.353)#30 | 0.058%(+0.319)#1,202 |
| 31. | Rodeo | 0.36% | 0.024%(+0.340)#31 | 0.058%(+0.306)#1,223 |
| 32. | Franklin Cdp Merced County | 0.36% | 0.024%(+0.332)#32 | 0.058%(+0.298)#1,238 |
| 33. | Mentone | 0.35% | 0.024%(+0.326)#33 | 0.058%(+0.292)#1,254 |
| 34. | Boulder Creek | 0.35% | 0.024%(+0.322)#34 | 0.058%(+0.288)#1,260 |
| 35. | Humboldt Hill | 0.34% | 0.024%(+0.312)#35 | 0.058%(+0.278)#1,280 |
| 36. | Goleta | 0.30% | 0.024%(+0.276)#36 | 0.058%(+0.242)#1,357 |
| 37. | Hoopa | 0.28% | 0.024%(+0.257)#37 | 0.058%(+0.223)#1,392 |
| 38. | Solvang | 0.27% | 0.024%(+0.241)#38 | 0.058%(+0.207)#1,421 |
| 39. | Olivehurst | 0.26% | 0.024%(+0.234)#39 | 0.058%(+0.201)#1,438 |
| 40. | Kelly Ridge | 0.25% | 0.024%(+0.229)#40 | 0.058%(+0.195)#1,452 |
| 41. | Camp Pendleton Mainside | 0.24% | 0.024%(+0.216)#41 | 0.058%(+0.182)#1,497 |
| 42. | Foster City | 0.24% | 0.024%(+0.214)#42 | 0.058%(+0.180)#1,503 |
| 43. | Delhi | 0.23% | 0.024%(+0.206)#43 | 0.058%(+0.172)#1,529 |
| 44. | Novato | 0.22% | 0.024%(+0.197)#44 | 0.058%(+0.163)#1,552 |
| 45. | Fort Bragg | 0.20% | 0.024%(+0.176)#45 | 0.058%(+0.142)#1,600 |
| 46. | Winter Gardens | 0.20% | 0.024%(+0.173)#46 | 0.058%(+0.139)#1,609 |
| 47. | Orcutt | 0.19% | 0.024%(+0.166)#47 | 0.058%(+0.132)#1,636 |
| 48. | North Richmond | 0.19% | 0.024%(+0.164)#48 | 0.058%(+0.130)#1,638 |
| 49. | Suisun City | 0.18% | 0.024%(+0.160)#49 | 0.058%(+0.126)#1,650 |
| 50. | Cedar Ridge | 0.18% | 0.024%(+0.158)#50 | 0.058%(+0.124)#1,653 |
| 51. | Morongo Valley | 0.18% | 0.024%(+0.153)#51 | 0.058%(+0.119)#1,676 |
| 52. | Mill Valley | 0.18% | 0.024%(+0.152)#52 | 0.058%(+0.118)#1,683 |
| 53. | Sierra Madre | 0.17% | 0.024%(+0.146)#53 | 0.058%(+0.113)#1,713 |
| 54. | Cottonwood | 0.17% | 0.024%(+0.146)#54 | 0.058%(+0.112)#1,716 |
| 55. | Placerville | 0.17% | 0.024%(+0.144)#55 | 0.058%(+0.110)#1,724 |
| 56. | Glendora | 0.17% | 0.024%(+0.143)#56 | 0.058%(+0.109)#1,729 |
| 57. | Santa Cruz | 0.16% | 0.024%(+0.134)#57 | 0.058%(+0.100)#1,766 |
| 58. | Newman | 0.15% | 0.024%(+0.131)#58 | 0.058%(+0.097)#1,777 |
| 59. | Canyon Lake | 0.15% | 0.024%(+0.129)#59 | 0.058%(+0.095)#1,791 |
| 60. | Riverbank | 0.15% | 0.024%(+0.125)#60 | 0.058%(+0.091)#1,802 |
| 61. | Rosemont | 0.15% | 0.024%(+0.123)#61 | 0.058%(+0.089)#1,815 |
| 62. | Murrieta | 0.14% | 0.024%(+0.121)#62 | 0.058%(+0.087)#1,827 |
| 63. | Lake Elsinore | 0.14% | 0.024%(+0.116)#63 | 0.058%(+0.082)#1,847 |
| 64. | Centerville | 0.14% | 0.024%(+0.112)#64 | 0.058%(+0.078)#1,862 |
| 65. | Plumas Lake | 0.13% | 0.024%(+0.109)#65 | 0.058%(+0.075)#1,875 |
| 66. | West Covina | 0.13% | 0.024%(+0.108)#66 | 0.058%(+0.074)#1,876 |
| 67. | University Of California-Santa Barbara | 0.13% | 0.024%(+0.107)#67 | 0.058%(+0.073)#1,881 |
| 68. | Willows | 0.13% | 0.024%(+0.105)#68 | 0.058%(+0.071)#1,887 |
| 69. | Rocklin | 0.12% | 0.024%(+0.100)#69 | 0.058%(+0.066)#1,901 |
| 70. | Boyes Hot Springs | 0.12% | 0.024%(+0.098)#70 | 0.058%(+0.064)#1,913 |
| 71. | Lake Forest | 0.12% | 0.024%(+0.095)#71 | 0.058%(+0.061)#1,926 |
| 72. | Los Osos | 0.12% | 0.024%(+0.092)#72 | 0.058%(+0.058)#1,942 |
| 73. | Coto De Caza | 0.12% | 0.024%(+0.091)#73 | 0.058%(+0.057)#1,951 |
| 74. | Corona | 0.11% | 0.024%(+0.089)#74 | 0.058%(+0.055)#1,959 |
| 75. | Manhattan Beach | 0.11% | 0.024%(+0.087)#75 | 0.058%(+0.053)#1,968 |
| 76. | Los Gatos | 0.11% | 0.024%(+0.082)#76 | 0.058%(+0.048)#1,987 |
| 77. | Alhambra | 0.11% | 0.024%(+0.082)#77 | 0.058%(+0.048)#1,988 |
| 78. | Milpitas | 0.10% | 0.024%(+0.081)#78 | 0.058%(+0.047)#1,993 |
| 79. | Kerman | 0.094% | 0.024%(+0.070)#79 | 0.058%(+0.036)#2,033 |
| 80. | Fairfield | 0.090% | 0.024%(+0.067)#80 | 0.058%(+0.033)#2,053 |
| 81. | Petaluma | 0.087% | 0.024%(+0.063)#81 | 0.058%(+0.029)#2,069 |
| 82. | Daly City | 0.087% | 0.024%(+0.063)#82 | 0.058%(+0.029)#2,073 |
| 83. | Tehachapi | 0.086% | 0.024%(+0.062)#83 | 0.058%(+0.028)#2,078 |
| 84. | Blythe | 0.084% | 0.024%(+0.060)#84 | 0.058%(+0.026)#2,091 |
| 85. | Red Bluff | 0.082% | 0.024%(+0.058)#85 | 0.058%(+0.025)#2,102 |
| 86. | Lincoln | 0.076% | 0.024%(+0.052)#86 | 0.058%(+0.018)#2,140 |
| 87. | Culver City | 0.074% | 0.024%(+0.050)#87 | 0.058%(+0.017)#2,150 |
| 88. | Encinitas | 0.074% | 0.024%(+0.050)#88 | 0.058%(+0.016)#2,152 |
| 89. | Cathedral City | 0.073% | 0.024%(+0.049)#89 | 0.058%(+0.015)#2,161 |
| 90. | Stockton | 0.069% | 0.024%(+0.045)#90 | 0.058%(+0.012)#2,191 |
| 91. | Lemon Grove | 0.069% | 0.024%(+0.045)#91 | 0.058%(+0.011)#2,194 |
| 92. | Fullerton | 0.068% | 0.024%(+0.044)#92 | 0.058%(+0.010)#2,202 |
| 93. | North Highlands | 0.064% | 0.024%(+0.041)#93 | 0.058%(+0.007)#2,226 |
| 94. | Ridgecrest | 0.064% | 0.024%(+0.040)#94 | 0.058%(+0.006)#2,229 |
| 95. | Big Pine | 0.064% | 0.024%(+0.040)#95 | 0.058%(+0.006)#2,230 |
| 96. | Mather | 0.064% | 0.024%(+0.040)#96 | 0.058%(+0.006)#2,232 |
| 97. | Santa Rosa | 0.063% | 0.024%(+0.039)#97 | 0.058%(+0.005)#2,237 |
| 98. | Carson | 0.062% | 0.024%(+0.039)#98 | 0.058%(+0.005)#2,242 |
| 99. | Willowbrook | 0.062% | 0.024%(+0.038)#99 | 0.058%(+0.004)#2,243 |
| 100. | Calipatria | 0.061% | 0.024%(+0.037)#100 | 0.058%(+0.003)#2,247 |
Common Questions
What are the Top 10 Cities with the Highest Percentage of Chippewa Population in California?
Top 10 Cities with the Highest Percentage of Chippewa Population in California are:
#1
3.00%
#2
2.91%
#3
2.88%
#4
2.76%
#5
1.61%
#6
1.47%
#7
1.23%
#8
0.95%
#9
0.95%
#10
0.94%
What city has the Highest Percentage of Chippewa Population in California?
Round Mountain has the Highest Percentage of Chippewa Population in California with 3.00%.
What is the Percentage of Chippewa Population in the State of California?
Percentage of Chippewa Population in California is 0.024%.
What is the Percentage of Chippewa Population in the United States?
Percentage of Chippewa Population in the United States is 0.058%.